
Speech-Based Supervised Learning Towards the Diagnosis of
Amyotrophic Lateral Sclerosis
Ricardo Cebola
1,2 a
, Duarte Folgado
1,2 b
, Andr
´
e V. Carreiro
1 c
and Hugo Gamboa
1,2 d
1
Associac¸
˜
ao Fraunhofer Portugal Research, Rua Alfredo Allen 455/461, 4200-135 Porto, Portugal
2
LIBPhys (Laboratory for Instrumentation, Biomedical Engineering and Radiation Physics), NOVA School of Science and
Technology, Campus de Caparica, 2829-516, Portugal
Keywords:
Amyotrophic Lateral Sclerosis, Speech, Automatic Speech Analysis, Signal Processing, Machine Learning,
Supervised Learning.
Abstract:
Amyotrophic Lateral Sclerosis (ALS) diagnosis requires extensive clinical examinations, often leading to
delays and a burden to patients and their caregivers. Speech has emerged in the literature as a promis-
ing biomarker for neurodegenerative diseases capable of being integrated into telemonitoring solutions. We
present a comprehensive study with several phonatory tasks and speech features to evaluate the generalisa-
tion potential of models for ALS diagnosis. We use a public dataset with sustained vowels (N=64) and data
with ALS and healthy volunteers being collected from ongoing research trials (N=22). Two approaches were
considered: i) sample-based, where the signals were divided into fixed-length windows, and ii) patient-based,
where a voting system was implemented based on the sample-based classification of each patient. We achieved
a mean diagnostic performance with an F1-score over 80%. The best scores for the sample and patient-based
classifications are 96% and 100% for vowels, 96% and 95% for sentences and 82% and 87% for cough. Our
findings support speech as a promising digital biomarker and pave the way for remote examination at patients’
residences, increasing the data available for clinicians for better diagnosis and prognosis of ALS.
1 INTRODUCTION
Amyotrophic Lateral Sclerosis (ALS) is an incurable
neurodegenerative disease where the loss of motor
neurons leads to rapidly progressing muscle weak-
ness and atrophy. Currently, survival is limited to 2–5
years after disease onset (Masrori and Van Damme,
2020). The diagnosis of ALS still proves challeng-
ing due to its complex pathogenesis (Talbott et al.,
2016; Masrori and Van Damme, 2020; Fernandes
et al., 2021). The clinical manifestations of the dis-
ease are diverse, with roughly two-thirds of patients
having spinal onset and displaying initial symptoms
in the upper and lower limbs. The remaining third
have bulbar system onset, which presents most com-
monly with dysarthria or dysphagia (Masrori and Van
Damme, 2020). Signs of upper motor neuron (UMN)
and lower motor neuron (LMN) symptoms in patients
showing gradual muscle weakness without any other
possible explanation constitute the basis for ALS di-
a
https://orcid.org/0000-0002-0294-7797
b
https://orcid.org/0000-0002-8481-6079
c
https://orcid.org/0000-0002-4234-5336
d
https://orcid.org/0000-0002-4022-7424
agnosis (Masrori and Van Damme, 2020). Medical
history and extensive clinical examination are needed
to rule out other conditions. This process still requires
frequent clinical assessments and hospital visits, lead-
ing to diagnostic delays and causing a considerable
burden to patients and their caregivers. This delay
can reach up to a year from symptoms onset to con-
firmation (Paganoni et al., 2014). The implications of
long delays in ALS diagnosis are significant, as they
shorten the opportunity window for patients to begin
treatment and enrol in clinical trials at an early stage
(Paganoni et al., 2014).
Biomarkers could be crucial in supporting an early
diagnosis of ALS, measuring disease severity and
progression, and enhancing patient stratification in
clinical trials. Even so, thus far, no simple and ob-
jective biomarkers have been discovered (Masrori and
Van Damme, 2020; Fernandes et al., 2021; Youn
et al., 2021). Recently, researchers have changed their
focus to biosignals, which can be easily recorded and
applied in telemonitoring systems (Fernandes et al.,
2021; Ramanarayanan et al., 2022).
There has been a growing interest in exploring
speech as a biomarker for ALS. Specifically, speech
requires the intricate coordination of multiple cog-
74
Cebola, R., Folgado, D., Carreiro, A. and Gamboa, H.
Speech-Based Supervised Learning Towards the Diagnosis of Amyotrophic Lateral Sclerosis.
DOI: 10.5220/0011694700003414
In Proceedings of the 16th International Joint Conference on Biomedical Engineering Systems and Technologies (BIOSTEC 2023) - Volume 4: BIOSIGNALS, pages 74-85
ISBN: 978-989-758-631-6; ISSN: 2184-4305
Copyright
c
2023 by SCITEPRESS – Science and Technology Publications, Lda. Under CC license (CC BY-NC-ND 4.0)

nitive, affective, linguistic, and motoric processes,
which result in a wide range of behaviours that pro-
vide rich insights into neurological and motor func-
tions. This suggests that speech may be a promising
marker for numerous neurological and neurodegener-
ative conditions (Ramanarayanan et al., 2022).
Automatic speech analysis may be a promising
tool for the diagnosis and prognosis of ALS. This
technique has recently been applied to other neu-
rological diseases, such as Parkinson’s Disease and
Cerebral Palsy, showing promising results (Orozco-
Arroyave et al., 2018; Vasquez-Correa et al., 2020;
Janbakhshi and Kodrasi, 2021; Sztah
´
o. et al., 2021).
Speech production decline is suggested to be among
the earliest indicators of bulbar motor system in-
volvement. Hence, speech degeneration is one of
the critical aspects of disease progression, espe-
cially among patients with bulbar onset. Extracting
new interpretable features from speech, which can
be correlated to existing disease progression quan-
tification methods and clinical outcomes, can con-
tribute to proving such features as biomarkers for
ALS (An et al., 2018; Stegmann et al., 2020; Vashke-
vich and Rushkevich, 2021; Vieira et al., 2022).
These features may improve patient stratification and
advance knowledge on the underlying pathological
processes affecting speech production (G
´
omez-Vilda
et al., 2013). Different Machine Learning (ML) and
Deep Learning (DL) methodologies have been ap-
plied in this context. Novel speech features have
been proposed in the literature to assess their value
as biomarkers. Stegmann et al. remotely followed
65 ALS patients at home via a mobile application for
up to nine months, who provided speech samples and
ALS Functional Rating Scale-Revised (ALSFRS-R)
scores (Stegmann et al., 2020). The remotely col-
lected speech was used to assess the Articulatory Pre-
cision (AP) and Speaking Rate (SR) through auto-
matic speech analysis. The authors used mixed-effect
models to evaluate if changes in these features could
precede a decline in the ALSFRS-R bulbar sub-scale.
A Growth Curve Model (GCM) was also used to eval-
uate the sensitivity of these features to estimate lon-
gitudinal changes in the speech of ALS patients. In
another study, Vashkevish et al. developed an ML ap-
proach for ALS diagnosis based on speech features
extracted from sustained vowels recordings (Vashke-
vich and Rushkevich, 2021). A large feature set was
analysed, comprised of widely used speech features
and novel features proposed by the authors. Various
feature selection algorithms were used to assess the
most discriminant features for training a Linear Dis-
criminant Analysis (LDA) classifier.
Regarding DL approaches, An et al. acquired
speech recordings from age- and gender-matched
ALS and healthy subjects to study the feasibility
of using a Convolutional Neural Network (CNN)
based representation learning for early ALS diagno-
sis (An et al., 2018). The authors developed time
and frequency-domain CNNs and compared their per-
formance with a baseline Artificial Neural Network
(ANN). Similarly, CNNs were also used in a recent
study by Vieira et al. to develop novel objective ALS
disease severity measures based on speech and ac-
celerometer data (Vieira et al., 2022). The authors
followed a large cohort of 584 ALS patients over four
years and remotely collected self-reported ALSFRS-
R scores, speech recordings and limb-related ac-
celerometer data. This data was then used to develop
a voice model to predict bulbar-related ALSFRS-R
scores and an accelerometer model to predict limb-
related ALSFRS-R scores, further supporting tele-
monitoring strategies as low-cost and practical solu-
tions that work well with biosignals and can regularly
collect a greater volume of high-quality data.
This work studies several phonatory tasks and
speech features to evaluate the generalisation po-
tential of different ML models. Our contributions
focus on developing an automatic speech analysis
framework for supporting the diagnosis of ALS using
speech data. Several supervised learning models were
studied with general-purpose features from tempo-
ral, statistical, and spectral domains calculated using
the Time Series Feature Extraction Library (TSFEL)
(Barandas et al., 2020) along with a dedicated feature
set for speech analysis. Furthermore, we investigate
the adequacy of performing different phonatory tasks
for remote data collection via a mobile phone.
The paper is structured as follows: Section 2 de-
scribes the datasets used, the proposed machine learn-
ing pipeline and the experimental setup. The results
are presented and discussed in Section 3. Finally, Sec-
tion 4 summarises the conclusions and limitations of
this work, along with some recommendations for fu-
ture work.
2 MATERIAL AND METHODS
We developed an automatic speech analysis frame-
work for diagnosing ALS, capable of distinguishing
between ALS and Healthy Controls (HCs) in a bi-
nary classification scenario using speech data. This
framework was divided into three stages: preprocess-
ing, feature extraction, and classification. Figure 1
illustrates the proposed framework.
The first stage describes the preprocessing of
speech signals from the different phonatory tasks,
Speech-Based Supervised Learning Towards the Diagnosis of Amyotrophic Lateral Sclerosis
75
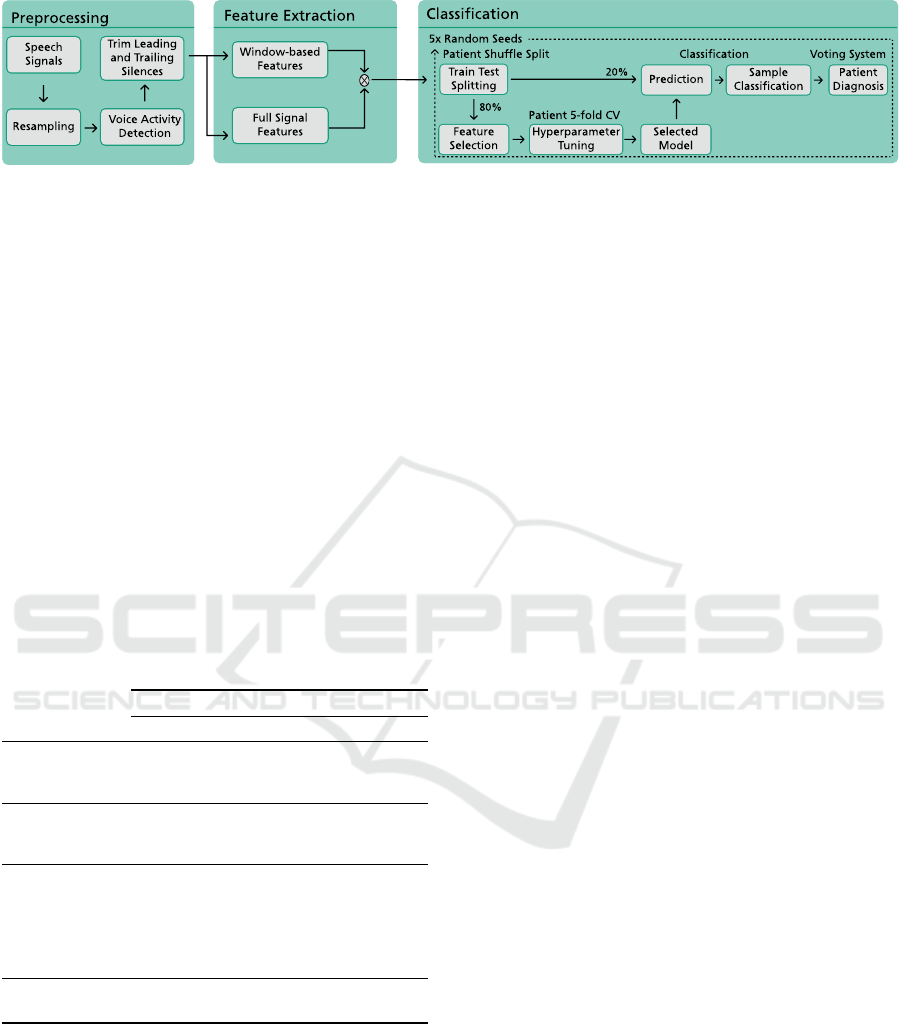
Figure 1: Proposed framework for the diagnosis of Amyotrophic Lateral Sclerosis from the speech signal.
particularly resampling and voice activity detection.
Feature extraction addresses the computation of the
general-purpose features using TSFEL (Barandas
et al., 2020) and the speech-dedicated features. Fi-
nally, the classification stage details the implemented
ML pipeline, which is divided into five steps: data
splitting, hyperparameter optimization, model train-
ing, sample classification and patient diagnosis.
Before detailing the implemented methodology, a
description of the working datasets follows.
2.1 Datasets
Two datasets were explored in this work, a public
dataset from (Vashkevich and Rushkevich, 2021) to-
gether with data from ALS and healthy volunteers
collected from ongoing research trials. Table 1 com-
pares these two datasets.
Table 1: The HomeSenseALS and Minsk datasets.
HomeSenseALS (N=22) Minsk (N=64)
ALS Healthy ALS Healthy
Gender
F
M
6 5 14 20
3 8 17 13
Age (years)
F
M
62±11 25±3
57±8 61±8
56±10 50±14
Phonatory Tasks
Sentences
Vowel /a/
Vowel /i/
Vowel /u/
Cough
√
—
√ √
√ √
√
—
√
—
Sampling
Frequency (kHz)
48 8 44.1
2.1.1 HomeSenseALS Dataset
A European Portuguese voice dataset is being con-
structed with voice recordings from ALS patients
and healthy volunteers acquired in ongoing research
trials (N=22). The recording protocol follows the
guidelines from the 2
nd
European Portuguese Version
of the Consensus Auditory-Perceptual Evaluation of
Voice (II EP CAPE-V) (de Almeida et al., 2019) with
slight differences between ALS patients and HCs.
ALS Patients: The protocol followed the complete
II EP CAPE-V assessment, with an additional
phonatory task (”cough”, recorded three times) and
some changes to the ”sustained vowels” task (added
vowel /u/, besides vowels /a/ and /i/; thrice recorded).
All speech recordings were collected using a mobile
phone during a routine visit to the clinic. The
researcher held the mobile phone and positioned it
so that the screen was always facing the patient at
a distance of approximately 20 cm from the face.
Only during the ”cough” task the mobile phone was
positioned to the side while the patient performed the
task. The acquisitions were always recorded with the
same mobile phone and in the same room.
Healthy Controls: Healthy volunteers were recruited
during our research to create a control group. Multi-
ple recording sessions were performed per participant
for two months. Most participants recorded six ses-
sions, except for two subjects that could only record
two sessions during this period.
The recording protocol was a simplified version
of the one performed for ALS patients, where each
phonatory task was only recorded once. Further-
more, only one sentence was considered for the ”sen-
tences” phonatory task (”A Z
´
e, m
˜
ae do Gabriel, deu-
lhe um bolo de laranja e vinho velho de Runa”). All
speech recordings were collected using the same mo-
bile phone and always in the same quiet room. The
mobile phone was positioned the same way as de-
scribed for the ALS patients, although held by the par-
ticipant. The participants remained standing through
the session and always waited one second before start-
ing and stopping each speech recording.
2.1.2 Minsk Dataset
This public dataset was collected in the Republican
Research and Clinical Center of Neurology and Neu-
rosurgery (Minsk, Belarus) (Vashkevich and Rushke-
vich, 2021). Each participant was asked to record
a sustained phonation of the vowels /a/ and /i/ at a
comfortable pitch and loudness for as long as possi-
BIOSIGNALS 2023 - 16th International Conference on Bio-inspired Systems and Signal Processing
76
ble. Every participant only recorded each vowel once.
This voice database is almost balanced and contains
48% of pathological recordings and 52% of healthy
recordings. Each sample was acquired using differ-
ent mobile phones and regular headsets. For a more
comprehensive description of the dataset and descrip-
tion of the experimental procedures, the reader might
refer to the author’s original work (Vashkevich and
Rushkevich, 2021).
2.2 Preprocessing
Preprocessing starts with resampling signals to 8 kHz
because speech signals from different datasets have
been recorded at distinct sampling frequencies. After
resampling, voice activity detection follows.
Voice activity detection identifies the presence of
human speech in an audio signal containing a mix-
ture of speech and noise. The Voice Activity Detec-
tor (VAD) used in this work was adopted from the
WebRTC project for its good baseline performance
and open-source nature (WebRTC, 2018; Ko et al.,
2018). WebRTC’s VAD extracts the logarithm of en-
ergy from the speech signal’s six frequency bands be-
tween 80 Hz - 4000 Hz. It calculates the probabilities
for both speech and background noise from these en-
ergies using Gaussian Mixture Models (GMM).
The VAD identifies the spoken segments of the
signals as ”non-silence”, with the remaining segments
classified as ”silence”. After voice activity detec-
tion, the initial and final silences from the signals are
trimmed since they do not contain relevant informa-
tion. This is the final preprocessing step for the cough
and sentence signals before feature extraction. Vow-
els /a/, /i/, and /u/ are further combined into a single
signal, denoted as ”vowels” hereafter.
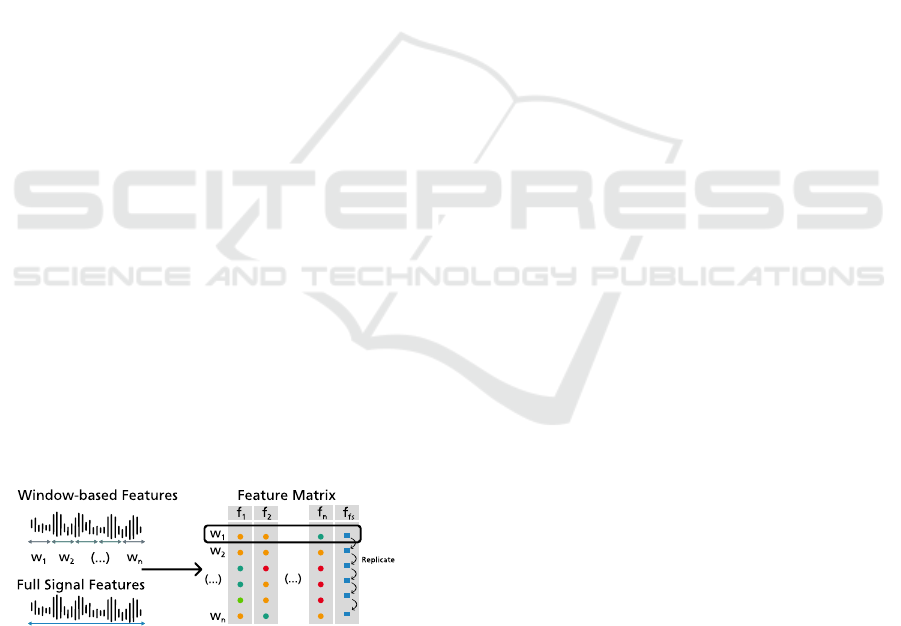
2.3 Feature Extraction
Figure 2: Feature extraction and feature fusion pipeline,
where w
i
is a short-time window of the signal, f
i
represents
a short-time feature and f
f s
illustrates a full-signal feature.
Feature extraction ensues, where two groups of fea-
tures are considered: window-based features, cal-
culated within consecutive time windows along the
speech signal; and full signal features, computed from
the complete speech signal. Figure 2 illustrates the
feature extraction process. The complete list of fea-
tures is available in Appendix.
2.3.1 Window-Based Features
Short-time window features are extracted only on the
voiced portions of the speech signals. Each non-
silence segment is divided into overlapping windows,
and the complete feature set is extracted for each.
This process is repeated for all subjects to originate
a feature matrix, mapping each row, representing a
sample, to a column, representing a feature value.
More specifically, each sample corresponds to a short-
time window from the signal’s non-silence segments.
As such, each subject has multiple signals from differ-
ent phonatory tasks associated with multiple samples.
This work used a window size of 250 ms, with a 50 %
overlap between windows.
Window-based features include general-purpose
features from the temporal, spectral and statistical
domains extracted using TSFEL. Other features re-
lated to pathological speech analysis were also ex-
plored. Speech-dedicated features were extracted us-
ing the reference software library for speech analy-
sis and linguistics, Praat, which contains some of the
most popular features for linguistics and speech re-
search (Boersma, 2001; Mekyska et al., 2015). The
Parselmouth library (Jadoul et al., 2018) was used
for computing the Praat features in Python. Be-
sides Praat features, speech-related features from the
spectral domain were also calculated (Brown et al.,
2020; Mekyska et al., 2015; Boghdady et al., 2021;
Delgado-Hern
´
andez et al., 2018).
2.3.2 Full Signal Features
Full signal features are extracted from the complete
speech signal. Early feature fusion is performed to
combine the two feature types. The adopted strat-
egy replicates the full signal features extracted from a
speech signal through all the short-time window sam-
ples associated with the same signal.
These features include silence features and for-
mant features. Silence features were specifically com-
puted from speech signals recorded for the ”sen-
tences” phonatory task. They give information on
how much time each person produced speech and the
amount of pause time they took while reading the
complete sentence. On the other hand, formant fea-
tures were adopted from G
´
omez-Vilda et al. (G
´
omez-
Vilda et al., 2015). The formants used for calculating
these features are estimated following the procedure
from (MathWorks, 2022).
Speech-Based Supervised Learning Towards the Diagnosis of Amyotrophic Lateral Sclerosis
77
2.4 Classification
A supervised learning pipeline was developed to
distinguish between ALS patients and HCs. This
pipeline is divided into five steps: data splitting,
feature selection, hyperparameter optimization and
model training, sample classification, and patient di-
agnosis. The ML classifiers selected for this task
were Support Vector Machines (SVM), Logistic Re-
gression (LR), Naive Bayes (NB), Decision Tree (DT)
and Random Forest (RF). These steps were repeated
five times for five different random seeds to test differ-
ent train and test divisions and different hyperparam-
eter search spaces. For each classifier, the considered
results for analysis are given as the mean and stan-
dard deviation of each evaluation metric across the
five seeds.
2.4.1 Data Splitting and Feature Selection
The data splitting procedure divides the feature ma-
trix into training and test sets. A Patient Shuffle Split
method was used to ensure that no samples from the
same subject leaked from one feature set to the other
(Pedregosa et al., 2011). Approximately 80% of the
subjects were used for the training set, while the re-
maining 20% formed the test set. The shuffling pro-
cess produced a balanced test set regarding class, gen-
der, and dataset distributions.
Afterwards, feature selection was performed to re-
duce the feature set and eliminate the less discrimi-
nating features. A variance threshold was used to re-
move constant features, whereas a correlation thresh-
old removed features with a correlation coefficient
over 0.80 by computing the pairwise Pearson’s cor-
relation. The feature selection methods were applied
only to the training set, and the selected features were
removed from both the training and test sets. The fil-
ter methods were purposely not applied to the test set
in order for the samples from the test subjects to re-
main unknown. Additionally, this feature selection
approach is independent of the ML classifiers used
for classification. Hence, it is performed before the
hyperparameters optimization and training steps.
2.4.2 Hyperparameter Optimization and Model
Training
The hyperparameters’ optimization was performed
on the train set using a randomised search with a
Patient 5-fold Cross Validation scheme (Pedregosa
et al., 2011; Bergstra and Bengio, 2012). This cross-
validation scheme divides the train set into five differ-
ent folds, where each fold is comprised of a train and
a validation set. Subjects will only be selected once
to be part of the validation set in the collection of all
folds.
For each iteration of the randomised search, a ran-
dom combination of hyperparameters was selected
and used to train a classifier on each fold’s train set.
Standardisation and nearest neighbour imputation are
performed before training. These data transforma-
tions were first applied to the training set before being
used on the validation set. The transformations ap-
plied to the validation set used the parameters calcu-
lated from the training set for scaling and imputation
to avoid data leakage.
Ten different hyperparameter combinations were
tried for each ML classifier using the randomised
search algorithm. The hyperparameters that produced
the best mean performance over the five folds were
selected. A classifier with those hyperparameters was
then trained on the whole training set (scaled and im-
puted according to the data transformations described
above, without the cross-validation scheme). After
training, this classifier could classify individual win-
dows from the speech signals. To assess its perfor-
mance, the classifier was used to make predictions on
the test set and evaluated based on those predictions.
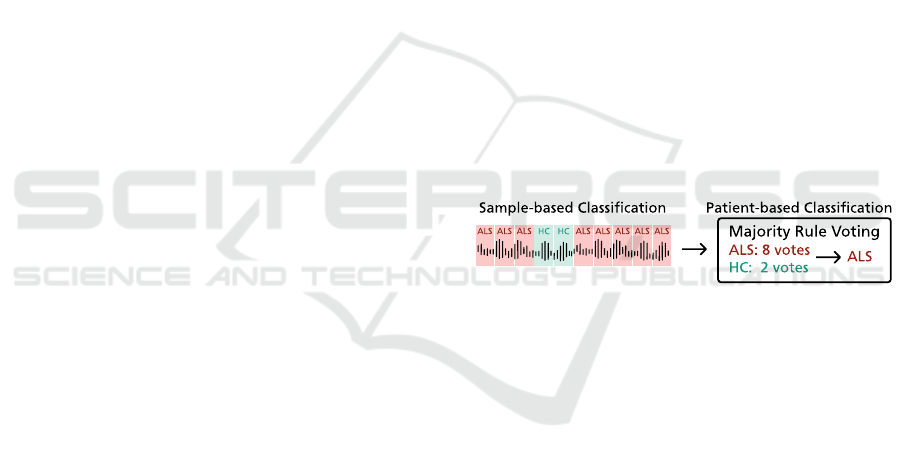
2.4.3 Voting System for Patient Diagnosis
Figure 3: Voting system for patient diagnosis.
As previously mentioned, each subject performs mul-
tiple speech tasks. Thus, each patient is associated
with multiple samples from multiple speech signals.
However, the trained classifier only classifies individ-
ual samples. To reach a final diagnostic classification,
a voting system was implemented. The implemented
voting system is similar to the strategies used in vot-
ing ensembles to combine the predictions of various
models (G
´
eron, 2019). In our case, the voting sys-
tem considered the individual classification outputs
from the various samples that made up the complete
set of speech signals associated with a patient. We
chose to apply a hard voting majority rule to reach
the final decision. The system counted the number
of samples classified as pathological and those clas-
sified as healthy as the number of votes for the ALS
and the HC classes, respectively. The class with the
most votes was considered the classifier’s decision, as
detailed in Figure 3.
As a whole, the proposed framework performed
two kinds of classification: sample-based and patient-
based. The sample-based classification task provides
BIOSIGNALS 2023 - 16th International Conference on Bio-inspired Systems and Signal Processing
78

the necessary information to reach the final diagnostic
decision, which is accomplished by the patient-based
classification.
2.5 Experimental Setup
Besides the two approaches for supervised classifica-
tion - sample and patient levels - a robustness analy-
sis evaluated at the sample level was also performed
to identify possible bias sources, using target values
other than the diagnostic class. These experiments
were designed to evaluate the performance, gener-
alization capacity and robustness of the ML models
used in the proposed framework. Each experiment
was discriminated in terms of dataset combination,
feature subset, gender and phonatory task.
For each ALS patient and HC subject, a total of
142 features were extracted per speech signal: 97 fea-
tures pertaining to TSFEL and the remaining 45 fea-
tures related to speech adapted from literature. Three
feature subsets were considered for analysis: the com-
plete feature set (142 features), the TSFEL subset (97
features), and the speech-related subset (45 speech-
related features from the literature).
Three dataset configurations were used: Home-
SenseALS only, Minsk only, and both datasets. Re-
garding the HomeSenseALS dataset, only recordings
from the first two sessions for the HCs were used
so that the number of samples from the ALS and
HC classes was approximately equal. Moreover, the
datasets did not have the same number of phonatory
tasks due to differences in the acquisition protocols.
Thus, some features from the speech-related subset
could not be used in all scenarios. Specifically, full
signal features were only used for the isolated ”sen-
tences” phonatory task in the first dataset configura-
tion. Formant features should be used for the classi-
fication scenarios that pertain to the ”vowels” task.
However, due to the limitation of the Minsk dataset
not having recorded the vowel /u/, these features were
not used to keep the results between the two datasets
comparable.
Furthermore, another design consideration in our
research was the effect of gender in the classifica-
tion task. Gender differences may be captured in the
speech signal (Albuquerque et al., 2020), which may
negatively affect the ML models as sources of bias
(Garnerin et al., 2019). As such, each experiment was
repeated for three gender configurations: female sub-
jects only, male subjects only, and both genders. In
the context of our research, gender refers to the bio-
logical sex of the subject.
3 RESULTS AND DISCUSSION
The considered results for analysis are given as the
mean and standard deviation across the five seeds for
the F1-score (macro-averaged) and accuracy metrics.
Only the results for the best ML models in each classi-
fication scenario were analysed. Table 2 summarises
the results for the sample-based classification task for
the different experiments, while Table 3 presents the
results for the patient-based classification task. Fi-
nally, Table 4 shows the results for the sample-based
robustness analysis.
3.1 Sample-Based Classification
The proposed framework attained good results with
the HomeSenseALS dataset for the sample-based
classification. Both the TSFEL and the speech-
related feature subsets performed well, although in
distinct phonatory tasks. While the TSFEL sub-
set returned better results when all tasks were con-
sidered, and for the isolated ”vowels” task, the
speech-related subset had better results for the ”sen-
tences” and ”cough” phonatory tasks. Neverthe-
less, results obtained with the complete feature set
were always better. Comparing the results for the
different phonatory tasks, it was observed that the
best overall performance was achieved using data
from the ”vowels” task. Furthermore, it was ob-
served that in the single-gender classification sce-
narios with this dataset, the female gender consis-
tently surpassed the results achieved for the male gen-
der. The framework’s highest F1-score and accuracy
were 0.96±0.03 and 0.96±0.03, respectively, attained
with an SVM using female-only data from the ”vow-
els” phonatory task.
Regarding the Minsk dataset, the framework
showed the best performance when using the com-
plete feature set, as observed for the HomeSenseALS
dataset. However, the results obtained for the male-
only classification scenario far surpassed those for the
female gender, as opposed to what was seen previ-
ously. The best F1-score and accuracy, 0.82±0.11
and 0.84±0.10, respectively, were achieved with an
SVM. These results were lower than the ones reported
in the literature (Vashkevich and Rushkevich, 2021),
which may be due to differences between this study
and the original work. First, some features differ in
both studies, which may influence the ML models’
performance. Secondly, the two works also differ in
the ML pipeline and cross-validation schemes. In this
work, the training and test sets were created using Pa-
tient Shuffle Split, the ML models were optimized
through Randomized Search using a Patient 5-Fold
Speech-Based Supervised Learning Towards the Diagnosis of Amyotrophic Lateral Sclerosis
79

Table 2: Sample-based classification results in the different experiments. The results are given as the mean and standard de-
viation across the five randomized seeds. Only the F1-Score and Accuracy achieved by the best classifiers in each experiment
are presented.
Experiment All Features TSFEL Features Speech-related Features
Phonatory Task Gender Best Model F1-Score Accuracy F1-Score Accuracy F1-Score Accuracy
HomeSenseALS
Sentences
F DT 0.96 ± 0.09 0.96 ±0.08 0.78 ± 0.06 0.80 ± 0.05 0.96 ± 0.09 0.96 ± 0.08
M NB 0.60 ± 0.30 0.72 ± 0.20 0.72 ± 0.08 0.75 ± 0.09 0.61 ± 0.31 0.74 ± 0.21
MF DT 0.82 ± 0.07 0.83 ± 0.07 0.73 ± 0.05 0.74 ± 0.05 0.83 ± 0.07 0.83 ± 0.07
Vowels
F SVM 0.96 ± 0.03 0.96 ± 0.03 0.95 ± 0.03 0.95 ± 0.03 0.88 ± 0.06 0.89 ± 0.05
M NB 0.85 ± 0.06 0.89 ± 0.03 0.87 ± 0.06 0.90 ± 0.03 0.73 ± 0.09 0.81 ± 0.05
MF LR 0.93 ± 0.05 0.94 ± 0.05 0.89 ± 0.07 0.90 ± 0.06 0.94 ± 0.06 0.94 ± 0.05
Cough
F DT 0.82 ± 0.09 0.85 ± 0.06 0.75 ± 0.09 0.81 ± 0.06 0.81 ± 0.10 0.85 ± 0.06
M LR 0.86 ± 0.12 0.89 ± 0.10 0.27 ± 0.14 0.28 ± 0.14 0.86 ± 0.12 0.88 ± 0.10
MF RF 0.92 ± 0.05 0.94 ± 0.04 0.69 ± 0.11 0.72 ± 0.10 0.90 ± 0.02 0.91 ± 0.03
All Tasks
F SVM 0.94 ± 0.02 0.94 ± 0.02 0.91 ± 0.05 0.92 ± 0.04 0.82 ± 0.02 0.82 ± 0.02
M NB 0.82 ± 0.05 0.84 ± 0.05 0.79 ± 0.07 0.82 ± 0.07 0.72 ± 0.12 0.77 ± 0.10
MF LR 0.91 ± 0.02 0.92 ± 0.02 0.86 ± 0.06 0.87 ± 0.05 0.84 ± 0.05 0.84 ± 0.04
Minsk
Vowels
F DT 0.58 ± 0.14 0.61 ± 0.13 0.51 ± 0.11 0.54 ± 0.10 0.53 ± 0.12 0.54 ± 0.12
M SVM 0.82 ± 0.11 0.83 ± 0.10 0.80 ± 0.10 0.81 ± 0.09 0.61 ± 0.10 0.62 ± 0.09
MF RF 0.72 ± 0.06 0.73 ± 0.06 0.71 ± 0.08 0.72 ± 0.07 0.51 ± 0.10 0.52 ± 0.09
HomeSenseALS and Minsk
Vowels
F RF 0.74 ± 0.06 0.75 ± 0.06 0.75 ± 0.06 0.76 ± 0.06 0.66 ± 0.07 0.69 ± 0.05
M SVM 0.84 ± 0.10 0.85 ± 0.10 0.79 ± 0.12 0.80 ± 0.11 0.60 ± 0.10 0.62 ± 0.09
MF SVM 0.82 ± 0.05 0.82 ± 0.05 0.76 ± 0.06 0.77 ± 0.05 0.71 ± 0.06 0.72 ± 0.06
cross-validation scheme, and the selected model was
then trained on the complete training set. The classifi-
cation performance was evaluated on the test set over
the five randomized seeds using the average F1-score.
In contrast, the original work used a stratified 8-Fold
cross-validation scheme for training and testing their
ML models. This process was repeated 40 times,
and the reported classification performance was eval-
uated using the average accuracy achieved on the test
set across all folds. Using different cross-validation
schemes may affect the generalization capacity of the
ML models. K-Fold cross-validation does not guaran-
tee that samples from the same subject are not shared
between the training and test sets, even if the folds are
stratified so that they contain approximately the same
proportions between classes as in the original dataset.
Furthermore, different ML models were tested in both
works.
Experiments with both datasets combined fol-
lowed the same tendency concerning the results at-
tained with each feature subset. In terms of gen-
der, the observed results were similar without no-
ticeable differences between genders. In this con-
figuration, the framework’s highest F1-score and ac-
curacy were 0.84±0.10 and 0.85±0.10, respectively,
obtained with an SVM for the classification scenario
using the data of subjects of both genders from the
”vowels” phonatory task.
Overall, comparing the results from the ”vow-
els” task, the only phonatory task common to all
three configurations, it was observed that the best re-
sults were achieved when using the HomeSenseALS
dataset independently. On the other hand, the results
attained with the Minsk dataset were lower than the
ones reported in the literature. Using both datasets
combined also presented good results. Regardless, all
configurations showed that using every feature from
the TSFEL and the speech-related subsets together
improved the framework’s performance. Moreover,
the best results were consistently achieved with an
SVM.
Discriminating the results by gender, in the Home-
SenseALS dataset, the female gender attained consis-
tently better results than the male gender, although the
inverse was observed in the Minsk dataset. When us-
ing the two datasets together, the results for both gen-
ders were similar, with slight differences. Anatomical
differences in biological sex influence speech directly
(Albuquerque et al., 2020; Garnerin et al., 2019). The
classification algorithm may pick these differences,
affecting its predictions and explaining the different
classification results. However, gender imbalance in
BIOSIGNALS 2023 - 16th International Conference on Bio-inspired Systems and Signal Processing
80

Table 3: Patient-based classification results in the different experiments. The results are given as the mean and standard devi-
ation across the five randomized seeds. Only the F1-Score and Accuracy achieved by the best classifiers in each experiment
are presented.
Experiment All Features TSFEL Features Speech-related Features
Phonatory Task Gender Best Model F1-Score Accuracy F1-Score Accuracy F1-Score Accuracy
HomeSenseALS
Sentences
F DT 0.95 ± 0.11 0.95 ± 0.10 0.89 ± 0.13 0.90 ± 0.12 0.95 ± 0.11 0.95 ± 0.10
M NB 0.60 ± 0.33 0.70 ± 0.24 0.73 ± 0.33 0.80 ± 0.24 0.60 ± 0.33 0.70 ± 0.24
MF DT 0.74 ± 0.16 0.75 ± 0.16 0.84 ± 0.13 0.85 ± 0.12 0.79 ± 0.19 0.80 ± 0.19
Vowels
F SVM 1.00 ± 0.00 1.00 ± 0.00 1.00 ± 0.00 1.00 ± 0.00 0.89 ± 0.13 0.90 ± 0.12
M NB 0.73 ± 0.33 0.80 ± 0.24 0.87 ± 0.27 0.90 ± 0.20 0.73 ± 0.33 0.80 ± 0.24
MF LR 0.95 ± 0.11 0.95 ± 0.10 0.95 ± 0.11 0.95 ± 0.10 1.00 ± 0.00 1.00 ± 0.00
Cough
F DT 0.87 ± 0.27 0.90 ± 0.20 0.89 ± 0.13 0.90 ± 0.12 0.87 ± 0.27 0.90 ± 0.20
M LR 1.00 ± 0.00 1.00 ± 0.00 0.27 ± 0.13 0.40 ± 0.20 1.00 ± 0.00 1.00 ± 0.00
MF RF 1.00 ± 0.00 1.00 ± 0.00 0.81 ± 0.26 0.85 ± 0.20 1.00 ± 0.00 1.00 ± 0.00
All Tasks
F SVM 1.00 ± 0.00 1.00 ± 0.00 1.00 ± 0.00 1.00 ± 0.00 1.00 ± 0.00 1.00 ± 0.00
M NB 1.00 ± 0.00 1.00 ± 0.00 0.87 ± 0.27 0.90 ± 0.20 0.73 ± 0.33 0.80 ± 0.24
MF LR 1.00 ± 0.00 1.00 ± 0.00 0.89 ± 0.13 0.90 ± 0.12 0.95 ± 0.11 0.95 ± 0.10
Minsk
Vowels
F DT 0.66 ± 0.21 0.70 ± 0.16 0.47 ± 0.16 0.53 ± 0.12 0.53 ± 0.20 0.53 ± 0.19
M SVM 0.86 ± 0.13 0.87 ± 0.12 0.90 ± 0.08 0.90 ± 0.08 0.63 ± 0.24 0.67 ± 0.21
MF RF 0.70 ± 0.11 0.70 ± 0.11 0.73 ± 0.08 0.74 ± 0.08 0.51 ± 0.16 0.54 ± 0.14
HomeSenseALS and Minsk
Vowels
F RF 0.72 ± 0.09 0.73 ± 0.09 0.66 ± 0.14 0.68 ± 0.13 0.63 ± 0.13 0.65 ± 0.12
M SVM 0.90 ± 0.12 0.90 ± 0.12 0.86 ± 0.18 0.88 ± 0.16 0.52 ± 0.20 0.53 ± 0.20
MF SVM 0.82 ± 0.10 0.83 ± 0.10 0.81 ± 0.13 0.81 ± 0.12 0.75 ± 0.08 0.76 ± 0.07
the datasets may also influence the ML model’s per-
formance, as these algorithms will be trained with dif-
ferent examples from each gender. In both the Home-
SenseALS and Minsk datasets, some gender imbal-
ance exists between ALS patients and HCs. This gen-
der imbalance is also present between subjects from
the same class, i.e., within ALS subjects or HCs.
3.2 Patient-Based Classification
The framework attained good results in the patient-
based classification, with an improvement in the F1-
score and accuracy values observed for most configu-
rations. The framework attained the best results with
the HomeSenseALS dataset. Again, the complete fea-
ture set showed better results than the individual fea-
ture subsets. Results discriminated by gender also
presented a similar pattern to the sample-based clas-
sification, with the female gender attaining better re-
sults than the male gender. The only exception was
the ”cough” phonatory task, where the results were
better for the male gender. Furthermore, data from all
phonatory tasks and the complete feature set showed
improved performance, with the framework always
predicting the test subjects correctly.
Results for the Minsk dataset also improved, with
the framework continuing to display better perfor-
mance for the male gender than the female gender.
Nevertheless, the results were still lower than the ones
reported in the literature (Vashkevich and Rushke-
vich, 2021).
An improvement was also noticed when using
both datasets together. Overall, this classification
approach resulted in better performance than the
sample-based classification, with more ML models
reaching F1-score and accuracy values over 0.90. The
increase in performance may be explained by the vot-
ing rule used in the patient-based classification. A
hard voting majority rule was chosen for this classifi-
cation approach, which makes a prediction based on
the total number of samples classified as pathological
or healthy, choosing the classification with the most
votes. This behaviour may hide individual errors at
the sample-level classification, improving the frame-
work’s performance. These results followed the same
tendencies as in the sample-based classification, with
the complete feature set still achieving better results
than the individual subsets.
Speech-Based Supervised Learning Towards the Diagnosis of Amyotrophic Lateral Sclerosis
81

Table 4: Robustness analysis results for the best models in the sample-based classification. The results are given as the mean
and standard deviation across the five randomized seeds. Only the F1-Score and Accuracy are presented.
Experiment All Features TSFEL Features Speech-related Features
Phonatory Task Target Model F1-Score Accuracy F1-Score Accuracy F1-Score Accuracy
HomeSenseALS
Sentences
Data Source DT 0.82 ± 0.07 0.83 ± 0.07 0.73 ± 0.06 0.74 ± 0.05 0.83 ± 0.07 0.83 ± 0.07
Gender DT 0.91 ± 0.07 0.92 ± 0.06 0.82 ± 0.07 0.83 ± 0.06 0.91 ± 0.08 0.91 ± 0.07
Class DT 0.82 ± 0.07 0.83 ± 0.07 0.73 ± 0.05 0.74 ± 0.05 0.83 ± 0.07 0.83 ± 0.07
Vowels
Data Source LR 0.93 ± 0.05 0.94 ± 0.05 0.89 ± 0.07 0.90 ± 0.06 0.94 ± 0.06 0.94 ± 0.05
Gender LR 0.92 ± 0.08 0.93 ± 0.08 0.85 ± 0.08 0.85 ± 0.08 0.92 ± 0.09 0.92 ± 0.09
Class LR 0.93 ± 0.05 0.94 ± 0.05 0.89 ± 0.07 0.90 ± 0.06 0.94 ± 0.06 0.94 ± 0.05
Cough
Data Source RF 0.92 ± 0.05 0.94 ± 0.04 0.69 ± 0.11 0.72 ± 0.10 0.90 ± 0.02 0.91 ± 0.03
Gender RF 0.53 ± 0.09 0.56 ± 0.10 0.53 ± 0.09 0.56 ± 0.11 0.43 ± 0.05 0.49 ± 0.07
Class RF 0.92 ± 0.05 0.94 ± 0.04 0.69 ± 0.11 0.72 ± 0.10 0.90 ± 0.02 0.91 ± 0.03
All Tasks
Data Source LR 0.91 ± 0.02 0.92 ± 0.02 0.86 ± 0.06 0.87 ± 0.05 0.84 ± 0.05 0.84 ± 0.04
Gender LR 0.90 ± 0.06 0.91 ± 0.06 0.79 ± 0.04 0.79 ± 0.04 0.91 ± 0.05 0.92 ± 0.05
Class LR 0.91 ± 0.02 0.92 ± 0.02 0.86 ± 0.06 0.87 ± 0.05 0.84 ± 0.05 0.84 ± 0.04
Minsk
Vowels
— — — — — — — —
Gender RF 0.84 ± 0.09 0.85 ± 0.08 0.78 ± 0.08 0.79 ± 0.07 0.85 ± 0.07 0.87 ± 0.06
Class RF 0.72 ± 0.06 0.73 ± 0.06 0.71 ± 0.08 0.72 ± 0.07 0.51 ± 0.10 0.52 ± 0.09
HomeSenseALS and Minsk
Vowels
Data Source SVM 0.72 ± 0.05 0.74 ± 0.05 0.64 ± 0.05 0.67 ± 0.05 0.57 ± 0.05 0.58 ± 0.06
Gender SVM 0.91 ± 0.02 0.91 ± 0.02 0.83 ± 0.03 0.83 ± 0.03 0.91 ± 0.02 0.91 ± 0.02
Class SVM 0.82 ± 0.05 0.82 ± 0.05 0.76 ± 0.06 0.77 ± 0.05 0.71 ± 0.06 0.72 ± 0.06
3.3 Robustness Analysis
The sample-based and patient-based classification re-
sults have attained very good performance in multi-
ple scenarios, sometimes reaching F1-scores and ac-
curacy values of 100 %. A robustness analysis was
performed to identify possible sources of bias to eval-
uate this performance.
The patient-based approach is dependent on the
performance of the sample-based classification. Thus,
the ML models’ robustness was evaluated at the sam-
ple level. To do so, the best classifiers from the
previous classification experiment were trained and
tested in the same classification scenarios previously
defined, without gender separation, using another tar-
get instead of the diagnostic class of each sample.
The same ML pipeline from the sample-based clas-
sification was used. However, two other targets were
considered for this experiment: 1) the ”gender” as-
sociated with the speech sample and 2) the ”data
source” of the sample. The data source was a label
that identified speech samples from signals acquired
in the same conditions. Namely, speech data from
the HomeSenseALS and Minsk datasets were col-
lected in different environments, with distinct record-
ing equipment and sampling rates, which may act as
sources of bias. Furthermore, data from ALS patients
and healthy volunteers in the HomeSenseALS dataset
were also recorded in distinct conditions. On the other
hand, the gender target was used to assess how well
the algorithm recognized the genders based on the dif-
ferent feature subsets.
Regarding the data source target, the framework
achieved the same result as those reported in the
sample-based classification in the HomeSenseALS
dataset. The reason behind these results is the dis-
tinct acquisition conditions for ALS patients and HCs.
Using the two datasets together, the performance for
the data source target decreased in all feature subsets
compared to the class target. However, this decrease
in the scores was most evident in the speech-related
feature subset, indicating that the SVM model used
in this scenario was less affected by this source of
bias. On the other hand, training the classifiers with
speech-related features extracted from speech signals
collected from the ”vowels” task may be less prone to
this kind of bias, surprising, given the different lan-
guage of both dataset’s participants.
Considering gender as the target, the framework’s
performance was similar to the observed when pre-
dicting the data source, in some situations even
achieving higher results. This is evident when us-
ing both datasets together, where the gender predic-
tion results outperformed both the diagnostic results
BIOSIGNALS 2023 - 16th International Conference on Bio-inspired Systems and Signal Processing
82

and the predictions regarding the data source. In
the Minsk dataset, the results from this classification
also outperformed the results for the diagnostic class.
This did not always happen for the HomeSenseALS
dataset. Overall, lower scores could be observed for
the TSFEL features. Furthermore, the results for the
”cough” phonatory task should be noticed, in which
the framework had a consistently bad performance.
This suggests that data from the ”cough” phonatory
task may provide less gender-related information to
the classifiers.
Overall, the results from this study have shown
that the collection conditions between datasets may
influence the ML models’ performance as sources
of bias. Interestingly, when using both datasets and
the speech-related features, the performance was not
high. Furthermore, gender can be easily predicted
by the classifiers in most experiments, except for the
classification setting using only data collected from
the ”cough” phonatory task, surprising, given the dif-
ferent language of participants.
4 CONCLUSIONS
ALS diagnosis is still challenging, often leading to
diagnostic delays. Consequently, many patients are
excluded from participating in new clinical trials with
potential life-prolonging treatments. The sooner ade-
quate healthcare is delivered, the higher the chances
of increasing survival. Currently, no definitive objec-
tive biomarkers for ALS have been established as in-
dicators for early diagnosis and patient outcome mea-
sures. Speech has recently emerged as a promising
biomarker for neurodegenerative diseases capable of
being integrated into telemonitoring solutions.
In this work, the speech signal was explored and
analysed in various classification scenarios to assess
the adequacy of automatic speech analysis towards
ALS diagnosis. An automatic speech analysis frame-
work was proposed to support the diagnosis of ALS
using speech data. The overall outcomes from classi-
fication experiments reinforce that speech-dedicated
features improve the models’ performance when com-
bined with general-purpose features. It was observed
that the classifiers performed well for all tasks, al-
though the highest results were achieved with the
”vowels” phonatory task. The best scores for each
phonatory task for the sample and patient-based clas-
sifications were 96 % and 100 % for vowels, 96 %
and 95 % for sentences, and 82 % and 87 % for
cough tasks, respectively. Furthermore, a robustness
analysis was performed to evaluate the generalisa-
tion capacity of the ML classifiers and identify po-
tential sources of bias that may undermine their per-
formance.
Speech provides rich insights into neurological
and motor functions and can be easily collected, en-
abling the extraction of larger amounts of data con-
taining relevant acoustic, articulatory and linguis-
tic information. Our findings support the utility of
speech as a promising digital biomarker and the ad-
equacy of using the cough, vowel and sentences
phonatory tasks for data collection in remote settings,
paving the way for remote examination at patients’
residences and increasing the available data for clin-
icians towards improving diagnosis and prognosis of
ALS.
Nevertheless, additional ALS and healthy volun-
teers should be recruited to further validate the re-
sults from this work with a larger population, includ-
ing more age- and gender-balanced healthy subjects
to evaluate the effect of age on the proposed frame-
work’s performance. Longitudinal data acquisitions
should be conducted to study how ALS progresses
and how ML models can be used for a more accurate
prognosis of this disease.
Future work should also consider feature impor-
tance studies and Explainable Artificial Intelligence
(XAI) methods to quantify and explain how each fea-
ture contributes to the classifiers’ performance. Rep-
resentation learning algorithms are an alternative to
traditional ML models, which can learn directly from
raw data to discover new feature representations and
may be interesting to explore.
ACKNOWLEDGEMENTS
This work was supported by the project ”Home-
SenseALS: Home-based Monitoring of Func-
tional Disability in Amyotrophic Lateral Sclerosis
with Mobile Sensing” and financed through the
”FCT–Foundation for Science and Technology, I.P.”,
with reference PTDC/MEC-NEU/6855/2020.
REFERENCES
Albuquerque, L., Oliveira, C., Teixeira, A., Sa-Couto, P.,
and Figueiredo, D. (2020). A comprehensive analysis
of age and gender effects in european portuguese oral
vowels. Journal of Voice.
An, K., Kim, M., Teplansky, K., Green, J., Campbell, T.,
Yunusova, Y., Heitzman, D., and Wang, J. (2018). Au-
tomatic Early Detection of Amyotrophic Lateral Scle-
rosis from Intelligible Speech Using Convolutional
Neural Networks. In Proc. Interspeech 2018, pages
1913–1917.
Speech-Based Supervised Learning Towards the Diagnosis of Amyotrophic Lateral Sclerosis
83

Barandas, M., Folgado, D., Fernandes, L., Santos, S.,
Abreu, M., Bota, P., Liu, H., Schultz, T., and Gam-
boa, H. (2020). Tsfel: Time series feature extraction
library. SoftwareX, 11:100456.
Bergstra, J. and Bengio, Y. (2012). Random search for
hyper-parameter optimization. Journal of Machine
Learning Research, 13(10):281–305.
Boersma, P. (2001). Praat, a system for doing phonetics by
computer. Glot International, 5:341–345.
Boghdady, N. E., Langner, F., Gaudrain, E., Bas¸kent, D.,
and Nogueira, W. (2021). Effect of spectral contrast
enhancement on speech-on-speech intelligibility and
voice cue sensitivity in cochlear implant users. Ear &
Hearing, 42:271–289.
Brown, C., Chauhan, J., Grammenos, A., Han, J., Hasthana-
sombat, A., Spathis, D., Xia, T., Cicuta, P., and Mas-
colo, C. (2020). Exploring automatic diagnosis of
covid-19 from crowdsourced respiratory sound data.
pages 3474–3484. ACM.
de Almeida, S. C., Mendes, A. P., and Kempster, G. B.
(2019). The consensus auditory-perceptual evaluation
of voice (cape-v) psychometric characteristics: Ii eu-
ropean portuguese version (ii ep cape-v). Journal of
Voice, 33:582.e5–582.e13.
Delgado-Hern
´
andez, J., Le
´
on-G
´
omez, N. M., Izquierdo-
Arteaga, L. M., and Llanos-Fumero, Y. (2018).
An
´
alisis cepstral de la voz normal y patol
´
ogica en
adultos espa
˜
noles. medida de la prominencia del pico
cepstral suavizado en vocales sostenidas versus habla
conectada. Acta Otorrinolaringol
´
ogica Espa
˜
nola,
69:134–140.
Fernandes, F., Barbalho, I., Barros, D., Valentim, R., Teix-
eira, C., Henriques, J., Gil, P., and J
´
unior, M. D.
(2021). Biomedical signals and machine learning in
amyotrophic lateral sclerosis: a systematic review.
BioMedical Engineering OnLine, 20:61.
Garnerin, M., Rossato, S., and Besacier, L. (2019). Gen-
der representation in french broadcast corpora and its
impact on asr performance. pages 3–9. ACM Press.
G
´
omez-Vilda, P., Londral, A. R. M., Ferr
´
andez-Vicente,
J. M., and Rodellar-Biarge, V. (2013). Characteri-
zation of speech from amyotrophic lateral sclerosis
by neuromorphic processing. In Ferr
´
andez Vicente,
J. M.,
´
Alvarez S
´
anchez, J. R., de la Paz L
´
opez, F.,
and Toledo Moreo, F. J., editors, Natural and Artificial
Models in Computation and Biology, pages 212–224,
Berlin, Heidelberg. Springer Berlin Heidelberg.
G
´
eron, A. (2019). Hands-On Machine Learning with Scikit-
Learn, Keras, and TensorFlow, 2nd Edition. O’Reilly
Media, Inc.
G
´
omez-Vilda, P., Londral, A. R. M., Rodellar-Biarge, V.,
Ferr
´
andez-Vicente, J. M., and de Carvalho, M. (2015).
Monitoring amyotrophic lateral sclerosis by biome-
chanical modeling of speech production. Neurocom-
puting, 151:130–138.
Jadoul, Y., Thompson, B., and de Boer, B. (2018). Introduc-
ing parselmouth: A python interface to praat. Journal
of Phonetics, 71:1–15.
Janbakhshi, P. and Kodrasi, I. (2021). Supervised speech
representation learning for parkinson’s disease classi-
fication. In Speech Communication; 14th ITG Confer-
ence, pages 1–5.
Ko, J. H., Fromm, J., Philipose, M., Tashev, I., and Zarar, S.
(2018). Limiting numerical precision of neural net-
works to achieve real-time voice activity detection.
In 2018 IEEE International Conference on Acoustics,
Speech and Signal Processing (ICASSP), pages 2236–
2240.
Masrori, P. and Van Damme, P. (2020). Amyotrophic lat-
eral sclerosis: a clinical review. European Journal of
Neurology, 27(10):1918–1929.
MathWorks (2022). Formant Estimation with LPC Coeffi-
cients (R2022b). Retrieved October 30, 2022, from
https://www.mathworks.com/help/signal/ug/formant-
estimation-with-lpc-coefficients.html.
Mekyska, J., Janousova, E., Gomez-Vilda, P., Smekal, Z.,
Rektorova, I., Eliasova, I., Kostalova, M., Mrackova,
M., Alonso-Hernandez, J. B., Faundez-Zanuy, M., and
de Ipi
˜
na, K. L. (2015). Robust and complex approach
of pathological speech signal analysis. Neurocomput-
ing, 167:94–111.
Orozco-Arroyave, J. R., V
´
asquez-Correa, J. C., Vargas-
Bonilla, J. F., Arora, R., Dehak, N., Nidadavolu, P. S.,
Christensen, H., Rudzicz, F., Yancheva, M., Chinaei,
H., Vann, A., Vogler, N., Bocklet, T., Cernak, M.,
Hannink, J., and N
¨
oth, E. (2018). NeuroSpeech: An
open-source software for Parkinson’s speech analysis.
Digital Signal Processing: A Review Journal, 77:207–
221.
Paganoni, S., Macklin, E. A., Lee, A., Murphy, A., Chang,
J., Zipf, A., Cudkowicz, M., and Atassi, N. (2014).
Diagnostic timelines and delays in diagnosing amy-
otrophic lateral sclerosis (als). Amyotrophic Lateral
Sclerosis and Frontotemporal Degeneration, 15:453–
456.
Pedregosa, F., Varoquaux, G., Gramfort, A., Michel, V.,
Thirion, B., Grisel, O., Blondel, M., Prettenhofer,
P., Weiss, R., Dubourg, V., Vanderplas, J., Passos,
A., Cournapeau, D., Brucher, M., Perrot, M., and
Duchesnay, E. (2011). Scikit-learn: Machine learning
in Python. Journal of Machine Learning Research,
12:2825–2830.
Ramanarayanan, V., Lammert, A. C., Rowe, H. P., Quatieri,
T. F., and Green, J. R. (2022). Speech as a biomarker:
Opportunities, interpretability, and challenges. Per-
spectives of the ASHA Special Interest Groups, 7:276–
283.
Stegmann, G. M., Hahn, S., Liss, J., Shefner, J., Rutkove,
S., Shelton, K., Duncan, C. J., and Berisha, V. (2020).
Early detection and tracking of bulbar changes in als
via frequent and remote speech analysis. npj Digital
Medicine, 3:132.
Sztah
´
o., D., G
´
abor., K., and G
´
abriel., T. (2021). Deep learn-
ing solution for pathological voice detection using
lstm-based autoencoder hybrid with multi-task learn-
ing. In Proceedings of the 14th International Joint
Conference on Biomedical Engineering Systems and
Technologies - BIOSIGNALS,, pages 135–141. IN-
STICC, SciTePress.
Talbott, E. O., Malek, A. M., and Lacomis, D. (2016). The
BIOSIGNALS 2023 - 16th International Conference on Bio-inspired Systems and Signal Processing
84

epidemiology of amyotrophic lateral sclerosis, volume
138. Elsevier B.V., 1 edition.
Vashkevich, M. and Rushkevich, Y. (2021). Classification
of als patients based on acoustic analysis of sustained
vowel phonations. Biomedical Signal Processing and
Control, 65:102350.
Vasquez-Correa, J., Arias-Vergara, T., Schuster, M.,
Orozco-Arroyave, J., and N
¨
oth, E. (2020). Parallel
representation learning for the classification of patho-
logical speech: Studies on parkinson’s disease and
cleft lip and palate. Speech Communication, 122:56–
67.
Vieira, F. G., Venugopalan, S., Premasiri, A. S., McNally,
M., Jansen, A., McCloskey, K., Brenner, M. P., and
Perrin, S. (2022). A machine-learning based objective
measure for als disease severity. npj Digital Medicine,
5:45.
WebRTC (2018). Webrtc. Retrieved October 30, 2022, from
https://webrtc.org/.
Youn, B.-Y., Ko, Y., Moon, S., Lee, J., Ko, S.-G., and Kim,
J.-Y. (2021). Digital biomarkers for neuromuscular
disorders: A systematic scoping review. Diagnostics,
11.
APPENDIX
See Tables 5 - 6 for the complete list of features.
Table 5: List of window-based features. Features in bold
were added from literature.
Domain Features
TSFEL features
Autocorrelation
Centroid
Area under the curve
Absolute energy
Negative turning points
Temporal Positive turning points
Neighbourhood peaks
Peak to peak distance
Slope
Total energy
Zero crossing rate
Interquartile range
Kurtosis
Maximum
Statistical Minimum
Standard deviation (SD)
Variance
Root Mean Square (RMS)
Skewness
Spectral centroid
Spectral decrease
Spectral distance
Spectral entropy
Spectral kurtosis
Spectral positive turning points
Spectral roll-off
Spectral roll-on
Spectral skewness
Spectral slope
Spectral spread
Spectral variation
Maximum power spectrum
Maximum frequency
Median frequency
Power bandwidth
Linear prediction cepstral coeffi-
cients (LPCC) (x 13)
Mel-frequency cepstral coefficients
(MFCC) (x 12)
Wavelet entropy
Spectral Wavelet energy (x 9)
Wavelet absolute mean (x 9)
Wavelet SD (x 9)
Wavelet variance (x 9)
Cepstral Peak Prominence (CPP)
RMS energy (SD, skewness, kurto-
sis, maximum, mean, median, min-
imum, first quartile, third quartile
and interquartile range)
Mean square energy
Mean spectral contrast (x7)
Period
Polynomial fit (x2)
Praat features
Harmonic-to-Noise Ratio (HNR)
Fundamental Frequency (F
0
) (mean
and median)
Jitter variants (Local, Abs, RAP,
PPQ5, DDP)
Shimmer variants (Local, dB,
APQ3, APQ5, APQ11, DDA)
Table 6: List of full signal features.
Domain Features
Silence duration
Temporal Non-silence duration
Silence ratio
Vowel Space Area (VSA)
Logarithmic VSA (LnVSA)
Spectral Formant Centralization Ratio
(FCR)
Vowel Distribution Asymmetry Co-
efficient (VDAC) (x2)
F
2,i
/F
2,u
Ratio
Speech-Based Supervised Learning Towards the Diagnosis of Amyotrophic Lateral Sclerosis
85
