
Contactless Optical Detection of Nocturnal Respiratory Events
Belmin Ali
´
c
1 a
, Tim Zauber
1
, Chen Zhang
3
, Wang Liao
3
, Alina Wildenauer
4
, Noah Leosz
4
,
Torsten Eggert
4
, Sarah Dietz-Terjung
4
, Sivagurunathan Sutharsan
5
, Gerhard Weinreich
5
,
Christoph Sch
¨
obel
4
, Gunther Notni
3
, Christian Wiede
2
and Karsten Seidl
1,2
1
Faculty of Engineering, University of Duisburg-Essen, Duisburg, Germany
2
Fraunhofer Institute for Microelectronic Circuits and Systems, Duisburg, Germany
3
Department of Mechanical Engineering, Ilmenau University of Technology, Ilmenau, Germany
4
Center for Sleep Medicine, University Hospital Essen, Essen, Germany
5
Department of Pneumology, University Hospital Essen, Essen, Germany
Keywords:
Contactless, Optical, Apnea, Hypopnea, Respiration, Sleep, OSA, AHI, Multi-Spectral, Data Fusion.
Abstract:
Obstructive sleep apnea (OSA) is a common sleep-related breathing disorder characterized by the collapse of
the upper airway and associated with various diseases. For clinical diagnosis, a patient’s sleep is recorded dur-
ing the night via polysomnography (PSG) and evaluated the next day regarding nocturnal respiratory events.
The most prevalent events include obstructive apneas and hypopneas. In this paper, we introduce a fully auto-
matic contactless optical method for the detection of nocturnal respiratory events. The goal of this study is to
demonstrate how nocturnal respiratory events, such as apneas and hypopneas, can be autonomously detected
through the analysis of multi-spectral image data. This represents the first step towards a fully automatic and
contactless diagnosis of OSA. We conducted a trial patient study in a sleep laboratory and evaluated our re-
sults in comparison with PSG, the gold standard in sleep diagnostics. In a study sample with three patients,
24 hours of recorded video materials and 245 respiratory events, we have achieved a classification accuracy of
82 % with a random forest classifier.
1 INTRODUCTION
Obstructive sleep apnea (OSA) is a common sleep-
related breathing disorder characterized by the col-
lapse of the upper airway, affecting approximately 30-
50 % of the male and 15-25 % of the female popula-
tion on moderate level (Rundo, 2019), (Heinzer et al.,
2015), (Weinreich et al., 2013). OSA can be further
distinguished into apnea and hypopnea, whereas ob-
structive apnea is defined as a reduction in airflow of
more than 90 % relative to airflow baseline rate for
at least ten seconds, while maintaining respiratory ef-
fort. A hypopnea occurs if airflow falls by at least
30 % relative to baseline frequency for at least ten sec-
onds, with a desaturation of at least 3 % (Berry et al.,
2020). For clinical diagnosis of OSA, a patient’s sleep
is usually recorded via polysomnography (PSG) or
polygraphy (PG) in sleep laboratory settings.
The main parameter for deciding whether OSA is
present is the apnea-hypopnea index (AHI), which in-
a
https://orcid.org/0000-0002-2630-3945
dicates how many apneas and hypopneas a patient has
on average per hour of sleep. OSA exists either if the
AHI exceeds 15 or if daytime sleepiness is reported
in combination with an AHI ≥ 5 (Berry et al., 2020),
(Kapur et al., 2017). OSA manifests itself through
various symptoms and complaints, both at night and
during the day. Common symptoms include night-
time choking and snoring, daytime sleepiness, and
concentration problems (Rundo, 2019), (Kapur et al.,
2017). Several risk factors are associated with OSA,
such as age, male gender, high BMI, or substance
abuse. Likewise, OSA is linked to cardiovascular dis-
ease such as hypertonia, coronary atherosclerosis or
heart failure and other conditions like depression and
diabetes (Rundo, 2019), (Heinzer et al., 2015), (Wein-
reich et al., 2013). An association between OSA and
an increased risk of motor vehicle accidents due to
excessive daytime sleepiness points out to the need
for an accurate diagnosis and subsequent treatment
(Karimi et al., 2015).
PSG is still considered the gold standard in di-
agnosis of sleep-related breathing problems in sleep
336
Ali
´
c, B., Zauber, T., Zhang, C., Liao, W., Wildenauer, A., Leosz, N., Eggert, T., Dietz-Terjung, S., Sutharsan, S., Weinreich, G., Schöbel, C., Notni, G., Wiede, C. and Seidl, K.
Contactless Optical Detection of Nocturnal Respiratory Events.
DOI: 10.5220/0011694400003417
In Proceedings of the 18th International Joint Conference on Computer Vision, Imaging and Computer Graphics Theory and Applications (VISIGRAPP 2023) - Volume 4: VISAPP, pages
336-344
ISBN: 978-989-758-634-7; ISSN: 2184-4321
Copyright
c
2023 by SCITEPRESS – Science and Technology Publications, Lda. Under CC license (CC BY-NC-ND 4.0)

medicine, but this procedure usually leads to discom-
fort in patients and ultimately to an unnatural sleep
behavior and potentially biased results. In case of
strong nocturnal movements or heavy sweating, elec-
trodes and sensors are at risk of detaching from the
patient or of causing artifacts during recording. More-
over, the application of PSG is time consuming and
requires close body contact. The introduction of a
contactless alternative to PSG has the potential to re-
duce the discomfort in patients, the measurement ar-
tifacts due to detached electrodes and the bias in the
measurement results due to the lack of sensors on the
body. Furthermore, a contactless alternative would re-
quire less direct contact between the patient and the
medical staff, and hence, reduce the risk of a viral
transmission, as well as, the workload of the medical
staff.
In this work, we introduce a contactless optical
system for detecting nocturnal respiratory events. The
goal of this study is to demonstrate the ability to
identify obstructive apneas and hypopneas in the pa-
tient’s breathing pattern in order to enable a fully au-
tonomous and completely contactless OSA diagnosis
system.
2 STATE OF THE ART
Previous works dealing with the detection of noctur-
nal respiratory events can be categorized into the fol-
lowing groups: (1) neonatal apnea detection, such as
in (Cattani et al., 2014) and (Lorato et al., 2021); (2)
apnea detection via respiratory motion analysis, such
as in (Gederi and Clifford, 2012), (Abad et al., 2016),
(Akbarian et al., 2020) and (Geertsema et al., 2020);
(3) apnea detection via depth camera, such as in (Yang
et al., 2017) and (Veauthier et al., 2019); (4) apnea
detection via combined respiratory motion and ther-
mography analysis, such as in (Scebba et al., 2021);
and (5) respiration rate measurement, such as in: (Hu
et al., 2018), (Vogels et al., 2018) and (Gastel et al.,
2021).
The following points can be stated about the re-
search gap according to the results from the literature
overview: (1) the OSA diagnosis accuracy of the con-
tactless optical detection algorithms presented in pub-
lished literature needs to be increased further for clin-
ical practice. Taking into account the potentials and
advantages of contactless measurements during sleep,
as discussed in the introduction, the need for further
work in this area is even more evident; (2) very lim-
ited to no attention is given to the classification be-
tween hypopnea and apnea; and (3) a strong focus
is given to respiratory motion analysis, whereas the
analysis of other biosignals, such as rPPG or nose and
mouth breathing thermography appears insufficiently
researched.
3 IMPLEMENTATION
3.1 Measurement System
For the acquisition of the video data, a multi-modal
measurement systems is used. The sensor head of the
measurement system is shown in Fig. 1 (Zhang et al.,
2020). It is composed of a real-time NIR 3D sensor
consisting of a NIR GOBO projector at 850 nm (Heist
et al., 2018) and two NIR high-speed cameras at the
same wavelength. This 3D sensor can reconstruct and
transmit 3D images with very low latency at a framer-
ate of 15 Hz using the stereo matching acceleration al-
gorithm BICOS (Dietrich et al., 2019) and the graph-
ics processing unit NVIDIA RTX 2080. The real-time
3D data enable the analysis of patients’ head motion.
Next to the 3D sensor, two NIR cameras at 780 nm
and 940 nm as well as a thermal camera are mounted
into the sensor head and synchronized with the 3D
sensor for the estimation of vital signs from temporal
variations of skin reflectance and temperature. For the
NIR video acquisition, an LED array consisting of a
780 nm LED and three 940 nm LED is used to pro-
vide an irritation-free active illumination that does not
disturb sleeping patients in the night. Furthermore, a
color camera is reserved but not used in this night ap-
plication. The measurement setup in the sleep labora-
tory in the University Hospital Essen is shown in Fig.
2. The sensor head is placed perpendicularly to the
pillow at a 150 cm distance from the mattress.
3.2 Data Processing Chain
An overview of all steps in the data processing chain
is shown in Fig. 3. The data processing chain starts
with the three image streams from the two band-pass
filtered (central wavelengths 780 nm and 940 nm,
FWHM = 10 nm) monochromatic cameras and the
FIR camera. Fig. 4 illustrates the extraction of dif-
ferent vital signals from multimodal 3D video data.
In the video data preprocessing, all 2D and 3D multi-
modal images are firstly registered with each other via
image transformations. Then, the approach proposed
in (Zhang et al., 2020) is implemented with some
adaptations. In the first video frame the face region
and a large set of facial landmarks are detected in the
2D image at 780 nm using the library MediaPipe (Lu-
garesi et al., 2019). Based on the detected facial land-
marks, the eye and mouth regions are painted in black
Contactless Optical Detection of Nocturnal Respiratory Events
337
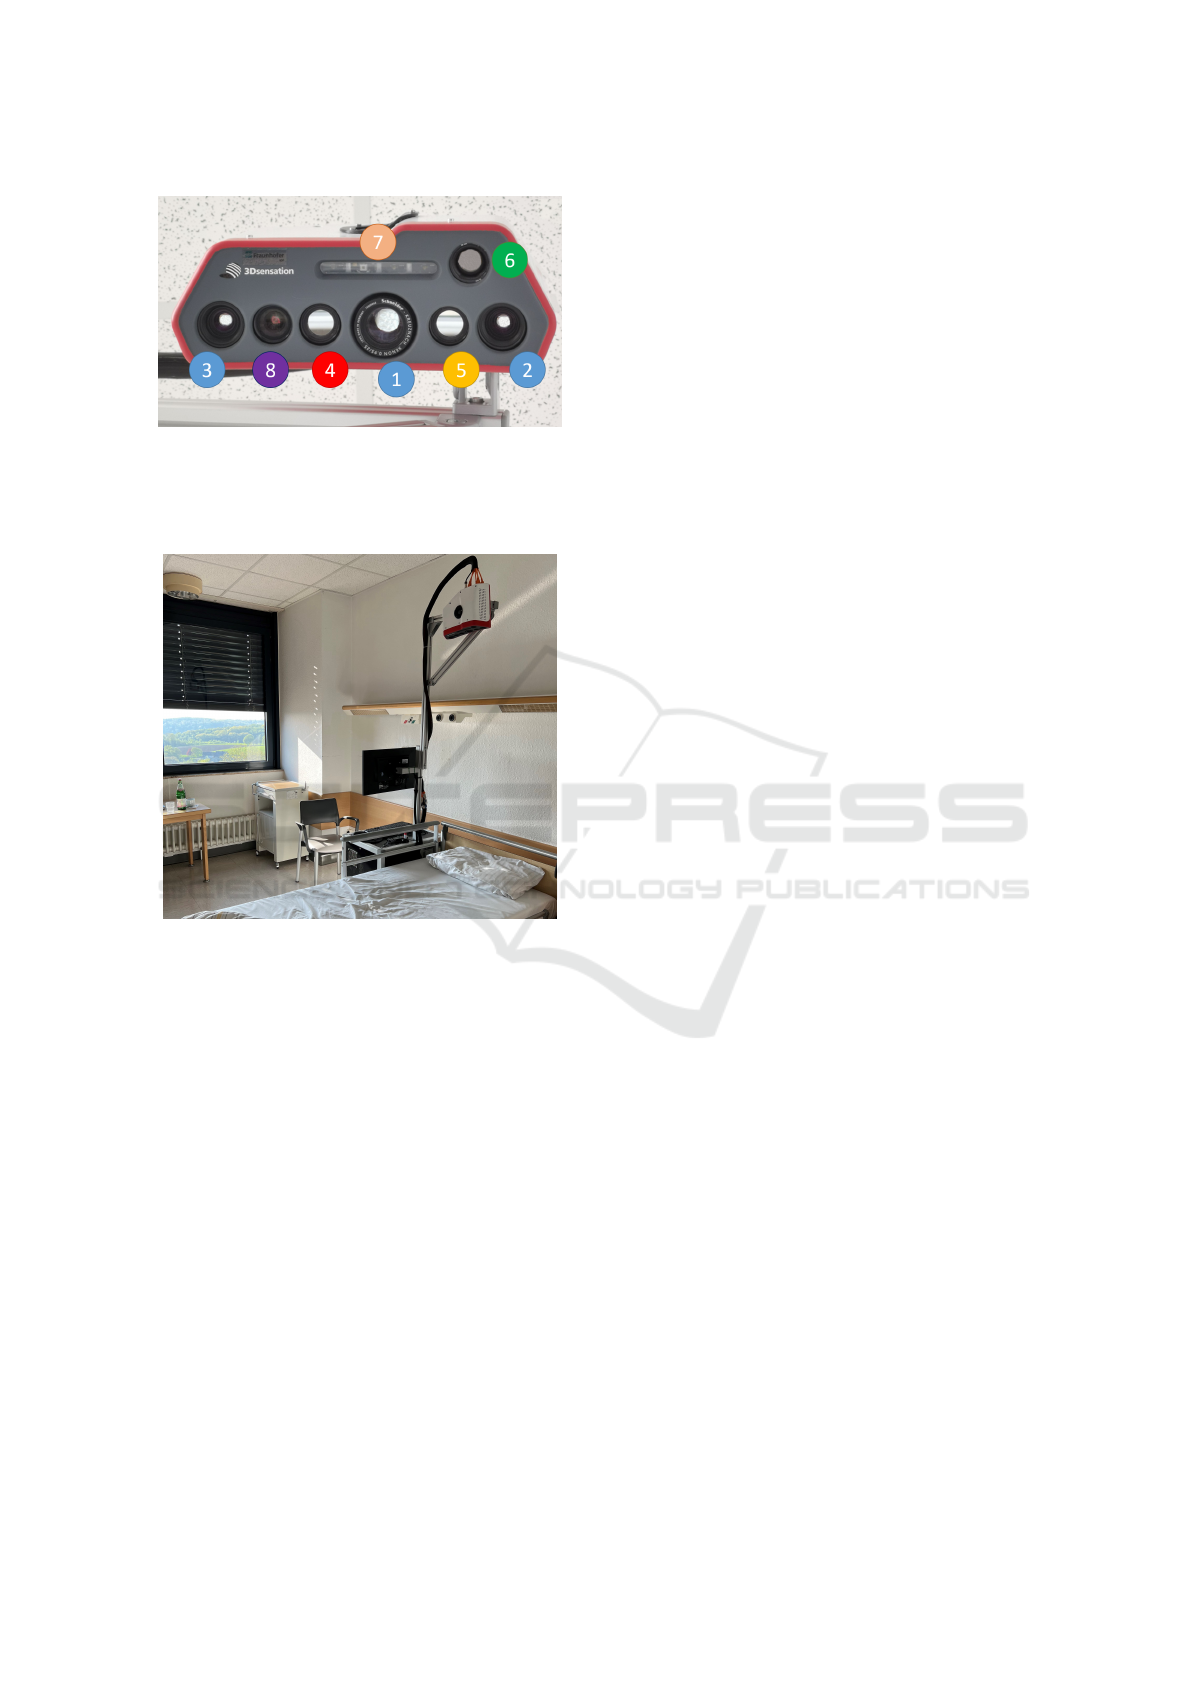
Figure 1: Sensor head composed of a GOBO projector (1),
two NIR cameras at 850 nm (2, 3), a NIR camera at 780
nm (4), a NIR camera at 940 nm (5), a thermal camera (6),
an LED array with LEDs at 780 nm and 940 nm (7), and a
reserved color camera (8).
Figure 2: Measurement setup in the sleep laboratory.
for video anonymization. Besides, different regions
of interest (ROI) are determined on the forehead, eye
corner, and below the nostrils and then transformed
into the 3D image, as shown in Fig. 4. From the sec-
ond frame, the current 3D face pose is modelled as
rigid body transformation and estimated from the 3D
locations of the facial landmarks tracked in the current
frame and their 3D locations in the first frame. Us-
ing the estimated 3D face pose, the 3D ROIs created
in the first frame are transformed into the 3D coordi-
nate system of the current frame. This ensures that
the ROIs in different frames always refer to the same
skin areas. Furthermore, the 3D face poses estimated
in different frames are used for motion analysis. If
strong head movements are detected, the face track-
ing is restarted.
The transformed 3D ROIs are then located in 2D
images at 780 nm and 940 nm as well as thermal im-
ages. The forehead ROI is projected onto the NIR
images, and the eye corner and nostrils ROIs are pro-
jected onto the thermal images. From the forehead
ROI, rPPG signals are extracted at both wavelengths
using the approach in (Zhang et al., 2020) based on
Eulerian video magnification (Wu et al., 2012). The
body temperature is extracted from the eye corner
ROI, and the respiratory temperature signal is ob-
tained from the nostrils ROI. Due to the lack of a
reference measurement in this study, the temperature
signal extracted from the eye corner ROI is omitted in
the continuation of this study.
After obtaining the computed rPPG and FIR time-
domain signals, the useful signal sequences have to be
extracted. The first step in this phase is to do a time
synchronization of the measured data and the refer-
ence data. The second step is to identify all times-
tamps where respiratory events occurred and check
whether both the measured and the reference data are
available in the time of the event. If either the mea-
sured or the reference data is not available for the
whole duration of the event, then this sequence is ex-
cluded.
The time-domain signal preprocessing starts with
detrending and normalizing the three measured time-
series signals. Secondly, the time-series are band-pass
filtered with a fixed lower cut-off frequency of 0.0667
Hz. The lower cut-off frequency is selected due to
the findings on the analysis of the breathing process
in a PPG signal in (Charlton et al., 2016). The upper
cut-off frequency is varied among 0.8, 1.0 and 1.5 Hz,
the highest frequency range for which respiratory fea-
tures are expected. Short time-series sequences of an
FIR signal and of a 780 nm rPPG signal with different
upper cut-off frequencies are shown in Fig. 5 and Fig.
6.
The last step in the preprocessing stage is to iden-
tify the respiration events in the data. During this step,
it is observed that the duration of an event is in the
range between 10 and 70 seconds. Due to the dissimi-
larity in length, events that are longer than 10 seconds
are divided into 10 second-long snips. These event-
snips are used for further data processing. Since nor-
mal breathing patterns are also required for the fur-
ther analysis, an approximately equal number of snips
from normal respiration is obtained.
For the next phase in the data processing chain,
the event-snips from both the raw and the band-pass
filtered time-series ( f
c,lower
= 0.0667 Hz, f
c,upper
=
1.0 Hz) are forwarded. The remaining three phases
in the data processing chain are elaborated in separate
subsections.
3.3 Data Fusion and Feature Extraction
Data fusion and feature extraction are the two key as-
pects of this work. We aim to take advantage of the
VISAPP 2023 - 18th International Conference on Computer Vision Theory and Applications
338
Figure 3: Overview of the steps in the data processing chain.
Figure 4: Extraction of rPPG signals and temperature (FIR)
signals from multi-modal 3D video data.
information contained in the multi-spectral data and
fuse these in a data fusion stage in order to enhance
the detection of respiratory events. This is accom-
plished by simultaneously feeding the multi-spectral
time-series signals into the feature extraction.
In the feature extraction stage, the individual fea-
tures of each time-series, but also the correlation be-
tween them are analyzed in order to find the best per-
forming features. The goal of the feature extraction
stage is to determine independent signal attributes
which hold information on the respiratory behavior
of the patient. The determination of the features to
be extracted from the multi-spectral time-series sig-
nals is done in the followings ways: (1) through dis-
cussions with sleep physicians and lung physicians
on characteristic patterns and expected waveforms of
respiratory signals; (2) through statistical and sig-
nal analysis methods; (3) through manual screening
of the data and recognition of patterns and features;
(4) through overview of published literature and fi-
nally (5) through feature evaluation algorithms (as
presented in subsection 3.4).
A first evaluation of the usefulness of a feature is
performed with histograms, in order to analyze the
distribution of a certain feature among normal respi-
ration and respiratory events. Due to space considera-
tions, only two histograms are presented in Figures 7
and 8. A total of 50 individual features are extracted
from all three spectral signals (780 nm rPPG, 940 nm
rPPG and FIR), both for the raw and for the band-
pass filtered signals. Due to space considerations, not
all features can be listed in this paper.
3.4 Feature Selection
The feature selection is conducted with the Sequen-
tial Forward Selection (SFS) and the Sequential Back-
wards Selection (SBS) algorithms (Jain, 1997). In or-
der to evaluate the selection process, a random forest
classifier is used. All features mentioned in 3.3 are
calculated for all three time-series signals (both for
the raw and band-pass filtered version) and entered
into the feature selection stage. The goal of the feature
selection stage is to make a ranking of features ac-
cording to their contribution to the classification task
at hand. The results of the feature selection stage are
discussed in section 4.2.
3.5 Classification
Two types of classification are to be conducted: (1) a
two-class classification, where it is differentiated be-
tween normal and abnormal (apneas and hypopneas
as one class) respiration; and (2) three-class classifi-
cation, where it is differentiated between normal res-
piration, apneas and hypopneas. Several classifiers
based on machine learning models are to be build
and trained for both classification tasks. The included
Contactless Optical Detection of Nocturnal Respiratory Events
339
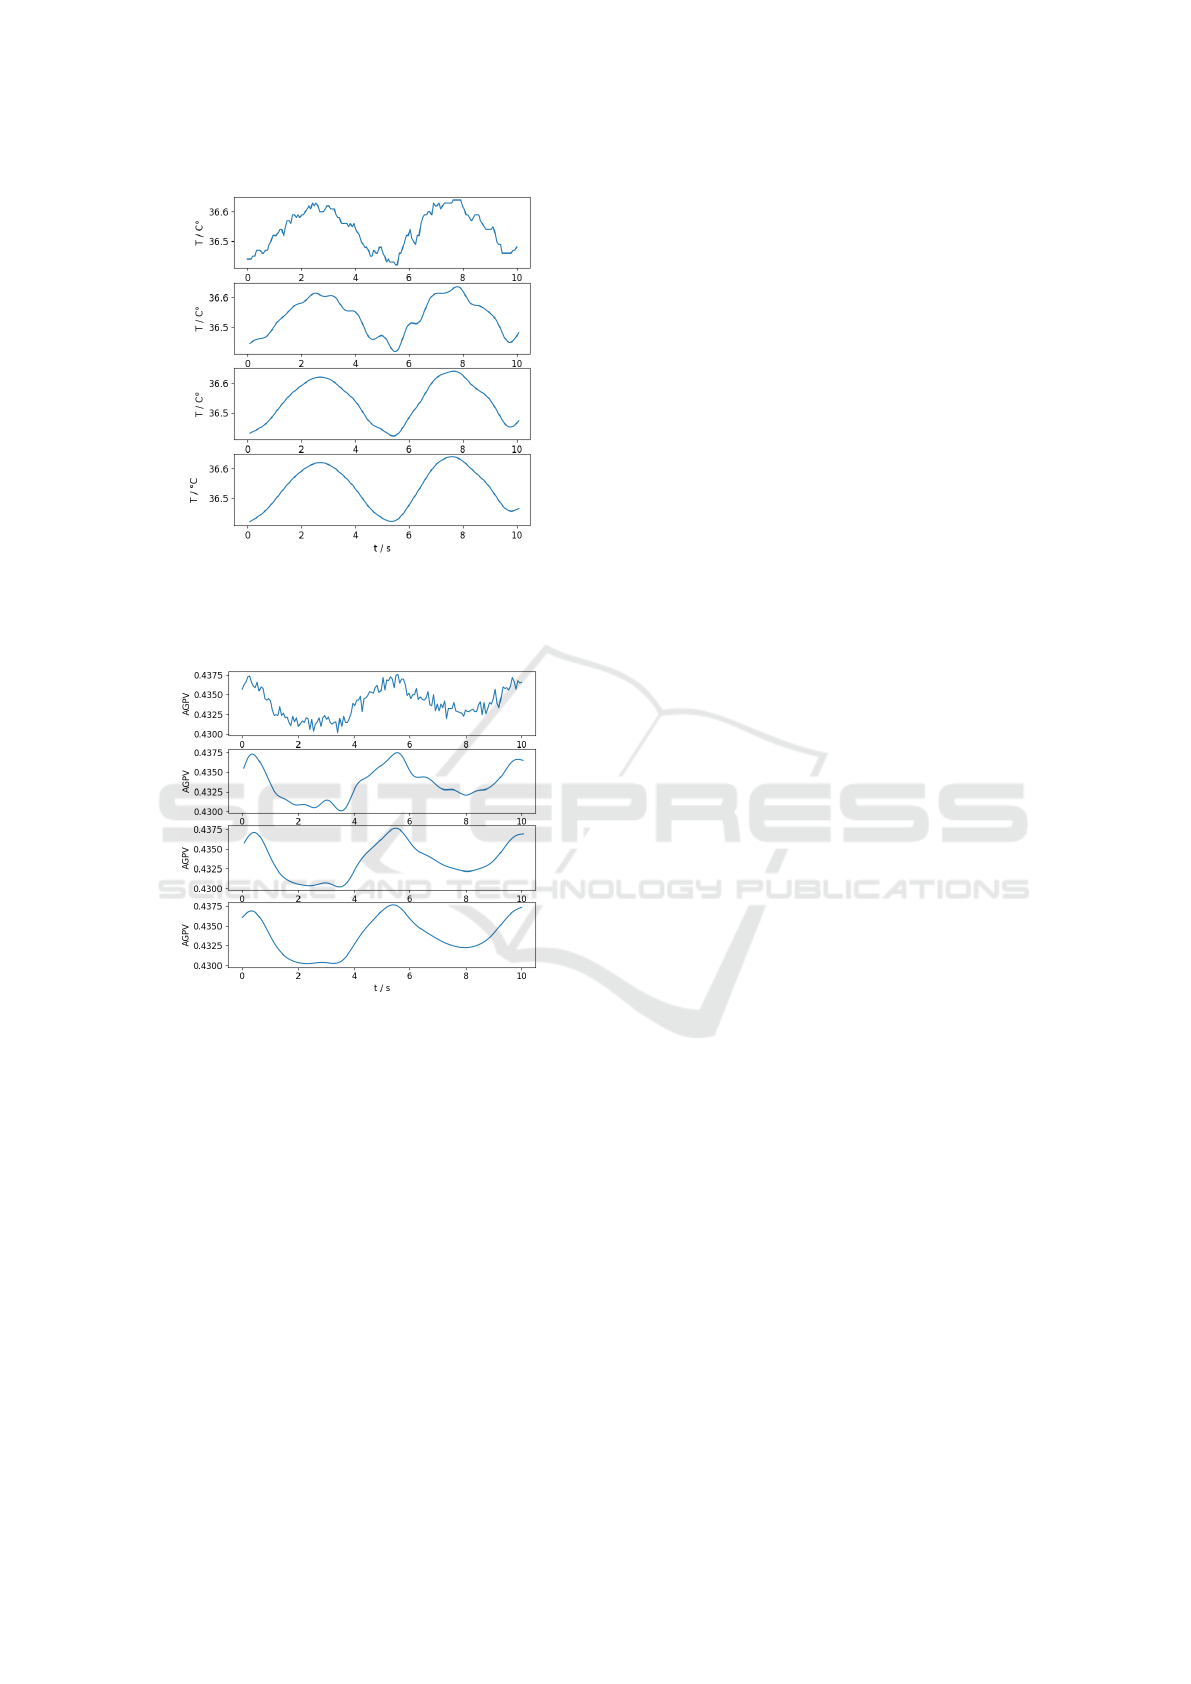
Figure 5: Time-series of FIR signal with fixed lower cut-off
and varied upper cut-off frequencies. From top to bottom:
(1) raw signal; (2) f
c,upper
= 1.5 Hz; (3) f
c,upper
= 1.0 Hz;
and (4) f
c,upper
= 0.8 Hz.
Figure 6: Time-series of 780 nm rPPG signal with fixed
lower cut-off and varied upper cut-off frequencies. From
top to bottom: (1) raw signal; (2) f
c,upper
= 1.5 Hz; (3)
f
c,upper
= 1.0 Hz; and (4) f
c,upper
= 0.8 Hz. The scale on
the y-axis is average gray-scale pixel value (AGPV).
classifiers are: decision tree classifier, random for-
est classifier, naive Bayes classifier, linear regression
analysis, quadratic regression analysis and support
vector machine. For every, a 5-fold cross-validation
is to be implemented. Furthermore, several iterations
are to be conducted for each model by using a differ-
ent number of features in order to evaluate the per-
formance of the classifiers with respect to the model
complexity. The features are ranked in the feature
selection stage and groups of features are formed by
starting from the best ranked feature downwards. The
ranking of the best performing features is presented in
subsection 4.2.
4 RESULTS
4.1 Study Sample
Three patients are included in this trial study. All
three have been transferred to the sleep laboratory
of the University Hospital Essen because of a sus-
pected OSA and this was their initial diagnosis mea-
surement. All three measurements resulted in a diag-
nosed OSA with two patients having a mild to moder-
ate and one patient having a moderate to severe case
of OSA. The severeness scaling of OSA is done ac-
cording to the American Academy of Sleep Medicine
(AASM) (Berry et al., 2020). The reference measure-
ments in our study are evaluated semi-automatically.
This means that the evaluation is firstly done auto-
matically by the Noxturnal software from ResMed
Inc and then checked and corrected by experienced
sleep physicians according to the standard provided
by AASM.
All three patients spent one night in the sleep labo-
ratory. A parallel measurement with our multi-modal
measurement device is performed with each patient.
The summed sleep time equals to 14.53 hours, out of
which 10.11 hours are successfully measured with our
measurement device (ca. 70 %). The remaining 30 %
were not obtained due to one of the following reasons:
(1) patient out of view to the measurement device; (2)
patient rotated completely to the left or to the right
side; (3) short video intervals excluded due to move-
ment artifacts; or (4) hand is covering one or more
of the ROIs. According to the reference evaluations
of the PSG, a total of 102 apneas and 143 hypopneas
are registered in the whole sleeping duration. In the
time periods which are successfully obtained by the
measurement device, a total of 67 apneas and 99 hy-
popneas are registered. An overview of relevant pa-
tient information, sleep parameters and measurement
parameters is given in Table 1. The sleep param-
eters include the AHI, the obstructive AHI (oAHI),
ODI and the number of apneas and hypopneas. The
average, standard deviation (STD) and sum are pro-
vided for feasible parameters. The total duration of
the recorded video data is 24 hours (each night be-
tween 10 PM and 6 AM).
This study is approved by the Ethics Committee
of the Faculty of Medicine, University of Duisburg-
Essen (approval no. 21-10312-BO).
4.2 Classification Results
A summary of the model accuracy compared to the
number of features for different classifiers is shown
in Fig. 9 for the two-class classification and in Fig.
VISAPP 2023 - 18th International Conference on Computer Vision Theory and Applications
340
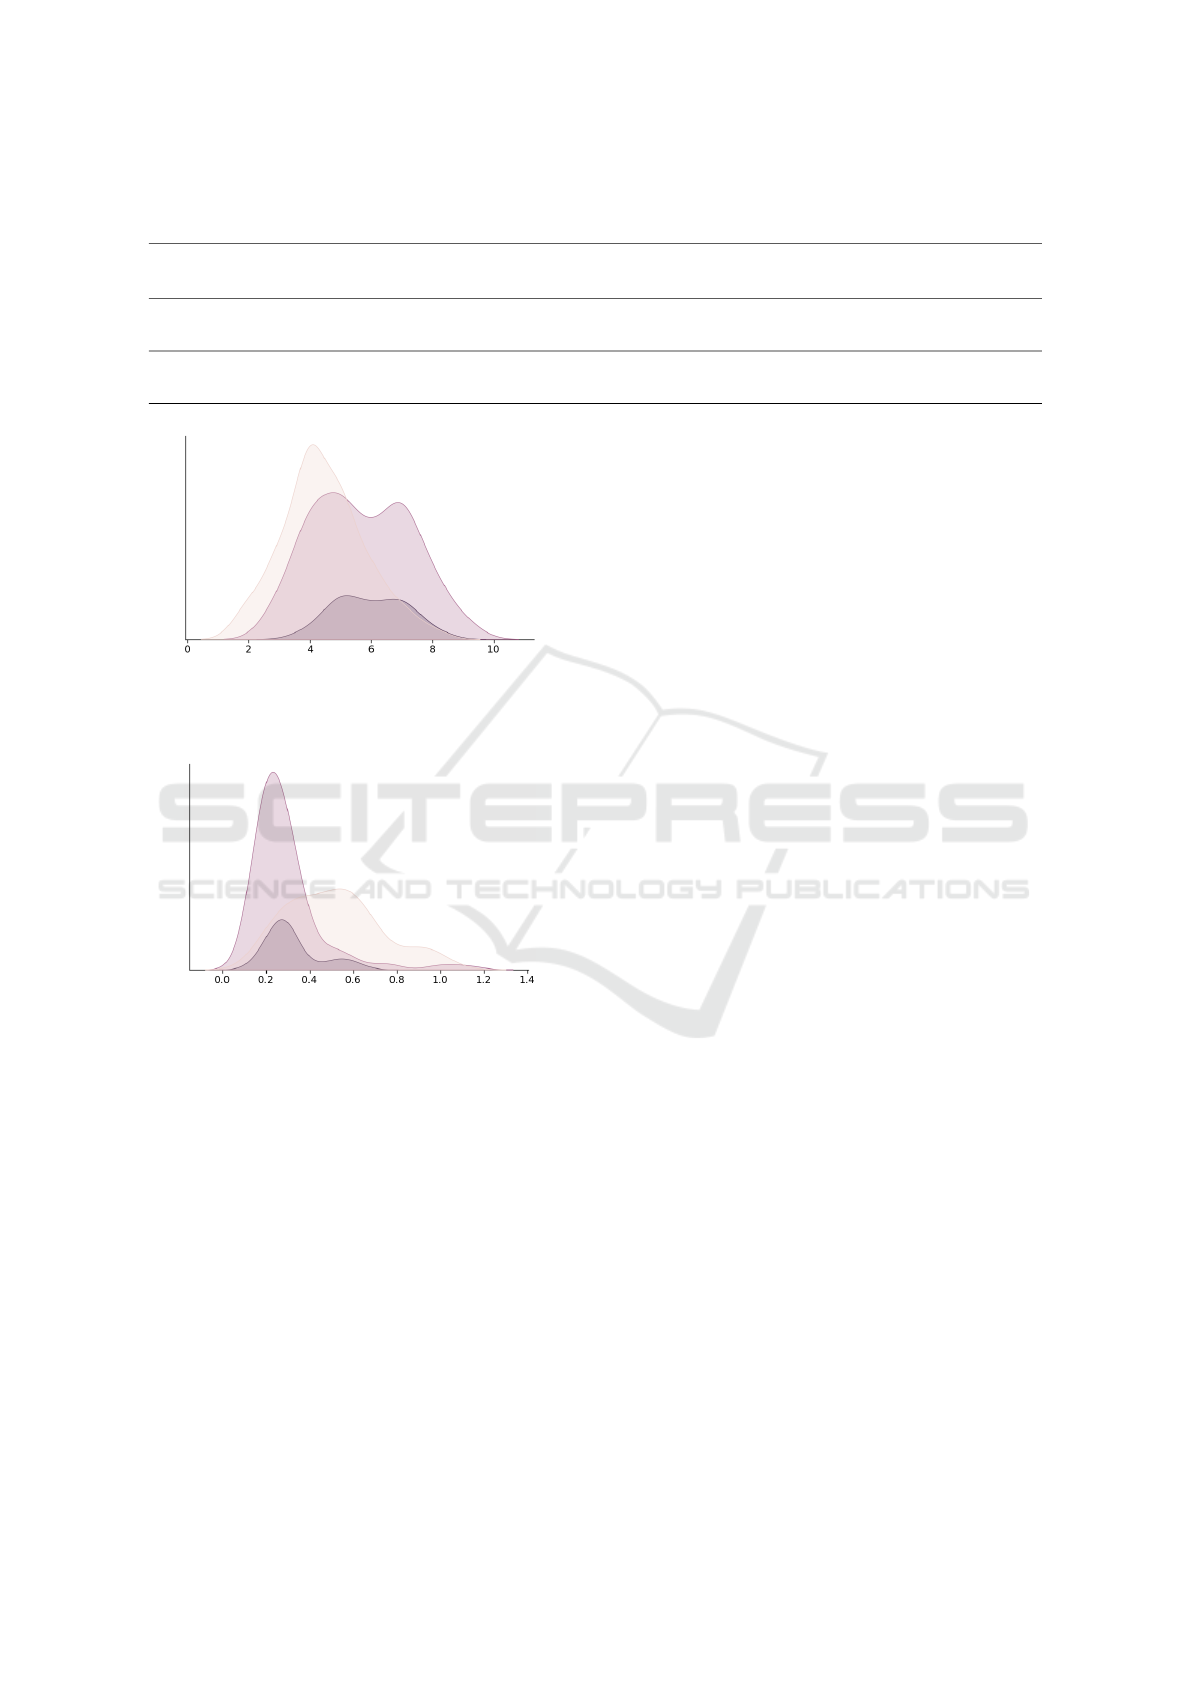
Table 1: Overview of the patient sample included in the study with their personal information and relevant sleep and mea-
surement parameters.
Patient
No.
Gender
Age
(years)
Height
(cm)
Weight
(kg)
BMI
Total
sleep
time(h)
Measured
sleep
time(h)
AHI oAHI ODI
Total
obstr.
apneas
Measured
obstr.
apneas
Total
obstr.
hypop.
Measured
obstr.
hypop.
1 male 27 188 105 29.70 5.45 4.86 14.50 14.50 9.40 54 40 25 21
2 male 48 180 98 30.20 2.85 1.64 11.93 11.93 33.70 4 2 30 15
3 female 51 172 85 28.70 6.23 3.61 29.00 21.18 34.60 44 25 88 63
Average 42.00 180.00 96.00 29.53 4.84 3.37 18.47 15.87 25.90 34.00 22.33 47.67 33.00
STD 13.00 8.00 10.15 5.35 1.77 1.62 9.21 4.77 14.30 26.46 19.14 35.02 26.15
Sum 14.53 10.11 102 67 143 99
Figure 7: Histogram of number of positive turning points
for the filtered 780 nm rPPG signal. The curve in beige
shows normal respiration, the curve in black shows apneas,
and the curve in violet shows hypopneas.
Figure 8: Histogram of the peak-to-peak distance of the FIR
signal. The curve in beige shows normal respiration, the
curve in black shows apneas, and the curve in violet shows
hypopneas.
10 for the three-class classification. The best accu-
racy for the two-class classification problem is 82 %
and it is reached with the 15 best ranked features and
the random forest classifier. Overall, it can be ob-
served that the random forest classifier provided the
highest classification accuracy for any number of fea-
tures. The random forest classifier obtained an accu-
racy of 80 % with only 2 features. This is followed
by a slight increase in accuracy until 15 features are
reached. The accuracy stayed approximately the same
after 15 features. A similar behavior, with slightly
lower accuracy is observed for all other classifiers ex-
cept for the decision tree classifier. The best accuracy
for the three-class classification problem is 74.8 %
and it is reached with the 15 best ranked features and
the linear regression analysis. For a low number (up to
five) of features, the random forest classifier is again
the most accurate model. However, the linear regres-
sion analysis outperformed the random forest classi-
fier in every other iteration with a feature count higher
than five.
For both classification tasks, a convergence of the
accuracy is observed after 15 features. Iterations are
continued until 25 features are reached and then ter-
minated after no increase in accuracy is detected. The
top ranked features by the SFS algorithm are: (1)
peak-to-peak distance in the FIR signal; (2) positive
turning points of the filtered 780 nm and 940 nm rPPG
signals; (3) absolute signal energy of the filtered and
unfiltered FIR signal; (4) skewness of the filtered 780
nm rPPG signal; and (5) mean absolute deviation of
the filtered FIR signal.
The peak-to-peak distance is the distance between
the global maximum and global minimum. As ex-
pected, the value of this feature for the FIR signal
tends to be lower for respiratory events compared to
normal respiration, since the breathing amplitude is
lower and hence, the temperature variations on the
ROI in the nasal area are lower as well. This behavior
is shown in Fig. 8. The trend found with the number
of positive turning points shows lower values for nor-
mal respiration compared to respiratory events. This
behavior is shown in Fig. 7. The assumed, however
not verified, reason for this is the lower SNR for res-
piratory event signals due to lower amplitudes.
The behavior of the absolute signal energy feature
is as expected and tends to be higher for normal res-
piration compared to respiratory events. This expec-
tation is based on the assumption that the overall area
under the curve is higher for normal respiration com-
pared to respiratory events. Skewness is the measure
of signal asymmetry. In our analysis, the skewness
in the filtered 780 nm rPPG signal tends to be higher
for normal breathing patterns compared to respiratory
events. The mean absolute deviation is a measure of
the average absolute deviation from the mean. In case
of the FIR signal, the expected behavior is that the
value for this feature is higher for normal respiration,
due to overall higher amplitudes.
Contactless Optical Detection of Nocturnal Respiratory Events
341
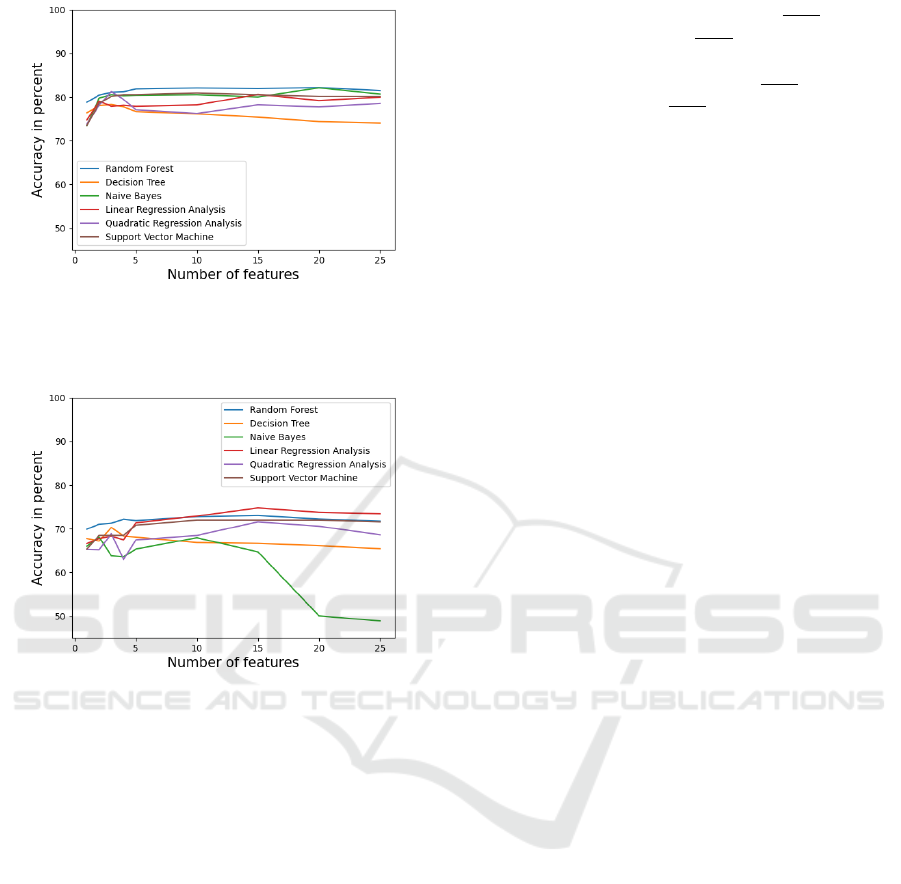
Figure 9: Accuracy of the two-class classification problem
with respect to different number of features and different
classification models. The features are ranked and selected
by the SFS algorithm.
Figure 10: Accuracy of the three-class classification prob-
lem with respect to different number of features and dif-
ferent classification models. The features are ranked and
selected by the SFS algorithm.
5 DISCUSSION
In the scope of the study, interdisciplinary discus-
sions between sleep physicians and engineers are con-
ducted in order to understand the medical and practi-
cal requirements for an automated tool which will aid
the OSA diagnosis process. We concluded that the
tool needs to be able to classify between the stages of
OSA correctly. This means that a very precise estima-
tion of the AHI score and each individual respiratory
event is not essential and beyond the practical require-
ments for the diagnosis process. For more practical
context, we obtained a study (Cachada et al., 2017),
which evaluates the detection of respiratory events in
the Noxturnal software on a sample of 120 patients.
The evaluation in this study is based on the average
number of respiratory events for the entire duration of
sleep and not on the detection of individual events.
The presented results in (Cachada et al., 2017) for
obstructive apneas are 38.95 ± 24.53
events
hour
for Nox-
turnal and 36.92 ± 25.86
events
hour
for manual evalua-
tion, resulting in a Pearson correlation of 0.954. For
hypopneas they are 19.35 ± 12.84
events
hour
for Noxtur-
nal and 25.87 ± 17.31
events
hour
for manual evaluation,
resulting in a Pearson correlation of 0.84. A study
where the performance of the software-based detec-
tion of individual respiratory event is evaluated was
not found. This means that a direct comparison with
our results is not possible. Nevertheless, the results
obtained in our trial study on a small number of pa-
tients are very promising and an encouragement to
conduct more patient measurements in order to gain
a larger dataset and further develop and improve our
models. The currently achieved accuracy proves to be
satisfactory and in line with the practical requirements
for sleep diagnostics. Further comparisons with the
accuracy of currently available respiratory event de-
tectors (such as the Noxturnal software) will be per-
formed after obtaining a larger patient dataset.
During the feature selection and classification we
observed that features from all spectral ranges con-
tribute to the classification process and enhance the
accuracy compared to using only images from a sin-
gle spectrum. This supports our premise that the use
of multi-spectral image data will positively influence
the model accuracy. The highest share among the best
ranked features comes from the FIR signal. Although
the share of 780 nm rPPG and 940 nm rPPG features
is lower, they are still present in the best ranked fea-
tures and therefore significantly contribute to the clas-
sification accuracy.
6 CONCLUSION
In this work, we have introduced a novel contact-
less optical method for detecting nocturnal respiratory
events. The method is tested on a sample of three pa-
tients and 245 respiratory events and resulted in a two-
class classification accuracy of 82 % with the random
forest classifier and a three-class classification accu-
racy of 74.8 % with a linear regression analysis. An
unexpected early convergence in accuracy after only
15 top-ranked features is observed. Further investiga-
tions are required in order to understand the early ac-
curacy convergence and to analyze whether the inclu-
sion of new features (e.g. demographic patient data)
will increase the classification accuracy.
This study is the first step towards a fully au-
tonomous contactless optical diagnosis of OSA. The
results are highly promising and further improve-
ments in model accuracy and robustness are expected
after obtaining data from more patients. Further pa-
VISAPP 2023 - 18th International Conference on Computer Vision Theory and Applications
342

tient measurements in the sleep laboratory are already
planed. After obtaining these, we will add the final
step in the data processing chain, which is the auto-
matic diagnosis of the OSA stage. Due to the limited
number of patients in this trial study we have decided
not to include this stage, but rather focus on develop-
ing an efficient detection of respiratory events.
ACKNOWLEDGEMENTS
This work is funded through a research grant (No.: SE
3160/4-1 675251) from the German Research Foun-
dation (DFG).
REFERENCES
Abad, J., Mu
˜
noz-Ferrer, A., Prada, M., L
´
opez, C., Marin,
A., Mart
´
ınez-Rivera, C., Morera-Prat, J., and Ruiz-
Manzano, J. (2016). Automatic video analysis for ob-
structive sleep apnea syndrome diagnosis. Sleep, 39.
Akbarian, S., Montazeri Ghahjaverestan, N., Yadollahi, A.,
and Taati, B. (2020). Distinguishing obstructive ver-
sus central apneas in infrared video of sleep using
deep learning: Validation study. 22(5).
Berry, R., Quan, S., Abreu, A., and et al. (2020). . The
AASM Manual for the Scoring of Sleep and Associ-
ated Events: Rules, Terminology and Technical Spec-
ifications, Version 2.6. American Academy of Sleep
Medicine.
Cachada, N., Thomas, M., and Wharton, S. (2017). Com-
parison of manual and automatic scoring of limited
channel sleep studies:noxturnal software correlates
well with manual scoring in severe osa. page PA2301.
Cattani, L., Alinovi, D., Ferrari, G., Raheli, R., Pavlidis, E.,
Spagnoli, C., and Pisani, F. (2014). A wire-free, non-
invasive, low-cost video processing-based approach to
neonatal apnoea detection. pages 67–73.
Charlton, P. H., Bonnici, T., Tarassenko, L., Clifton, D. A.,
Beale, R., and Watkinson, P. J. (2016). An assessment
of algorithms to estimate respiratory rate from the
electrocardiogram and photoplethysmogram. Physi-
ological measurement, 37:610–626.
Dietrich, P., Heist, S., Landmann, M., K
¨
uhmstedt, P.,
and Notni, G. (2019). Bicos—an algorithm for fast
real-time correspondence search for statistical pattern
projection-based active stereo sensors. Applied Sci-
ences 2019, Vol. 9, Page 3330, 9:3330.
Gastel, M. V., Stuijk, S., Overeem, S., Dijk, J. P. V., Gilst,
M. M. V., and Haan, G. D. (2021). Camera-based vi-
tal signs monitoring during sleep - a proof of concept
study. IEEE journal of biomedical and health infor-
matics, 25:1409–1418.
Gederi, E. and Clifford, G. D. (2012). Fusion of image and
signal processing for the detection of obstructive sleep
apnea. pages 890–893.
Geertsema, E., Visser, G., Sander, L., and Kalitzin, S.
(2020). Automated non-contact detection of central
apneas using video. Biomedical Signal Processing
and Control, 55:101658.
Heinzer, R., Vat, S., Marques-Vidal, P., Marti-Soler, H., An-
dries, D., Tobback, N., Mooser, V., Preisig, M., Mal-
hotra, A., Waeber, G., Vollenweider, P., Tafti, M., and
Haba-Rubio, J. (2015). Prevalence of sleep-disordered
breathing in the general population: the hypnolaus
study. The Lancet. Respiratory medicine, 3:310–318.
Heist, S., Dietrich, P., Landmann, M., K
¨
uhmstedt, P., Notni,
G., and T
¨
unnermann, A. (2018). Gobo projection
for 3d measurements at highest frame rates: a perfor-
mance analysis. Light: Science and Applications 2018
7:1, 7:1–13.
Hu, M., Zhai, G., Li, D., Fan, Y., Duan, H., Zhu, W., and
Yang, X. (2018). Combination of near-infrared and
thermal imaging techniques for the remote and simul-
taneous measurements of breathing and heart rates un-
der sleep situation. Plos One.
Jain, A. (1997). Feature selection: evaluation, application,
and small sample performance. IEEE Transactions on
Pattern Analysis and Machine Intelligence, 19:153–
158.
Kapur, V. K., Auckley, D. H., Chowdhuri, S., Kuhlmann,
D. C., Mehra, R., Ramar, K., and Harrod, C. G.
(2017). Clinical practice guideline for diagnostic test-
ing for adult obstructive sleep apnea: An american
academy of sleep medicine clinical practice guideline.
Journal of Clinical Sleep Medicine, 13:479–504.
Karimi, M., Hedner, J., H
¨
abel, H., Nerman, O., and Grote,
L. (2015). Sleep apnea related risk of motor vehi-
cle accidents is reduced by continuous positive airway
pressure: Swedish traffic accident registry data. Sleep,
38:341–349.
Lorato, I., Stuijk, S., Meftah, M., Kommers, D., An-
driessen, P., van Pul, C., and de Haan, G. (2021). Au-
tomatic separation of respiratory flow from motion in
thermal videos for infant apnea detection. Sensors,
21(18).
Lugaresi, C., Tang, J., Nash, H., Mcclanahan, C., Uboweja,
E., Hays, M., Zhang, F., Chang, C.-L., Yong, M. G.,
Lee, J., Chang, W.-T., Hua, W., Georg, M., Grund-
mann, M., and Research, G. (2019). Mediapipe: A
framework for building perception pipelines.
Rundo, J. V. (2019). Obstructive sleep apnea basics. Cleve-
land Clinic journal of medicine, 86:2–9.
Scebba, G., Da Poian, G., and Karlen, W. (2021). Mul-
tispectral video fusion for non-contact monitoring of
respiratory rate and apnea. IEEE Transactions on
Biomedical Engineering, 68(1):350–359.
Veauthier, C., Ryczewski, J., Mansow-Model, S., Otte, K.,
Kayser, B., Glos, M., Sch
¨
obel, C., Paul, F., Brandt,
A., and Penzel, T. (2019). Contactless recording of
sleep apnea and periodic leg movements by nocturnal
3-d-video and subsequent visual perceptive comput-
ing. Scientific Reports, 9:16812.
Vogels, T., Gastel, M. V., Wang, W., and Haan, G. D.
(2018). Fully-automatic camera-based pulse-oximetry
during sleep. IEEE Computer Society Conference on
Contactless Optical Detection of Nocturnal Respiratory Events
343

Computer Vision and Pattern Recognition Workshops,
2018-June:1430–1438.
Weinreich, G., Wessendorf, T. E., Erdmann, T., Moebus,
S., Dragano, N., Lehmann, N., Stang, A., Roggen-
buck, U., Bauer, M., J
¨
ockel, K. H., Erbel, R., Teschler,
H., and M
¨
ohlenkamp, S. (2013). Association of
obstructive sleep apnoea with subclinical coronary
atherosclerosis. Atherosclerosis, 231:191–197.
Wu, H. Y., Rubinstein, M., Shih, E., Guttag, J., Durand, F.,
and Freeman, W. (2012). Eulerian video magnifica-
tion for revealing subtle changes in the world. ACM
Transactions on Graphics (TOG), 31.
Yang, C., Cheung, G., Stankovic, V., Chan, K., and Ono,
N. (2017). Sleep apnea detection via depth video and
audio feature learning. IEEE Transactions on Multi-
media, 19(4):822–835.
Zhang, C., Gebhart, I., K
¨
uhmstedt, P., Rosenberger, M.,
and Notni, G. (2020). Enhanced contactless vital sign
estimation from real-time multimodal 3d image data.
Journal of Imaging 2020, Vol. 6, Page 123, 6:123.
VISAPP 2023 - 18th International Conference on Computer Vision Theory and Applications
344
