
Data Leakage in Isolated Virtualized Enterprise Computing Systems
Zechariah Wolf
a
, Eric C. Larson
b
and Mitchell A. Thornton
c
Darwin Deason Institute for Cybersecurity at Southern Methodist University, Dallas, TX, U.S.A.
Keywords:
Power Analysis, Side Channel, Virtual Machine, Enterprise Systems.
Abstract:
Previous literature has shown the effectiveness of power analysis as a side channel attack on cryptosystems.
Power analysis is performed using an oscilloscope to measure power consumption information from hardware
utilized during cryptographic algorithms, in order to extract an encryption key. In this paper, we further explore
the potential of power analysis of side channels for leaking information in enterprise computing systems. By
applying the concept of power analysis more broadly to the power consumption of an entire server rack, rather
than individual hardware components, we find that basic patterns in system load can be clearly identified using
signal processing techniques, demonstrating a potential side channel.
1 INTRODUCTION
In the most general sense, a side channel is any means
by which information about the state of a computing
system is leaked unintentionally. From a defensive
perspective, side channels are important to identify
and mitigate in order to reduce the feasibility of side
channel vulnerabilities in otherwise secure algorithms
and systems. An attacker can use side channels to ex-
tract information, and a “side channel attack” is de-
fined as an exploit of a particular side channel to ex-
tract private or sensitive information from a system.
Side channel attacks are particularly dangerous be-
cause the vulnerability exists not in an algorithm or
system itself, but in the nature of how a system physi-
cally works. For example, an otherwise cryptograph-
ically secure encryption algorithm could be vulnera-
ble to a side channel attack because of information
leaked from the hardware components on which the
algorithm was performed (Szefer, 2019).
However, side channels do not only represent a
potential weakness. Recent work has shown that
side channel data can be used defensively to iden-
tify anomalous behavior in a system that could be
indicative of malware. As an example, Taylor et al.
demonstrated a machine learning approach for early
detection of a ransomware attack using the side chan-
nel of physical sensor data as an indicator of anoma-
lous system behavior (Taylor et al., 2021). Trained
a
https://orcid.org/0000-0002-2226-0327
b
https://orcid.org/0000-0001-6040-868X
c
https://orcid.org/0000-0003-3559-9511
models were able to identify subtle, randomly timed
file encryption operations happening in a simulated
ransomware attack with high accuracy. Similarly,
Khan et al. demonstrated a deep learning approach
for detecting various malware attacks using electro-
magnetic side channel data emanating from an FPGA
(Khan et al., 2019). After being trained to recog-
nize the state of the system under normal operations,
a deep neural network was able to accurately detect
the anomalous conditions caused by simulated mal-
ware attacks, with perfect accuracy in some test cases.
Thus, side channel investigations are important not
only for identification and mitigation of vulnerabili-
ties, but also for exploring use cases in defensive strat-
egy.
In this paper, we focus on a power analysis of
a side channel identified in an enterprise comput-
ing system. However, the data capture we employ
uses a non-traditional methodology that leverages the
electromagnetic interference (EMI) backscatter that
is generated by a computing system while in oper-
ation. This EMI has been used by a number of re-
searchers for identifying electrical devices and appli-
ances (Patel et al., 2007; Gupta et al., 2010), for iden-
tifying changes in electrical device signature that can
be repurposed for interaction techniques (Gupta et al.,
2011; Chen et al., 2013), and has been shown to leak
information regarding television programming (Enev
et al., 2011). Here, we use shifts in the EMI system
fingerprint to indicate the internal state of a comput-
ing system running a virtual machine (VM), showing
that it can be used as a covert side channel.
118
Wolf, Z., Larson, E. and Thornton, M.
Data Leakage in Isolated Virtualized Enterprise Computing Systems.
DOI: 10.5220/0011691900003405
In Proceedings of the 9th International Conference on Information Systems Security and Privacy (ICISSP 2023), pages 118-123
ISBN: 978-989-758-624-8; ISSN: 2184-4356
Copyright
c
2023 by SCITEPRESS – Science and Technology Publications, Lda. Under CC license (CC BY-NC-ND 4.0)

Table 1: Comparison of related side channel investigations.
Approach Advantages Limitations Reference
EM side channel analysis for
malware detection
Non-invasive, noise re-
silient, high detection
accuracy
Experimentation limited
to embedded systems
(Khan et al.,
2019)
Deep-learning-based power
side channel attack on AES
Attack is effective across
different kinds of devices
Data acquisition requires
direct access to micro-
controller power supply
(Golder et al.,
2019)
PLATYPUS - software-
based power analysis
attacks on cryptosystems
Tested channels are accessi-
ble via software interface
Software-based attack is
limited to Intel CPUs
(Lipp et al.,
2021)
Our approach Non-invasive, demonstrates
information leakage in a VM
environment
Resilience to noise not
yet quantified
EMI and EMI-adjacent side channel analysis is an
ongoing area of research, with applications ranging
from cryptanalysis to malware detection. A few ex-
amples of similar side channel research with varying
applications is presented in Table 1.
2 BACKGROUND
Power analysis is a method of extracting informa-
tion from a side channel – typically power consump-
tion measurements from hardware components. In
a power analysis attack, an oscilloscope is typically
used to gather data. The data can be analyzed to ex-
tract information about the state of the computing sys-
tem. Power analysis research is not new. In 1999,
Kocher et al. demonstrated a power analysis side
channel attack on the DES encryption algorithm. By
collecting traces of electrical current measurements
over time, they were able to extract an encrpytion
key using two different power analysis approaches
(Kocher et al., 1999). Despite years of advance-
ment in technology and heightened awareness of se-
curity, power analysis of side channels remains a dif-
ficult challenge to overcome, and researchers are still
finding ways to exploit side channels to break cryp-
tosystems. For instance (Lipp et al., 2021) recently
demonstrated a series of power analysis attacks for
extracting encryption keys through power side chan-
nels identified in Intel CPUs.
However, looking beyond the scope of cryptosys-
tems, power analysis could have applications in side
channels more broadly. Previous research has inves-
tigated power analysis of specific hardware compo-
nents used in encryption algorithms in order to leak
specific data being used in the algorithm. We de-
cided to investigate how this kind of approach could
reveal a side channel at the scale of an entire com-
puting system, rather than individual hardware com-
ponents. Specifically, it would be of interest to iden-
tify a potential side channel in an enterprise comput-
ing system, where tasks are typically run on virtual
machines, with the hypervisor acting as a layer of ab-
straction between the virtual machine and the physical
hardware.
It is also important to note that the EMI generated
by a computing system is related to the power usage
of the system, but can also be influenced by other sys-
tems on the same circuit or other devices that cause
backscatter at certain frequencies on the voltage spec-
trum. The EMI generated by the computing system
is most easily seen by performing a kHz range fre-
quency analysis on the circuit near where the system
is obtaining power (see Figure 4). Because this EMI
is generated along the entire circuit, this signature can
be obtained by sampling from any nearby power out-
let. Thus, direct access to the computing system is not
required to carry out this exploit.
2.1 Hypothesis
We hypothesize that in an enterprise computing sys-
tem using virtualization software, information about
the state of a virtual machine is leaked through the
side channel of the server’s power consumption, pro-
vided the server’s power supply is not employing
proper side channel mitigation. We propose and per-
form an experiment to modulate the power consump-
tion in an identifiable pattern, expecting that if power
metrics are collected over time, power analysis will
reveal the pattern, showing that the side channel is vi-
able and an attacker can ex-filtrate information about
the state of the virtual machine.
Data Leakage in Isolated Virtualized Enterprise Computing Systems
119
3 EXPERIMENTAL DESIGN
In order to evaluate the potential of a power analysis
side channel in an enterprise computing system with
virtualization, we propose an experimental approach
to collect and analyze power consumption metrics
from a server rack.
3.1 Server Rack
The rack used in this experiment contains ten sepa-
rate servers. The power supplies for each server, as
well as the network switches and other rack compo-
nents, are combined into a single 120V AC wall plug,
that powers the entire rack. The servers on the rack
are running a well-known virtual OS as the host op-
erating system. A second laptop is used to connect
to and control the virtual machines on the server over
LAN. The operating system chosen for the virtual ma-
chines is Kubuntu 22, a distribution of Ubuntu using
the KDE Plasma desktop environment.
In order to modulate the power consumption on
the server, an open-source Linux package called
stress-ng is used
1
. The stress-ng tool is a command
line interface that allows the user precise control over
a machine’s hardware, enabling creation of highly
customizable system loads. stress-ng is an extensive
package with a large variety of options for generat-
ing system stress, but as a proof concept in this ex-
periment, we use stress-ng specifically for generating
CPU utilization. The goal with using stress-ng is to
generate a pattern of power consumption that is recog-
nizable and distinguishable from background noise.
To accomplish this, a shell script is used to initiate
a stress-ng load for a certain time interval, and then
sleep for an interval. This should create states of high
and low power consumption on the server that we de-
sire to collect as a side channel, ex-filtrating a binary
stream of information. The shell script used in the ex-
periment is summarized by the following pseudocode:
for ((i=0; i < numCycles; i++)) do
sleep 1 #idle for 1 second
stress-ng --cpu 16 -t 1s
done
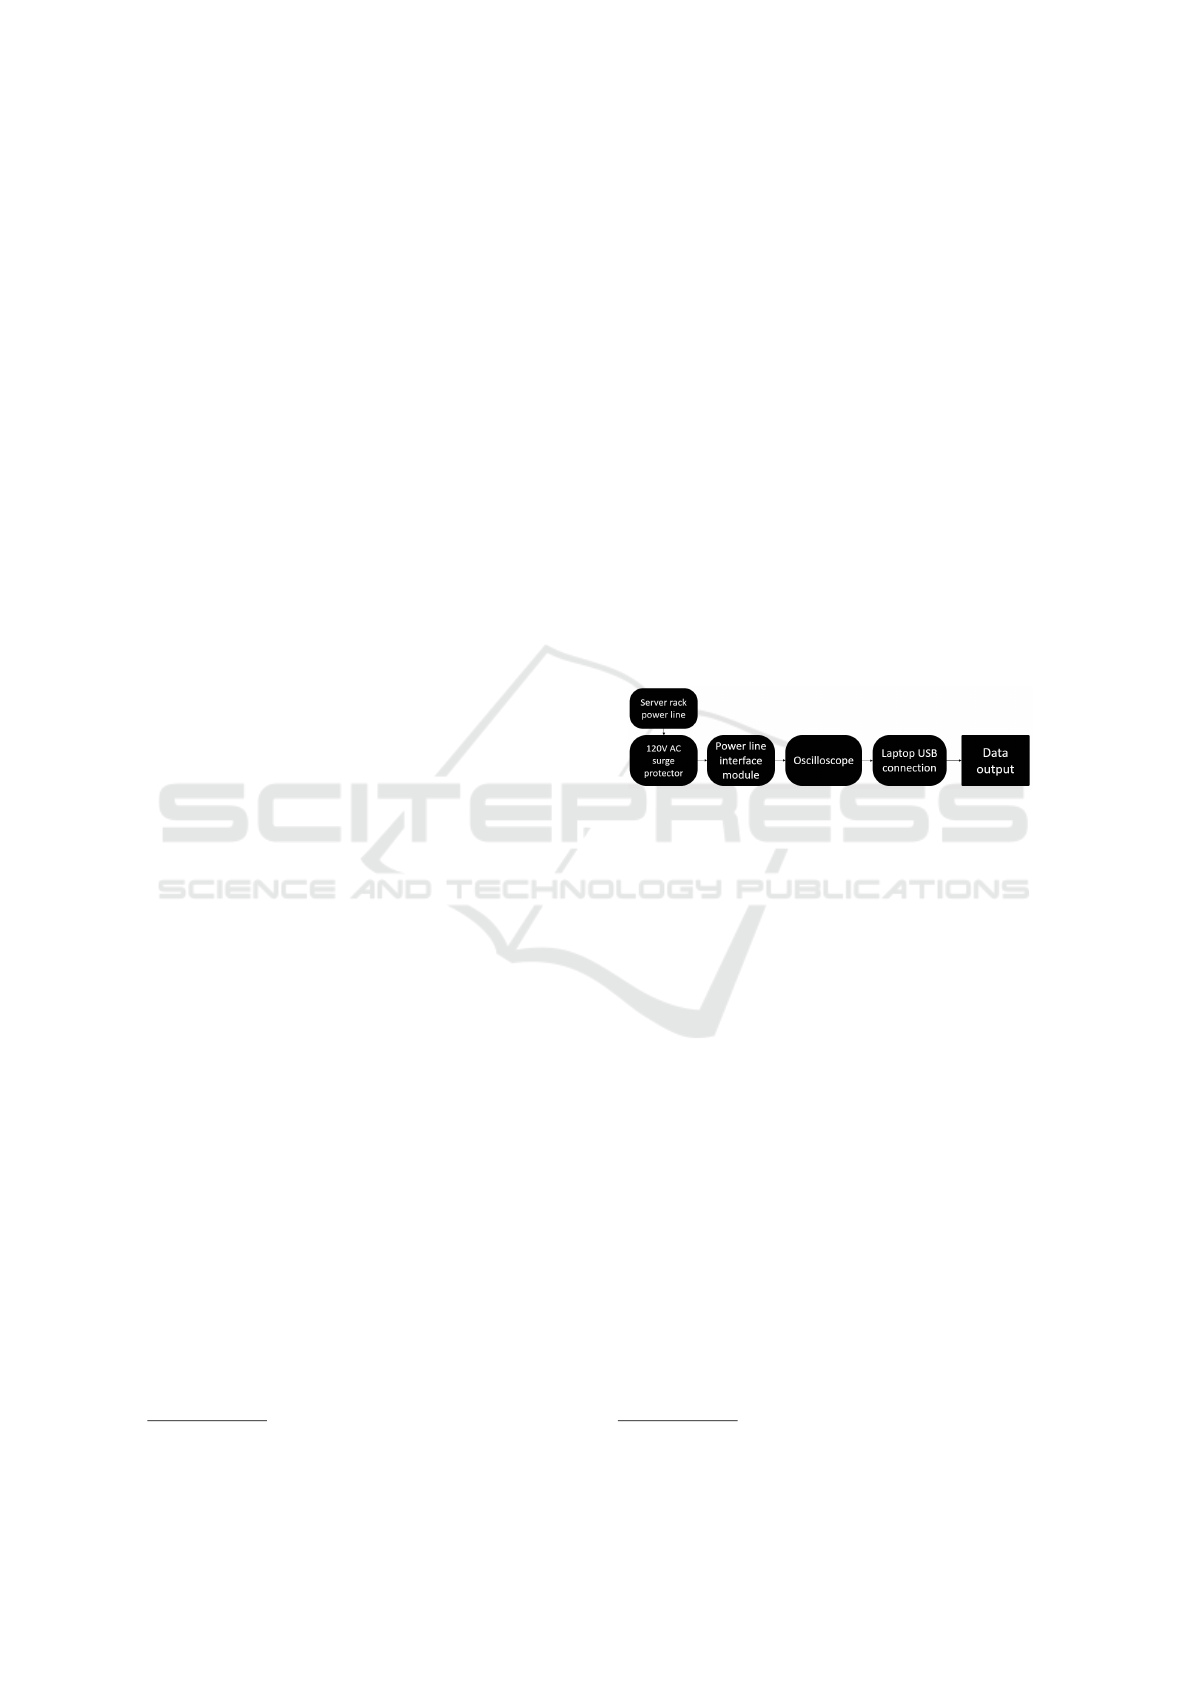
3.2 Power Analysis Approach
In order to record measurements of the power con-
sumption, the rack is plugged into a surge protector
and our power line interface (PLI) module is plugged
into a nearby power outlet on the same circuit breaker.
This PLI module acts as a high pass filter, and is a re-
construction of a circuit originally used in an exper-
1
https://github.com/ColinIanKing/stress-ng
iment to classify the use of home appliances (Gupta
et al., 2010). This PLI allows us to collect high fre-
quency EMI in the range of about 0 to 50 kHz. The
module connects the power line from the surge pro-
tector to the oscilloscope. The oscilloscope used in
this experiment is from the Picoscope 4000a series.
The oscilloscope is connected via USB to a laptop
which has the required software and drivers to mon-
itor and collect data from the device. Picoscope pro-
vides a monitoring software to show in real-time the
measurements from the connected oscilloscope. We
also make use of a Python wrapper library for the
Picoscope software development kit, which allows
us to collect data from the oscilloscope with a cus-
tom Python script. This script is based on examples
provided by the maintainers of the Python package
2
. While the stress-ng loads are running on the vir-
tual machine, the laptop connected to the oscilloscope
runs a data collection script, which collects voltage
measurements at a specified sampling rate, and out-
puts the result to a file.
Figure 1: Block diagram showing data collection process.
4 EXPERIMENTAL RESULTS
4.1 Initial Exploration of the Hypothesis
Before performing formal experiments, we used Pi-
coscope’s software to observe visualizations of the
data obtained from the oscilloscope in real-time. The
software generates a live frequency spectrum, which
shows voltage gain vs. frequency. We observed this
graph while generating a power consumption square
wave on one of the servers in the rack, the goal being
to see if the modulation in power consumption was
visually discernible. The results were quite clear.
Figure 2 shows the real-time graph when the vir-
tual machine is sitting at idle, with no high-load tasks
running. There is a noticeable spike in the spectrum
at around 30-35 kHz.
Figure 3 shows the same graph when a 100% CPU
utilization stress test is running. The spike that was
present under idle conditions falls dramatically. Dur-
ing the real-time experiment, this fall and rise pattern
correlated exactly with the initiation and ending of the
stress test. Since this rise and fall is occurring at the
2
https://github.com/picotech/picosdk-python-wrappers
ICISSP 2023 - 9th International Conference on Information Systems Security and Privacy
120
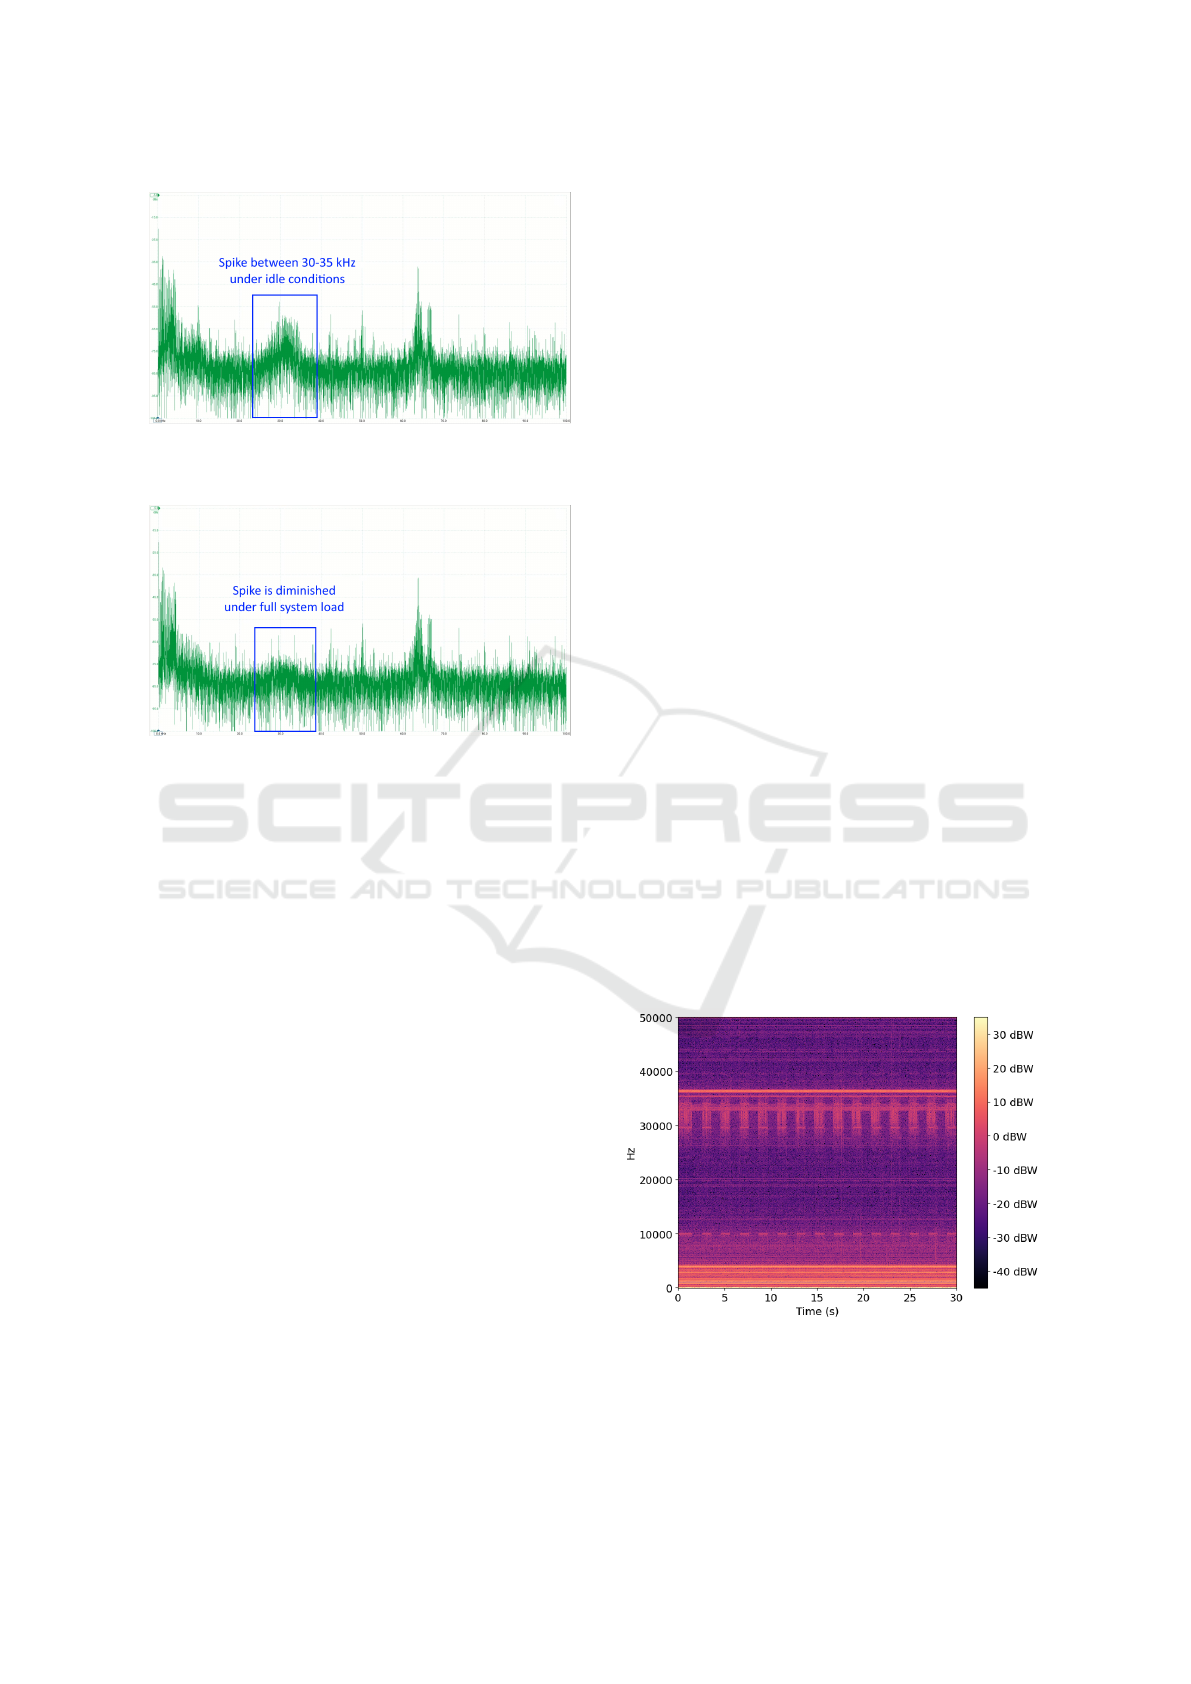
Figure 2: Real-time power spectral density (dBu) vs. fre-
quency (kHz) graph with the virtual machine at idle.
Figure 3: Real-time power spectral density (dBu) vs. fre-
quency (kHz) graph with the virtual machine at 100% CPU
utilization.
30-35 kHz range, this indicates that the data collec-
tion script should sample above 70 kHz in order to
capture this EMI signal properly.
4.2 Signal Processing
The voltage gain vs. frequency graph was useful for
observing the change in real-time, but in order to eval-
uate the possibility of a covert side channel, we must
be able to reliably detect the high and low states oc-
curring over a time range. A transformation that fa-
cilitates this detection is the voltage magnitude spec-
trogram. A magnitude spectrogram can be visualized
like a heat map showing the voltage gain as the inten-
sity and the frequency (along the vertical axis) at each
point in time (along the horizontal axis).
The output of the data collection script is a single
array of values, which represent the voltage signal in
the time domain. In order to produce a spectrogram,
the raw voltage information collected from the os-
cilloscope is processed in a short-time Fourier trans-
form, which produces a complex-valued matrix, such
that each vertical slice represents the frequency spec-
trum of the signal at a given point in time. The matrix
is then decibel-scaled based on the magnitude of the
complex values, in order to reduce the dynamic range
of the output. The final result shows the decibel-
scaled voltage intensity at each frequency (vertical
axis), at each point in time (horizontal axis). In par-
ticular, we use a spectrogram with a window length
of 2048 points (about 20 ms), 75% overlap, and von
Hann windowing. The signal processing procedure
is performed using open-source packages in Python.
For signal processing algorithms and spectrogram vi-
sualizations we use Librosa (McFee et al., 2015). The
visualizations are supported by Matplotlib (Hunter,
2007). Finally, we make use of Numpy for storing
the data during processing (Harris et al., 2020).
If the proposed side channel is viable, we should
expect to see an easily distinguishable pattern of high
intensity, followed by low intensity, at around the 30-
35kHz range, correlating with the idle periods, and
high CPU utilization periods respectively.
4.3 Ideal Scenario
4.3.1 Binary State Identification
Our first investigation is to test if a side channel ex-
ists under ideal circumstances. For this test case, one
server with one virtual machine attempts to generate
a square wave with a period of two seconds. The shell
script repeats on loop a sequence of a 1 second stress
test, at 100% CPU utilization, followed by a 1 sec-
ond period of inactivity. This is repeated while the
data collection script records the signal in millivolts.
Since the frequency spectrum was affected in the 30-
35 kHz range, we use a sample rate of 100 kHz. The
data is collected over a windows of 30 seconds. After
applying the data processing steps, the spectrogram is
generated as shown in Figure 4.
Figure 4: Spectrogram of square wave with a period of two
seconds.
This spectrogram corroborates our hypothesis that
data can be ex-filtrated. While the machine is in an
Data Leakage in Isolated Virtualized Enterprise Computing Systems
121
idle state, we observe bands of high intensity in the
30-40 kHz range. While the machine is under high
stress, the high intensity region fades to match the
background. An interesting observation is that the
high and low states are recognizable not only between
30 and 40 kHz, but also quite clearly at 10 kHz, al-
though the bands are not as intense. This is impor-
tant to note because it means that a high frequency
sampling circuit is not strictly necessary to be able to
observe the power consumption EMI fingerprint.
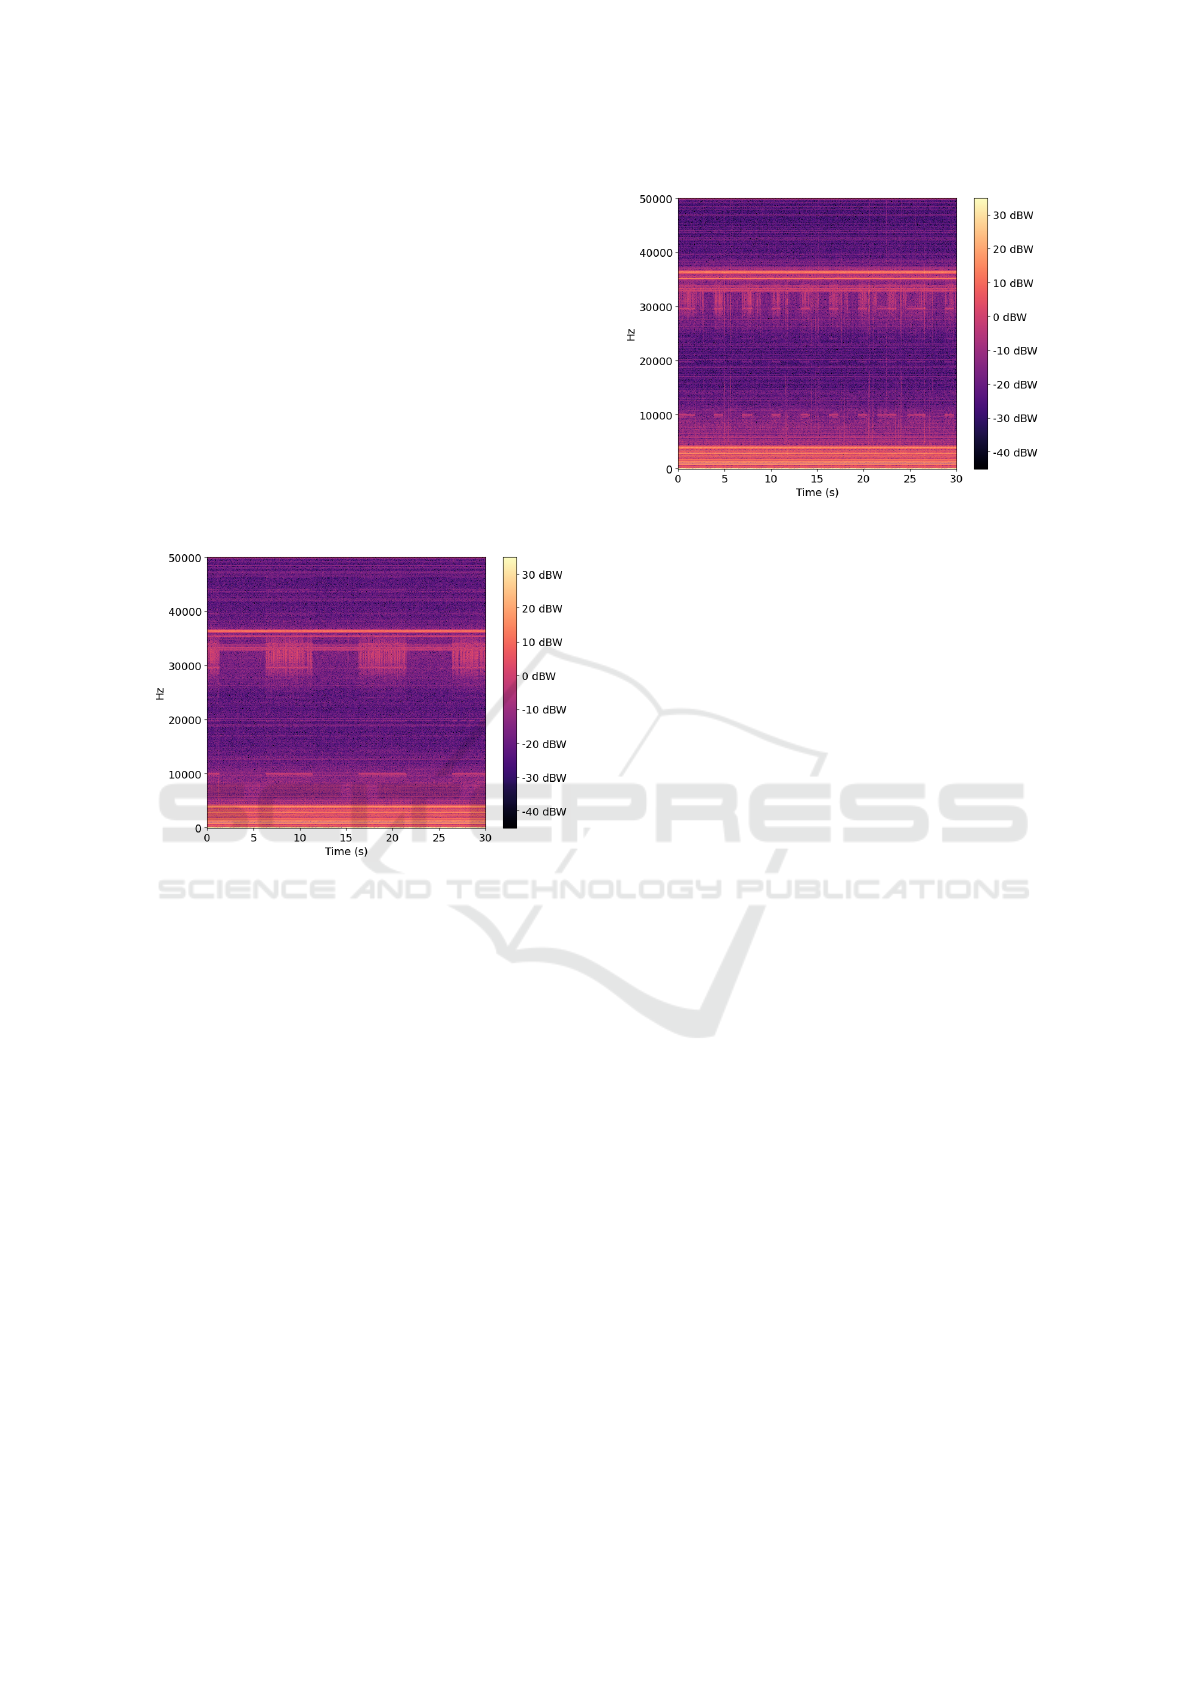
For the sake of demonstrating reproducibility, the
experiment is repeated in the same fashion, except
with the square wave having a period of ten seconds
(five seconds low, five seconds high). Figure 5 shows
the spectrogram generated from the process.
Figure 5: Spectrogram of square wave with a period of ten
seconds.
The spectrogram shows once again that the square
wave is easily identifiable, both between 30 and 40
kHz, and at 10 kHz. Thus we conclude that under
minimal background noise, this attack is discernible.
We now turn our attention to non-binary ex-filtration,
using the CPU usage to influence the EMI signature.
4.3.2 Ternary State Identification
Finally, we tested how different levels of CPU utiliza-
tion would show up in the spectrogram. In stress-ng,
this is accomplished using an argument to specify a
particular CPU utilization level. The shell script is
modified to cycle from idle, to 50% CPU utilization,
to 100% CPU utilization, repetitively. We expect this
to show three different levels of intensity in the spec-
trogram, which could be used as three separate data
symbols in a streaming information side-channel.
The spectrogram in Figure 6 shows the processed
thirty second trace. The goal in this test was to gener-
ate discernible states of low, medium, and high inten-
sity. As in the prior tests, the low and high states are
quite different visually. However, the medium state is
Figure 6: Spectrogram showing power modulations at three
levels.
not as clearly defined. Interestingly, the pattern does
not manifest as clearly at the 10 kHz range. It is un-
clear if this ternary state can be easily detected auto-
matically. For instance, a machine learning algorithm
may be able to discern the different states from one
another.
5 CONCLUSIONS
Using EMI fingerprints as a side channel for power
analysis in a computing system was shown to be fea-
sible. In particular, we show that binary information
can be ex-filtrated from the system at a rate of at least
1 symbol per second. The receiver of the information
does not need to be co-located with the system un-
der attack—it only requires to be on the same power
line as the computing system (such as a power outlet
in a nearby room). Using a frequency based analy-
sis of the data, a clear signal can be received using
binary symbols. Additional data symbols may also
be possible, but require further investigation. The ex-
perimental results in this paper indicate our position
that network-isolated virtual processes are capable of
leaking sensitive information via a power-based side
channel.
5.1 Background Noise Conditions
While our experiments show promise as a proof of
concept, our test cases represent somewhat ideal cir-
cumstances that are not typical of an enterprise com-
puting environment. In a real-world application, a
server rack might have many servers with multiple
virtual machines running, each performing different
tasks with varying power consumption requirements.
This would generate a significant amount of back-
ICISSP 2023 - 9th International Conference on Information Systems Security and Privacy
122

ground noise, which could make the side channel in-
feasible, or at least far more difficult to interpret.
We have performed initial testing with some back-
ground noise conditions, and the results are visually
quite similar to the ideal case. However, a far more
extensive exploration should be done before draw-
ing any conclusions about the effectiveness of this
side channel in a typical enterprise computing envi-
ronment with multiple servers running. To explore
this further, we intend to repeat similar experiments
with various tasks running in the background on vir-
tual machines on other servers. By steadily increasing
the background noise during the experiment, we can
identify at what point the side channel becomes sig-
nificantly noisier, or altogether infeasible.
5.2 Covert Channel
Related to side channel investigations, future work
could also explore the viability of creating a covert
communication channel via power analysis. Given
the experimental results achieved so far, it is possi-
ble that information could be encoded using the high
and low states seen in the spectrogram. With an ap-
propriate encoding scheme, a relatively efficient sys-
tem could be designed to covertly transmit informa-
tion by modulating the power consumption such that
the high and low states represent binary data. The
communication rate could be enhanced by using a
ternary encoding scheme, where the power consump-
tion is modulated between three states, corresponding
to: idle, 50%, and 100% CPU utilization. While we
did perform some testing of this idea (as seen in figure
6), we intend to design further experiments, and in-
vestigate encoding schemes and data processing tech-
niques for extracting information from the signal, in
order to more thoroughly investigate the viability of
the concept.
REFERENCES
Chen, K.-Y., Cohn, G. A., Gupta, S., and Patel, S. N. (2013).
utouch: sensing touch gestures on unmodified lcds.
In Proceedings of the SIGCHI Conference on Human
Factors in Computing Systems, pages 2581–2584.
Enev, M., Gupta, S., Kohno, T., and Patel, S. N. (2011).
Televisions, video privacy, and powerline electromag-
netic interference. In Proceedings of the 18th ACM
conference on Computer and communications secu-
rity, pages 537–550.
Golder, A., Das, D., Danial, J., Ghosh, S., Sen, S., and Ray-
chowdhury, A. (2019). Practical approaches toward
deep-learning-based cross-device power side-channel
attack. IEEE Transactions on Very Large Scale Inte-
gration (VLSI) Systems, 27(12):2720–2733.
Gupta, S., Chen, K.-Y., Reynolds, M. S., and Patel, S. N.
(2011). Lightwave: using compact fluorescent lights
as sensors. In Proceedings of the 13th international
conference on Ubiquitous computing, pages 65–74.
Gupta, S., Reynolds, M. S., and Patel, S. N. (2010). Elec-
trisense: Single-point sensing using emi for electri-
cal event detection and classification in the home. In
Proceedings of the 12th ACM International Confer-
ence on Ubiquitous Computing, UbiComp ’10, page
139–148, New York, NY, USA. Association for Com-
puting Machinery.
Harris, C. R., Millman, K. J., van der Walt, S. J., Gommers,
R., Virtanen, P., Cournapeau, D., Wieser, E., Taylor,
J., Berg, S., Smith, N. J., Kern, R., Picus, M., Hoyer,
S., van Kerkwijk, M. H., Brett, M., Haldane, A., del
R
´
ıo, J. F., Wiebe, M., Peterson, P., G
´
erard-Marchant,
P., Sheppard, K., Reddy, T., Weckesser, W., Abbasi,
H., Gohlke, C., and Oliphant, T. E. (2020). Array pro-
gramming with NumPy. Nature, 585(7825):357–362.
Hunter, J. D. (2007). Matplotlib: A 2d graphics environ-
ment. Computing in Science & Engineering, 9(3):90–
95.
Khan, H. A., Sehatbakhsh, N., Nguyen, L. N., Prvulovic,
M., and Zaji
´
c, A. (2019). Malware detection in em-
bedded systems using neural network model for elec-
tromagnetic side-channel signals. Journal of Hard-
ware and Systems Security, 3(4):305–318.
Kocher, P., Jaffe, J., and Jun, B. (1999). Differential power
analysis. In Wiener, M., editor, Advances in Cryptol-
ogy — CRYPTO’ 99, pages 388–397, Berlin, Heidel-
berg. Springer Berlin Heidelberg.
Lipp, M., Kogler, A., Oswald, D., Schwarz, M., Easdon,
C., Canella, C., and Gruss, D. (2021). Platypus:
Software-based power side-channel attacks on x86. In
2021 IEEE Symposium on Security and Privacy (SP),
pages 355–371.
McFee, B., Raffel, C., Liang, D., Ellis, D. P. W., McVicar,
M., Battenberg, E., and Nieto, O. (2015). librosa: Au-
dio and music signal analysis in python.
Patel, S. N., Robertson, T., Kientz, J. A., Reynolds, M. S.,
and Abowd, G. D. (2007). At the flick of a switch: De-
tecting and classifying unique electrical events on the
residential power line (nominated for the best paper
award). In International Conference on Ubiquitous
Computing, pages 271–288. Springer.
Szefer, J. (2019). Survey of microarchitectural side and
covert channels, attacks, and defenses. Journal of
Hardware and Systems Security, 3(3):219–234.
Taylor, M. A., Larson, E. C., and Thornton, M. A. (2021).
Rapid ransomware detection through side channel ex-
ploitation. In 2021 IEEE International Conference on
Cyber Security and Resilience (CSR), pages 47–54.
Data Leakage in Isolated Virtualized Enterprise Computing Systems
123
