
GediNETPro: Discovering Patterns of Disease Groups
Emma Qumsiyeh
1a
, Miray Unlu Yazıcı
2b
and Malik Yousef
3,4 c
1
Department of Information Technology Engineering, Al-Quds University, Palestine
2
Department of Bioengineering, Faculty of Engineering, Abdullah Gül University, Kayseri, Turkey
3
Department of Information Systems, Zefat Academic College, Zefat, 13206, Israel
4
Galilee Digital Health Research Center (GDH), Zefat Academic College, Israel
Keywords: Biological Integrative Approach, Machine Learning, Disease-Disease Association, Grouping, Scoring,
Modeling, Cross-Validation, K-means, Heatmap, Breast Cancer, Biomarkers.
Abstract: The GediNET tool is based on the Grouping, Scoring, Modeling (G-S-M) approach for detecting disease-
disease association (DDA). In this study, we have developed the pro version, GediNETPro, that utilizes the
Cross-Validation (CV) information to detect patterns of disease groups association by applying clustering
approaches, such as K-means, extracted from the groups' ranks over the CV iterations. Additionally, a cluster
score is computed to measure its significance to provide a deep analysis of the output of GediNET, yielding
new biological knowledge that GediNET did not detect. Further, GediNETPro utilizes a visualization
approach, such as a heatmap, to get novel insights and in-depth analysis of the disease groups clusters
revealing the relationship between diseases that might be used for developing effective interventions for
diagnosing. We have tested GediNETPro on the Breast cancer dataset downloaded from the TCGA database.
Results showed deeper insight into the interaction and collective behavior of the DDA, facilitating the
identification and association of potential biomarkers.
1 INTRODUCTION
A significant challenge in the field of bioinformatics
has been found lately in discovering novel disease-
disease associations (DDA). Such a challenge is due
to the heterogeneity of available molecular data that
does not sufficiently support this discovery
(Suratanee & Plaimas, 2015). Small efforts have been
made in this era; thus, more research is needed for
DDA detection. Revealing novel DDA can contribute
to discovering relationships between diseases and
provide opportunities for early diagnosis and
prognosis of diseases (Žitnik et al., 2013).
Considerable efforts have been made to design
comprehensive frameworks to understand the
complex association of targeted diseases. Most of the
advanced tools based on feature selection applied to
gene expression data implement machine learning
and statistical approaches. Biological knowledge is
utilized to identify meaningful relationships between
diseases.
a
https://orcid.org/0000-0002-3797-5851
b
https://orcid.org/0000-0001-8165-6164
c
https://orcid.org/0000-0001-8780-6303
This knowledge can be obtained from various
biological databases such as DisGeNET(Piñero et
al., 2017), OMIM (Hamosh et al., 2000), and
eDGAR (Babbi et al., 2017). Such knowledge-
integrated methods shifted the pure data-oriented
approaches into integrative ones.
Analyzing RNA-seq profiling data while
combining pre-existing biological knowledge has
leveraged the traditional clustering, and machine
learning approaches into knowledge-based
integrative systems. Different integrative tools have
adapted the Grouping-Scoring-Modeling (G-S-M)
approach for integrated biological knowledge
through different computation tools such as SVM-
RCE (Yousef, Bakir-Gungor, et al., 2020; Yousef et
al., 2007; Yousef, Jabeer, et al., 2021), SVM-RNE
(Yousef et al., 2009), maTE (Yousef et al., 2019),
CogNet (Yousef, Ülgen, et al., 2021), mirCorrNet
(Yousef, Goy, et al., 2021), miRModuleNet (Yousef
et al., 2022), integrating Gene Ontology (Yousef,
Sayıcı, et al., 2021). Furthermore, a comprehensive
Qumsiyeh, E., Yazıcı, M. and Yousef, M.
GediNETPro: Discovering Patterns of Disease Groups.
DOI: 10.5220/0011690800003414
In Proceedings of the 16th International Joint Conference on Biomedical Engineering Systems and Technologies (BIOSTEC 2023) - Volume 3: BIOINFORMATICS, pages 195-203
ISBN: 978-989-758-631-6; ISSN: 2184-4305
Copyright
c
2023 by SCITEPRESS – Science and Technology Publications, Lda. Under CC license (CC BY-NC-ND 4.0)
195

review of G-S-M approaches is proposed by
(Yousef, Kumar, et al., 2020). A similar tool,
TextNetTopics, details the in-text mining-centered
G-S-M approach (Yousef & Voskergian, 2022).
We have developed GediNETPro to extract
hidden biological knowledge by detecting co-
occurrence patterns of groups (disease groups) by
visualizing the tool's output. Insights are better attained
when transforming the cumulative tables into figures
and heatmaps where biological interpretations are
easily explained. The main functionality of the new
GediNETPro is to analyze the group frequency
distribution over each rank to elucidate the collective
behavior of the BRCA mechanism.
2 METHODS
2.1 Dataset
The gene expression dataset used in this study is the
Breast Invasive Carcinoma (BRCA) downloaded
from the Cancer Genome Atlas (TCGA cancer). The
dataset is available from the National Cancer Institute
on the GDS data portal (Tomczak et al., 2015).
Luminal A, Luminal B, HER2-enriched, and Basal-
like intrinsic subtypes, provided by the study of
(Missori et al., 2020). The data consist of two classes
of samples: pos (positive class) and neg (negative
class). The number of pos samples is 302, whereas
neg samples are 247. The gene expression raw counts
were downloaded and normalized using the Trimmed
Mean of M-values method (TMM) implemented by
the edgeR Bioconductor package (Robinson et al.,
2010). The number of genes is 21839.
In our study, we refer to a specific disease group
as a set of genes associated with this disease. The pre-
existing biological knowledge hosted in the database
DisGeNET version 7.0, including 3241576 gene-
disease associations, was downloaded from (Piñero et
al., 2017). The total number of group diseases is
30,170. We filtered cancer-related associations
considering the cases by the Neoplastic processes.
The filtered data include 22,690 gene-disease
associations of 2200 different groups of diseases
(named as groups). The groups are scored by the S
component over 100 iterations.
2.2 GediNETPro
In the field of Machine Learning, one is required to
evaluate the model created after training the
classifier. Different approaches for evaluating the
performance are used, such as k-fold cross-
validations, repeated k-fold, and leave-one-out
(Wong, 2015).
Monte Carlo Cross-Validation (MCCV), also
known as a repeated random sub-sampling CV, is a
consistent method to split the dataset into training and
testing parts. As the name suggests, it randomly
chooses the percentage of each split in each iteration,
meaning no defined percentage of the dataset is left
out in each iteration. MCCV is preferred over leave-
one-out CV as the splits' proportion is independent of
the number of iterations which avoids the cause of
over-fitting in prediction (Xu & Liang, 2001).
To perform the MCCV, first, the dataset is
randomly split into training and testing parts. In each
iteration, the percentage of splits is different; for
example, it might be 80% training and 20% testing or
75% training and 25 % testing. Some data splits are
never selected in training, and others are chosen more
than once. Second, the model is computed by fitting
the ML using the training part, and the model's
performance is evaluated with the testing dataset. The
performance metrics are calculated through cross-
validation iterations.
Our recently developed integrative machine
learning-based tool GediNET(Yousef & Qumsiyeh,
2022), detects disease-disease association and gene
biomarkers for the disease under study. The tool
based on the G-S-M approach initially incorporates
gene-disease associations from the DisGeNET
database (Piñero et al., 2017). Each group has a
unique disease name and associated genes with the
disease. Further, the task of the S component is to
compute a score that measures to what extent it is
differentially expressed considering the given two
classes. This is performed after training each group
with its associated sub_data using a Random Forest
(RF) classifier. The GediNET tool was implemented
in KNIME (Berthold et al., 2008).
GediNET provides a unique output of a list of
groups ranked by a score, while the traditional
approach output is a list of genes ranked by a score.
Additionally, it provides a relationship between the
top detected significant disease groups among those
groups and their association with the main disease
under study. Besides, in the original version of
GediNET, a Monte Carlo CV (MCCV) is applied to
estimate the tool's performance. We have applied 100
iterations of splitting the data into training and testing,
where 90% of the data is used for training the
classifier (the M component). While the remaining
10% is used for testing to evaluate its performance.
The aggregation of all those splits is collected while
the means and standard deviations are reported for
each performance measurement. However, the tool
BIOINFORMATICS 2023 - 14th International Conference on Bioinformatics Models, Methods and Algorithms
196
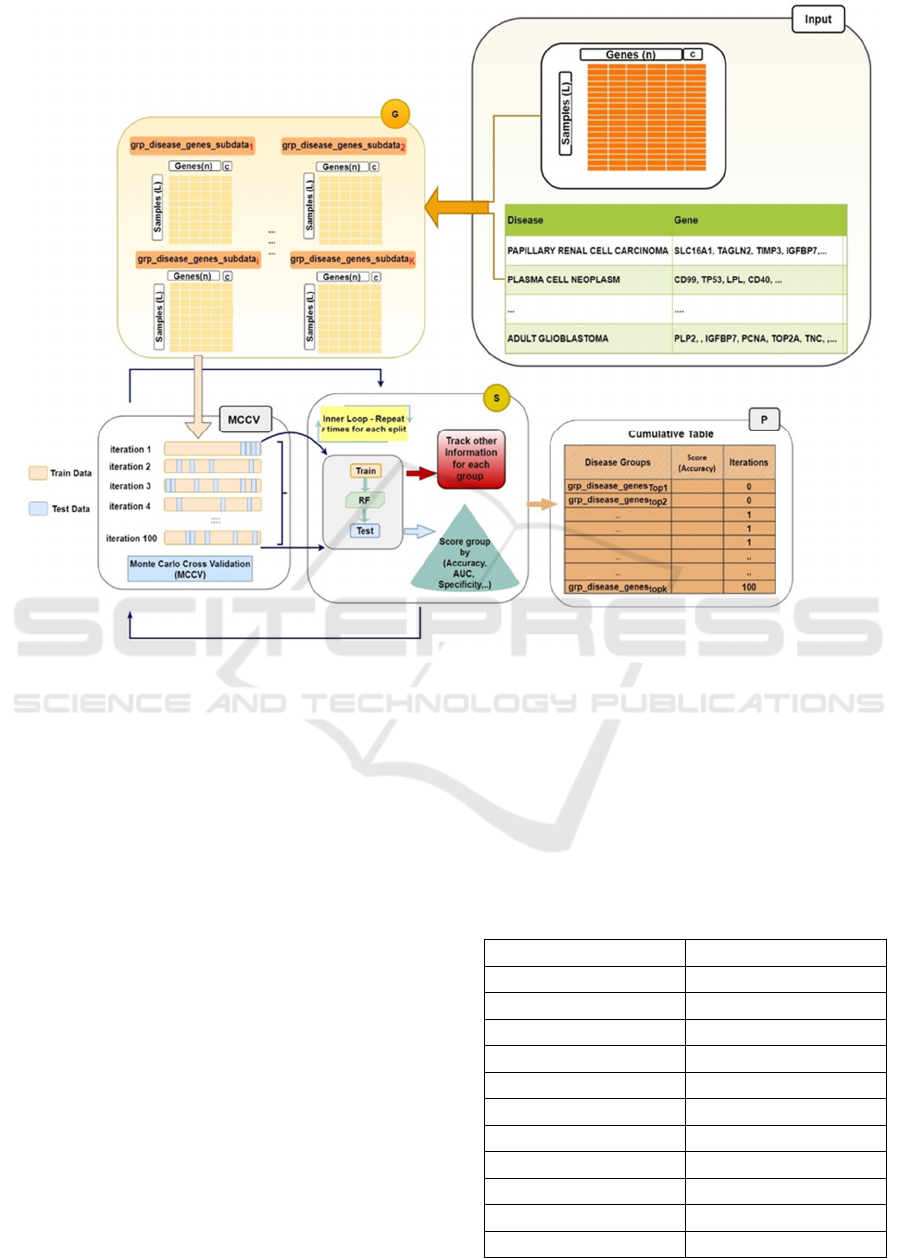
Figure 1: Illustration of the GediNETPro. The input panel contains the gene expression data and the grouping table.
Component G creates the sub_datasets based on the Input panel. The MCCV panel uses the S component to perform the
looping. The P component tracks the output of MCVV and S to be stored as a cumulative table.
did not exploit the knowledge that can be extracted
from the MCCV iterations. Therefore, we have
developed a new component, P, to extract the hidden
patterns in MCCV using the new pro version. Figure
1 illustrates the GediNETPro version that utilizes the
MCCV to reveal hidden patterns and additional
biological knowledge.
The "Input" panel in Figure 1 contains the two-
class gene expression table and the grouping table.
Both tables will serve as input to the G component.
The G component creates for each disease group its
related two-class sub_datasets (G panel, Figure 1) by
extracting the related columns (genes) from the
original data with the class label (the c column in G
panel, Figure 1) based on the Input panel. The
"MCCV" panel cooperates with the S component to
perform looping of r iterations. The P component
collects cumulative information from each disease
group, including gene sets, scores, and ranks. All the
information is collected under the "Cumulative
Table" in Figure 1, P component, whereas the
"Cumulative Table" is summarized (See an example
in Table 4). In the current version, we have redefined
the rank according to Table 1, utilizing the score
(accuracy) computed by the S component (See Figure
1).
This way of ranks allows us to explore the patterns
of the groups in more depth.
Table 1: The Rank scale is based on the score values.
Rank Score, ACC
1 >0.95
2 [0.90 -0.95)
3 [0.85-0.9)
4 [0.8-0.85)
5 [0.75-0.8)
6 [0.7-0.75)
7 [0.65-0.7)
8 [0.6-0.65)
9 [0.55-0.6)
10 <0.55
11 Absent of group
GediNETPro: Discovering Patterns of Disease Groups
197
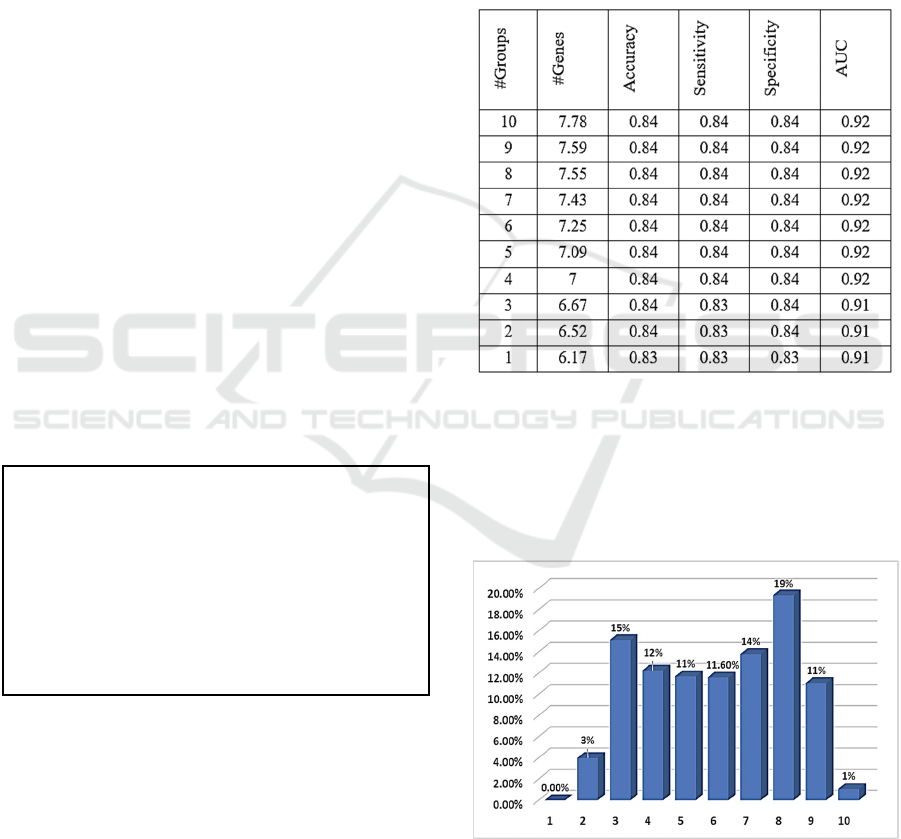
Table 1 shows that the value of 11 are assigned to
the group that failed to extract its associated
subdataset due to filtering out genes with low signal.
2.3 P Component: Detect Patterns of
Diseases Associations
Let's assume we have m groups of diseases. The S
component assigns each group a score and a rank over
the r iterations (We have set r to be 100). As a result,
a matrix R with m rows and 100 columns is
computed, where each row represents one disease
group and the columns are the iterations ranks. R(i,j)
is the rank assigned by the S component for group i
in iteration j. Table 4 is an example of such output,
where the ranks are stored in the column "Ranks list."
Let Rp be row p of matrix R representing all rank
values over the 100 iterations. Each Rp is a point in
100 dimensions. One way to detect patterns of group
ranks is by computing the similarity between Rp, p=
1,...,m. Clusters of those rows (points) would serve to
find associations between diseases (groups). We have
used K-means to detect such clusters. Then for each
cluster, a cluster score is assigned by averaging all the
scores of its members. We have used K-means that
estimate the number of clusters. The cluster with the
least value is the most significant cluster that contains
the top-ranked groups. The pseudocode of the new P
component is presented in Table 2.
Table 2: Pseudocode for detecting patterns of ranks of
disease groups over 100 iterations.
P component
R is the diseases group ranks matrix over 100 iterations
Let k be the estimated number of clusters over R
clusters = K-means (R,k) //Apply clustering approach
for i = 1 to k
c_score{i} = mean (clusters{i}) //compute the
average ranks of each cluster
sort
(
c
_
score, “increasin
g
order”
)
We have implemented the P component in Knime
(Berthold et al., 2008) using H2O.ai. H2O k-means
node has the option of estimating the number of
clusters that were used in P.
3 RESULTS
GediNETPro is executed on the BRCA-TCGA data
with 100-fold MCCV. The performance measures of
accuracy, sensitivity, specificity, and AUC are
reported in Table 3. The performance of the top-10
ranked groups is cumulatively presented in Table 3.
The last row presents the results of Group number 1,
the top-ranked cumulative group, with an AUC of
0.91, specificity of 0.83, the sensitivity of 0.83, and
accuracy of 0.83, obtained by an average of 6.17
genes. The last second row, Group number 2, presents
the performance results of the top cumulatively two
groups.
Table 3: The average 100 MCCV performance metrics table
of GediNETPro for the top-ranked 10 groups.
As seen from Table 3 no improvement in the AUC
after the level of 4 accumulative groups. However,
the user might be interested to examine more than 4
top groups to explore the association between disease
groups. Since there is no change in the value of AUC,
one might use this level as the optimal threshold of
the number of groups.
Figure 2: The frequency of the groups ranks over all the
iterations.
Figure 2. shows that none of the disease groups (1
out of 207, 565) reaches the highest rank of 1, which
BIOINFORMATICS 2023 - 14th International Conference on Bioinformatics Models, Methods and Algorithms
198
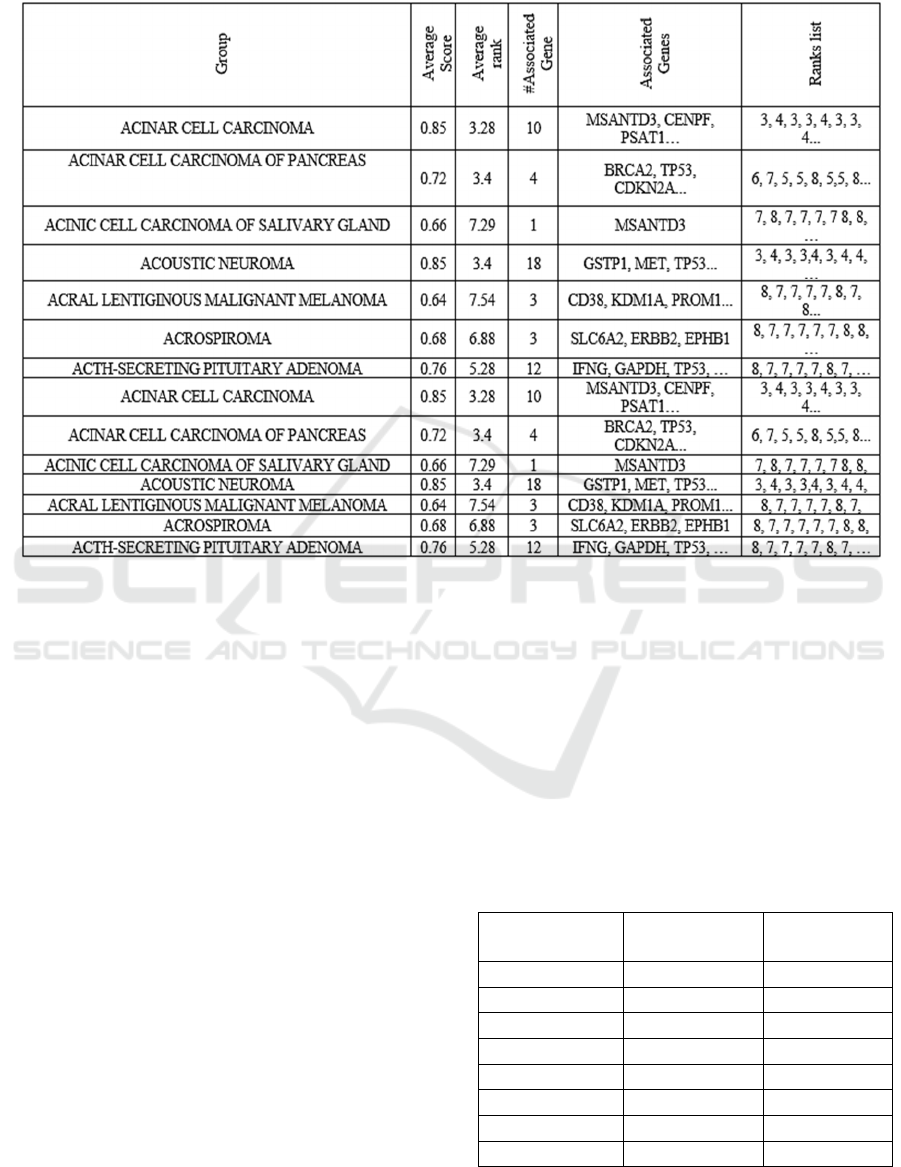
Table 4: CumulativeTable of GediNETPro analysis of the molecular subtype datasets of BRCA. The table summarizes
frequency, average score and rank, number of associated genes, and corresponding gene list over 100 iterations.
impacts the performance of GediNETPro to have an
accuracy of about 84%, as shown in Table 3. We also
have seen that about 50% of the groups are ranked
above the average in the range [1-6]. However,
researchers would be interested mainly in the groups
that are highly ranked. We might consider the range
[1-4] for that purpose. Moreover, just 1% of the
groups ranked with the lowest rank of 10. This is the
impact of the filter step we applied using the statistics
t-test, as explained in more detail in (Qumsiyeh et al.,
2022).
Table 4 is an example of a "Cumulative Table"
that appears in Figure 1, with summary statistics. The
average score and rank over the 100 iterations for
each disease group are calculated in the S component
(S panel, Figure 1) and presented correspondingly
under the "Average Score" and "Average Rank"
columns. The number of associated genes for each
disease group and their unique associated genes are
listed in the "#Associated Gene" and "Associated
Genes" columns, respectively.
3.1 Detect Clusters of Groups by P
Component
The output creates 2414 groups, thus a rank matrix R
with dimensions of 2414 rows and 100 columns.
Applying the P component detects 8 clusters of
groups while the top-ranked cluster gets the score of
2.79, which has 316 disease groups, as illustrated in
Table 5. All the disease groups belonging to cluster_0
have similar high ranks over the iteration.
Table 5: The summary output of component P describes 8
detected clusters of disease groups.
Cluster name Number of
Groups
Group Score
cluster_0 316 2.79
cluster_1 379 3.73
cluster_2 257 4.76
cluster_3 498 5.83
cluster_4 279 6.72
cluster_5 247 7.56
cluster_6 218 8.47
cluster_7 220 10.61
GediNETPro: Discovering Patterns of Disease Groups
199

Table 6: The top 10 ranked disease groups detected by
component P.
Disease Group Name Score
ADENOMA_OF_LARGE_INTESTINE 2.29
MALIGNANT_GLIOMA 2.3
CONVENTIONAL_(CLEAR_CELL)_RENA
L_CELL_CARCINOMA
2.3
PAPILLARY_THYROID_CARCINOMA 2.31
MALIGNANT_NEOPLASM_OF_THYROID 2.31
ASTROCYTOMA 2.33
NON-SMALL_CELL_LUNG_CARCINOMA 2.33
SECONDARY_MALIGNANT_NEOPLASM
_OF_LYMPH_NODE
2.35
EPITHELIAL_OVARIAN_CANCER 2.36
CARCINOMA_OF_URINARY_BLADDER,_
INVASIVE
2.36
Table 6 shows the top-ranked 10 disease groups
that belong to cluster_0 with their score, as suggested
in the pseudocode to be the mean of all the ranks over
the 100 iterations.
3.2 Detect Clusters of Group by
Visualization
One of the outputs of GediNETPro is the heatmap in
Figure 3, which illustrates the clusters of diseases
over the 100 iterations. Random groups of diseases
with their average rank and iteration information are
visualized in the heatmap Figure 3. The rank scale is
also apparent in Figure 3. The top-ranked groups are
colored dark red, whereas low-ranked groups rarely
detected within the 100 iterations are colored blue and
dark purple. Therefore, while analyzing the heatmap,
significant diseases that have red color are essential
to be analyzed. Once analyzed, new information
would reveal hidden patterns with new biological
meanings. For example, as seen in Figure 3, the
MALIGNANT NEOPLASM OF GALLBLADDER
and MALIGNANT NEOPLASM OF STOMACH
co-occurred with a very high rank. Thus, these two
diseases might be associated with the BRCA disease.
Moreover, for validation, according to the
literature, we have found a strong connection between
the two diseases and BRCA. Missori, Giulia, et al.
(Missori et al., 2020) have reported that breast
cancer's potential development of secondary
malignant growth within gallbladder tissues is very
high. The growth of small flat nodules on the inner
surface of the gallbladder mucous cells for patients
with breast cancer is also expected. Their findings
reported the significance of carefully examining the
Gallbladder postoperatively for older patients with
breast cancer. They also confirmed a high risk of
getting Gallbladder cancer from Stomach cancer.
From Figure 3, HEREDITARY NON-
POLYPOSIS COLON CANCER TYPE 2 AND
HYPERPLASTIC POLYP diseases are two
complementary pairs. This means that when one
group appears highly ranked in a specific iteration,
the second complementary one appears with a lower
rank. This is true for these two disease groups over
the 100 iterations.
Furthermore, Figure 3 shows 6 significant disease
groups that are highly ranked and appear in all
iterations. These groups are MALIGNANT
NEOPLASM OF GALLBLADDER, MALIGNANT
NEOPLASM OF STOMACH, NON-SMALL CELL
LUNG CARCINOMA, RENAL CARCINOMA,
THYROID NEOPLASM AND TRANSITIONAL
CELL CARCINOMA OF BLADDER. Their average
rank is reported to be 3.01, 2.41, 2.33, 2.66, 2.38, and
2.74, respectively. Such behaviour invites and
suggests more investigations are needed to find
hidden patterns and possible correlations between
these diseases and BRCA at the molecular-basis cell
level.
The low ranks, such as 9 and 10, would also
provide biological knowledge. For example, Figure 3
shows that the disease WELL DIFFERENTIATED
HEPATOCELLULAR CARCINOMA was scored all
over the iterations with a very low rank, suggesting
that this disease is not associated with the BRCA
disease.
The S component assigns each group a score,
which is also assigned to the genes that are members
of this group. Thus, in the end, we will also have
information about the ranks of the genes. The
RobustRankAggreg (Kolde et al., 2012) is applied on
those 100 lists to assign a p-value for each gene. For
visualization, genes that are less than 5 times
appearing out of 100 iterations are filtered out genes
with a p-value less than 0.05 are selected. Then we
selected 50 genes randomly that are presented in
Figure 4 as a heatmap. Figure 4 shows that most of
those genes belong to groups that are also highly
ranked.
BIOINFORMATICS 2023 - 14th International Conference on Bioinformatics Models, Methods and Algorithms
200
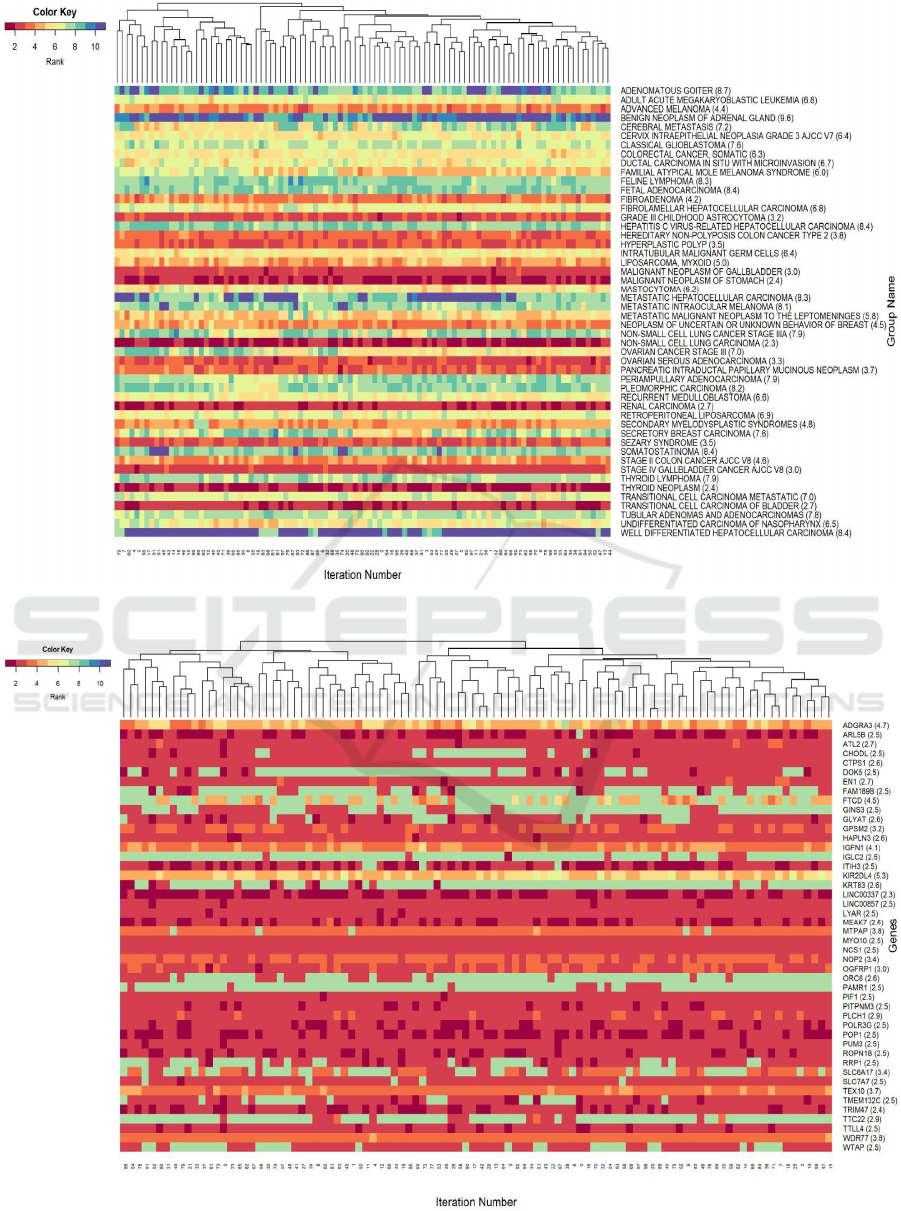
Figure 3: Heatmap of groups with rank information over 100 iterations.
Figure 4: Heat map of the genes ranks over iterations.
GediNETPro: Discovering Patterns of Disease Groups
201

4 CONCLUSIONS
In this study, we have described the GediNETPro
based on four components: the three components G,
S, and M, inherited from GediNET with a new
component, P. The new component P detect clusters
or patterns of disease groups based on their rank
values assigned by the S component. A new cluster-
score is computed to detect the most significant
cluster of groups. Traditional approaches mainly use
CV or other cross-validation techniques to evaluate
performance measurements. However, GediNETPro
utilizes the ranks or scores all over the iterations to be
used in the P component to detect hidden patterns of
the group's ranks. We hypothesize that disease groups
that share the same cluster might have similar
biological functions. This should be validated as
future work. Using heatmaps to visualize the data
allowed us to detect patterns that would shed light on
additional biological knowledge of the output.
ACKNOWLEDGEMENTS
The work of M.Y. has been supported by the Zefat
Academic College.
REFERENCES
Aiello, S., Click, C., Roark, H., Rehak, L., & Lanford, J.
(n.d.). Machine Learning with Python and H2O.
Babbi, G., Martelli, P. L., Profiti, G., Bovo, S., Savojardo,
C., & Casadio, R. (2017). eDGAR: A database of
Disease-Gene Associations with annotated
Relationships among genes. BMC Genomics, 18(5),
554. https://doi.org/10.1186/s12864-017-3911-3
Berthold, M. R., Cebron, N., Dill, F., Gabriel, T. R., Kötter,
T., Meinl, T., Ohl, P., Sieb, C., Thiel, K., & Wiswedel,
B. (2008). KNIME: The Konstanz Information Miner.
In C. Preisach, H. Burkhardt, L. Schmidt-Thieme, & R.
Decker (Eds.), Data Analysis, Machine Learning and
Applications (pp. 319–326). Springer.
https://doi.org/10.1007/978-3-540-78246-9_38
Hamosh, A., Scott, A. F., Amberger, J., Valle, D., &
McKusick, V. A. (2000). Online Mendelian Inheritance
in Man (OMIM). Human Mutation, 15(1), 57–61.
https://doi.org/10.1002/(SICI)1098-
1004(200001)15:1<57::AID-HUMU12>3.0.CO;2-G
Kolde, R., Laur, S., Adler, P., & Vilo, J. (2012). Robust
rank aggregation for gene list integration and meta-
analysis. Bioinformatics, 28(4), 573–580.
https://doi.org/10.1093/bioinformatics/btr709
Missori, G., Serra, F., Prestigiacomo, G., Ricciardolo, A.
A., Brugioni, L., & Gelmini, R. (2020). Case Report:
Metastatic breast cancer to the gallbladder.
F1000Research, 9, 343. https://doi.org/10.12688/f1000
research.23469.1
Piñero, J., Bravo, À., Queralt-Rosinach, N., Gutiérrez-
Sacristán, A., Deu-Pons, J., Centeno, E., García-García,
J., Sanz, F., & Furlong, L. I. (2017). DisGeNET: A
comprehensive platform integrating information on
human disease-associated genes and variants. Nucleic
Acids Research, 45(D1), D833–D839.
https://doi.org/10.1093/nar/gkw943
Qumsiyeh, E., Showe, L., & Yousef, M. (2022). GediNET
for discovering gene associations across diseases using
knowledge based machine learning approach. Scientific
Reports, 12(1), Article 1. https://doi.org/10.1038/
s41598-022-24421-0
Robinson, M. D., McCarthy, D. J., & Smyth, G. K. (2010).
edgeR: A Bioconductor package for differential
expression analysis of digital gene expression data.
Bioinformatics (Oxford, England), 26(1), 139–140.
https://doi.org/10.1093/bioinformatics/btp616
Suratanee, A., & Plaimas, K. (2015). DDA: A Novel
Network-Based Scoring Method to Identify Disease-
Disease Associations. Bioinformatics and Biology
Insights, 9, BBI.S35237. https://doi.org/10.4137/BB
I.S35237
Tomczak, K., Czerwińska, P., & Wiznerowicz, M. (2015).
The Cancer Genome Atlas (TCGA): An immeasurable
source of knowledge. Contemporary Oncology,
19(1A), A68–A77. https://doi.org/10.5114/wo.2014.47
136
Wong, T.-T. (2015). Performance evaluation of
classification algorithms by k-fold and leave-one-out
cross validation. Pattern Recognition, 48(9), 2839–
2846. https://doi.org/10.1016/j.patcog.2015.03.009
Xu, Q.-S., & Liang, Y.-Z. (2001). Monte Carlo cross
validation. Chemometrics and Intelligent Laboratory
Systems, 56(1), 1–11. https://doi.org/10.1016/S0169-
7439(00)00122-2
Yousef, M., Abdallah, L., & Allmer, J. (2019). maTE:
Discovering expressed interactions between
microRNAs and their targets. Bioinformatics, 35(20),
4020–4028.
https://doi.org/10.1093/bioinformatics/btz204
Yousef, M., Bakir-Gungor, B., Jabeer, A., Goy, G.,
Qureshi, R., & C Showe, L. (2020). Recursive Cluster
Elimination based Rank Function (SVM-RCE-R)
implemented in KNIME. F1000Research, 9, 1255.
https://doi.org/10.12688/f1000research.26880.2
Yousef, M., Goy, G., & Bakir-Gungor, B. (2022).
miRModuleNet: Detecting miRNA-mRNA Regulatory
Modules. Frontiers in Genetics, 13, 767455.
https://doi.org/10.3389/fgene.2022.767455
Yousef, M., Goy, G., Mitra, R., Eischen, C. M., Jabeer, A.,
& Bakir-Gungor, B. (2021). miRcorrNet: Machine
learning-based integration of miRNA and mRNA
expression profiles, combined with feature grouping
and ranking. PeerJ, 9, e11458. https://doi.org/
10.7717/peerj.11458
Yousef, M., Jabeer, A., & Bakir-Gungor, B. (2021). SVM-
RCE-R-OPT: Optimization of Scoring Function for
SVM-RCE-R. In G. Kotsis, A. M. Tjoa, I. Khalil, B.
BIOINFORMATICS 2023 - 14th International Conference on Bioinformatics Models, Methods and Algorithms
202

Moser, A. Mashkoor, J. Sametinger, A. Fensel, J.
Martinez-Gil, L. Fischer, G. Czech, F. Sobieczky, & S.
Khan (Eds.), Database and Expert Systems
Applications—DEXA 2021 Workshops (pp. 215–224).
Springer International Publishing. https://doi.org/
10.1007/978-3-030-87101-7_21
Yousef, M., Jung, S., Showe, L. C., & Showe, M. K. (2007).
Recursive Cluster Elimination (RCE) for classification
and feature selection from gene expression data. BMC
Bioinformatics, 8(1), 144. https://doi.org/10.1186/14
71-2105-8-144
Yousef, M., Ketany, M., Manevitz, L., Showe, L. C., &
Showe, M. K. (2009). Classification and biomarker
identification using gene network modules and support
vector machines. BMC Bioinformatics, 10(1), 337.
https://doi.org/10.1186/1471-2105-10-337
Yousef, M., Kumar, A., & Bakir-Gungor, B. (2020).
Application of Biological Domain Knowledge Based
Feature Selection on Gene Expression Data. Entropy
(Basel, Switzerland), 23(1), E2. https://doi.org/10.33
90/e23010002
Yousef, M., & Qumsiyeh, E. (2022). GediNET- Discover
Disease-Disease Gene Associations utilizing
Knowledge-based Machine Learning [Preprint]. In
Review. https://doi.org/10.21203/rs.3.rs-1643219/v1
Yousef, M., Sayıcı, A., & Bakir-Gungor, B. (2021).
Integrating Gene Ontology Based Grouping and
Ranking into the Machine Learning Algorithm for Gene
Expression Data Analysis. In G. Kotsis, A. M. Tjoa, I.
Khalil, B. Moser, A. Mashkoor, J. Sametinger, A.
Fensel, J. Martinez-Gil, L. Fischer, G. Czech, F.
Sobieczky, & S. Khan (Eds.), Database and Expert
Systems Applications—DEXA 2021 Workshops (pp.
205–214). Springer International Publishing.
https://doi.org/10.1007/978-3-030-87101-7_20
Yousef, M., Ülgen, E., & Uğur Sezerman, O. (2021).
CogNet: Classification of gene expression data based
on ranked active-subnetwork-oriented KEGG pathway
enrichment analysis. PeerJ. Computer Science, 7, e336.
https://doi.org/10.7717/peerj-cs.336
Yousef, M., & Voskergian, D. (2022). TextNetTopics: Text
Classification Based Word Grouping as Topics and
Topics’ Scoring. Frontiers in Genetics, 13.
https://www.frontiersin.org/articles/10.3389/fgene.202
2.893378
Žitnik, M., Janjić, V., Larminie, C., Zupan, B., & Pržulj, N.
(2013). Discovering disease-disease associations by
fusing systems-level molecular data. Scientific Reports,
3(1), Article 1. https://doi.org/10.1038/srep03202
GediNETPro: Discovering Patterns of Disease Groups
203
