
On the Use of Generative Adversarial Networks to Predict Health Status
Among Chronic Patients
Mar
´
ıa Teresa Jurado-Camino
1 a
, David Chushig-Muzo
1 b
, Cristina Soguero-Ruiz
1 c
,
Pablo de Miguel Bohoyo
2 d
and Inmaculada Mora-Jim
´
enez
1 e
1
Dep. Signal Theory and Communications, Rey Juan Carlos University, Camino del Molino 5, Madrid, Spain
2
University Hospital of Fuenlabrada, Madrid, Spain
Keywords:
Data Augmentation, Imbalance Learning, Decision Trees, Clinical Codes, Chronic Diseases.
Abstract:
Chronic diseases (CD) are the leading cause of death worldwide, presenting higher mortality rates and eco-
nomic burden (both in the health and social context) as the complexity of the CD increases. The use of Elec-
tronic Health Records (EHRs) and Machine Learning (ML) contribute to significant progress in health domain
research, supporting identifying the patient’s health status for early interventions. Despite these achievements,
the class imbalance can limit the generalization capability of many ML models and data augmentation tech-
niques are proposed to face this limitation. In this work, a Generative Adversarial Network named medWGAN
is used to generate synthetic patients considering clinical data collected from EHRs linked to the University
Hospital of Fuenlabrada. Data are associated with patients diagnosed with both simple CD (diabetes, hyper-
tension, congestive heart failure, chronic obstructive pulmonary disease) and multiple CD. Experimental work
using decision trees as predictors to determine the patient’s health status showed the ability of medWGAN
for preserving the underlying (high-dimensional and sparse) clinical patterns. Our results indicate that the
identification of patients with multiple CD may benefit from the use of medWGAN as long as the data used
for its training is diverse enough, contributing to supporting clinical decision-making in complex scenarios
with many features.
1 INTRODUCTION
Several reports of the World Health Organization in-
dicate that chronic diseases (CDs) are the leading
cause of mortality worldwide, approximately reach-
ing 71% of the total of deaths annually (Budrevi-
ciute et al., 2020). CDs are characterized by a grad-
ual and slow progression, requiring a modification of
the patient’s lifestyle and continuous medical atten-
tion (Wagner and Brath, 2012). Among CDs, cardio-
vascular diseases, diabetes and lung diseases have be-
come the most significant ones (Budreviciute et al.,
2020) and health policies are seeking new strategies
to tackle them (Wagner and Brath, 2012).
The extensive adoption of electronic health
records (EHRs) has brought the opportunity to col-
a
https://orcid.org/0000-0002-5646-1290
b
https://orcid.org/0000-0001-5585-2305
c
https://orcid.org/0000-0001-5817-989X
d
https://orcid.org/0000-0001-5241-596X
e
https://orcid.org/0000-0003-0735-367X
lect data and design data-driven models to support
the early identification of patients at risk of suffering
from CDs. In particular, Machine Learning (ML) ap-
proaches have received great attention in recent years
to find hidden patterns in the data and extract knowl-
edge from large and heterogeneous datasets (Shameer
et al., 2018). Despite the great potential of ML, deal-
ing with class imbalance (CI) (He and Garcia, 2009),
which occurs when the number of instances is fairly
uneven across classes, may limit the success of the
resulting models. Since training of ML predictive
models seeks to minimize an empirical loss function,
learning is more focused on the samples of the ma-
jority class to the detriment of those in the minority
classes (He and Garcia, 2009).
Handling CI is a challenge in many practical
applications, with the health domain being one of
the most outstanding, since patients in the minor-
ity classes deserve special attention from a clini-
cal viewpoint. To tackle the CI problem, two main
paradigms are usually considered to construct a bal-
anced dataset (Ma and He, 2013). The first one con-
Jurado-Camino, M., Chushig-Muzo, D., Soguero-Ruiz, C., Bohoyo, P. and Mora-Jiménez, I.
On the Use of Generative Adversarial Networks to Predict Health Status Among Chronic Patients.
DOI: 10.5220/0011690500003414
In Proceedings of the 16th International Joint Conference on Biomedical Engineering Systems and Technologies (BIOSTEC 2023) - Volume 5: HEALTHINF, pages 167-178
ISBN: 978-989-758-631-6; ISSN: 2184-4305
Copyright
c
2023 by SCITEPRESS – Science and Technology Publications, Lda. Under CC license (CC BY-NC-ND 4.0)
167

siders undersampling methods, based on keeping all
samples from the minority class and discarding sam-
ples from the majority class. The main drawback of
using the undersampling paradigm is that the number
of samples (especially in the health domain) is usu-
ally quite reduced, and it is not convenient to lose
some of them. To avoid discarding samples, the over-
sampling paradigm (He and Garcia, 2009) generates
new (synthetic) samples for the minority classes. In
this line, the Synthetic Minority Oversampling Tech-
nique (SMOTE) (Chawla et al., 2002) is one of the
most used approaches because of its simplicity, since
it is based on a linear interpolation of samples in
the minority classes. Nevertheless, SMOTE does
not work properly with categorical features, since the
distance calculation and interpolation become chal-
lenging (Engelmann and Lessmann, 2021). In this
scenario, the techniques based on Generative Adver-
sarial Networks (GANs) emerge as a promising ap-
proach to generate synthetic data, often improving the
model’s performance in classification tasks and ad-
ditionally mitigating data privacy concerns (Creswell
et al., 2018). GANs have attracted attention both in
academia and industry due to their remarkable per-
formance when creating numerical data, specifically
in the computer vision field (Cao et al., 2018). How-
ever, their use for discrete and tabular data is still
limited (Zhang et al., 2020) and specific architectures
such as medWGAN (Baowaly et al., 2019) have been
proposed in the medical industry.
This paper studies the use of synthesized data us-
ing GAN-based models, specifically medWGAN, to
improve the generalization capabilities of nonpara-
metric predictive models in complex scenarios with
binary data. Specifically, we deal with a very limited
number of samples characterized by a high number of
binary features in a multi-class task. The study, which
considers real-world records associated with chronic
patients of the University Hospital of Fuenlabrada
(UHF) in Spain has been approved by the Ethics
Committee. To sum up, our work presents two main
contributions: (i) analyze augmented realistic data us-
ing GAN-based models, applied to chronic popula-
tions (including multimorbidity) and using both diag-
nosis and drug codes; and (ii) to analyze and assess
the performance of prediction models for CDs when
designed just with real patient data and when incor-
porating synthetic ones.
The rest of the paper is organized as follows. Sec-
tion 2 refers to the dataset description and the ex-
ploratory analysis. The ML methods considered in
this work, both for generating synthetic patient data
and for predictive analysis are shown in Section 3.
Section 4 details the experimental setup for gener-
ation and evaluation of the synthetic samples. The
predictive results for a multi-class scenario (including
complex health statuses) considering both real data
and a mixture of real and synthetic data in the model
design are presented in Section 5. Finally, the main
conclusions are shown in Section 6.
2 DATASET DESCRIPTION AND
EXPLORATORY ANALYSIS
Information about age, gender, and clinical data (di-
agnoses and drugs) were extracted from EHRs of
the UHF, linked to chronic patients with simple and
multiple CDs. Diagnoses were coded according to
the International Classification of Diseases, 9th Re-
vision, Clinical Modification (ICD9-CM) (American
Medical Association, 2004). Data associated with
drugs followed the Anatomical Therapeutic Chemi-
cal (ATC) Classification System (World Health Orga-
nization, 2006). The use of ICD9-CM and ATC codes
has been widely validated in many studies (Soguero-
Ruiz et al., 2020a), (Bouza et al., 2016), (Falhammar
et al., 2019).
Both ICD9-CM and ATC codes are composed of
a fixed number of alpha-numeric characters (ANCs)
hierarchically organized. The ICD9-CM codes have
from three to five ANCs, with a decimal point be-
tween the third and fourth ANC. The ATC codes
are identified by seven ANCs, structured in five
levels: (1) anatomical (first ANC), (2) therapeu-
tic (second-third ANCs), (3) pharmacological (fourth
ANC), (4) chemical (fifth ANC), and (5) chemical
substance (sixth-seventh ANCs). Similarly to prior
works (Chushig-Muzo et al., 2021), (Soguero-Ruiz
et al., 2020a), we reduced the detail of the clini-
cal codes by discarding the ANC after the decimal
point for ICD9-CM and the fifth level for ATC codes.
Hence, each patient is represented by 2263 binary
features, corresponding to 1517 ICD9-CM and 746
ATC codes. Each binary feature indicates the pres-
ence/absence of the corresponding code.
The population classification system named Clin-
ical Risk Groups (CRGs) (Hughes et al., 2004), inter-
nationally validated by the healthcare community in
different works (Finison et al., 2017), (Chong et al.,
2019), (Chushig-Muzo et al., 2022), has been used to
identify chronic patients. The CRG system consider
data of patient encounters with the health system (age,
gender, diagnoses, and pharmacological drugs) for a
limited period (usually one year) and assign every pa-
tient to just one group. The CRG system has a total
of 1080 health conditions (groups), each one identi-
fied by a five-digit number. The first digit indicates
HEALTHINF 2023 - 16th International Conference on Health Informatics
168

the core health group, directly linked to CDs (includ-
ing more than one simultaneous predominant condi-
tion). There are 9 core health groups: (1) healthy;
(2) history of the significant acute disease; (3) single
minor CD; (4) minor CDs in multiple organ systems;
(5) significant CD; (6) significant CDs in multiple or-
gan systems; (7) dominant CD in three or more or-
gan systems; (8) dominant malignancy; and (9) catas-
trophic. The first four digits in the CRG number indi-
cate the CRG health condition and are referred to as
base-CRG. The last digit indicates the severity level.
In this paper, we considered CRGs encompassing
patients with just one CD (core health group started
with 5). In particular, we consider the CRG-5179
(Congestive Heart Failure, CHF), the CRG-5192 (hy-
pertension, HT), and the CRG-5424 (diabetes, DIA).
To extend our analysis, individuals suffering from co-
occurring CDs have been also considered. Given the
importance of Chronic Obstructive Pulmonary Dis-
ease (COPD) and associated morbidities, we also in-
cluded it in this study, though there is no CRG group
identifying COPD as a single significant CD. Specifi-
cally, the examined CRGs with two co-occurring CDs
(those starting with the number 6) were CRG-6190
(CHF and COPD), CRG-6191 (CHF and DIA), CRG-
6313 (DIA and HT). Patients with co-occurring three
CDs have also been considered (core health status
started with 7), specifically CRG-7060 (CHF, DIA,
and COPD), CRG-7080 (CHF, DIA, and another CD)
and CRG-7081 (CHF, COPD, and another CD). It is
worth noting that the third CD considered in CRG-
7080 and CRG-7081 is not specified, with a poten-
tially wide range of CDs in the same base-CRG.
A summary of some statistics for each CRG is
shown in Table 1, with the number linked to the sever-
ity level indicated in the first column (between brack-
ets). Although demographic variables (gender and
age) are available, these were only used for character-
izing CRGs and were not used for data augmentation
or prediction purposes. Interestingly, note that as the
first digit of the CRG (core health status) increases,
the number of patients decreases, and the average age
increases. Due to the high imbalance in the number
of patients per base-CRG, we analyze the number of
patients per severity level (four possible severity lev-
els) for the CRG-5192, CRG-5424, and CRG-6313,
which are the base-CRGs with the highest number of
patients. We checked: (i) the imbalance in the size of
the CRGs when considering the severity level; and
(ii) the results obtained by training two GANs per
base-CRG (one for generating synthetic samples with
severity level 1, and the another one for generating
samples with severity levels 2, 3 and 4).
To gain knowledge of the most prevalent clini-
Table 1: Statistics of the considered base-CRG (first col-
umn, with severity level in brackets): number of patients, #
women, and age (mean±std).
base-CRG # patients % women age (mean ± std)
5179 141 31.2 68.7 ± 14.2
5192(1) 7761 47.7 55.6 ± 12.0
5192(2) 1424 54.0 56.5 ± 11.2
5192(3) 100 39.0 60.1 ± 12.1
5192(4) 39 33.3 54.6 ± 9.6
5424(1) 1160 33.1 52.1 ± 12.0
5424(2) 506 36.4 40.9 ± 18.8
5424(3) 38 50.0 41.9 ± 20.4
5424(4) 5 20.0 48.4 ± 16.4
6190 102 54.9 77.7 ± 11.8
6191 131 32.8 71.7 ± 11.2
6313(1) 2123 36.9 60.5 ± 10.5
6313(2) 1337 42.7 62.4 ± 11.1
6313(3) 287 63.0 62.7 ± 11.1
6313(4) 55 58.2 62.9 ± 10.4
7060 159 57.9 75.4 ± 11.1
7080 99 61.6 72.7 ± 12.3
7081 188 49.0 79.2 ± 11.8
cal codes associated with each CRG, we obtain the
corresponding diagnosis and drug profile (Soguero-
Ruiz et al., 2020a), (Chushig-Muzo et al., 2021).
Since several CRGs are considered in this work, just
the profiles of some base-CRGs not previously an-
alyzed in the author’s contributions are shown in
this paper. In this line, the diagnosis/drug pro-
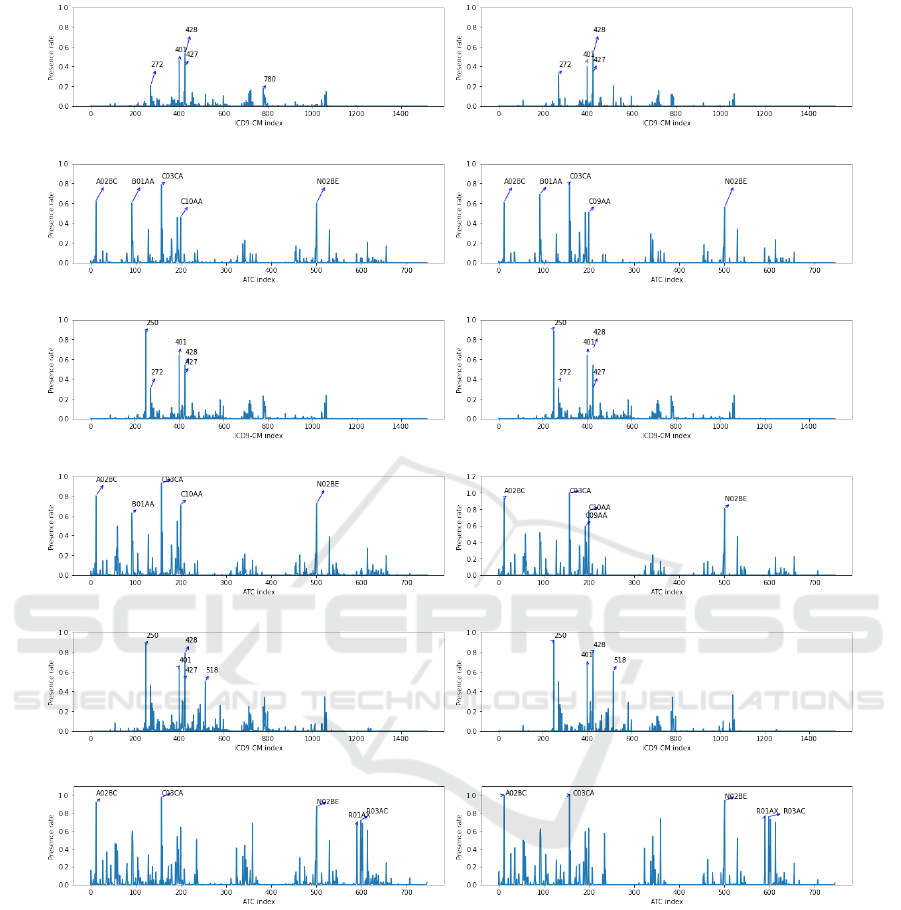
file for CRG-5179, CRG-6191, CRG-7060 are pre-
sented on the left panels of Figure 1. The diagnosis
profile of CRG-5179 (see Figure 1 (a)) shows that
the ICD9-CM codes with the highest presence rate
are 427 (cardiac dysrhythmias) and 428 (heart fail-
ure), which are closely related to CHF. Note that
the present rate of codes 427 and 428 do not ex-
ceed 54% (see Table 2), showing that approximately
half of the patients in CRG-5179 have not been di-
agnosed with these codes. It is also interesting that
the 401 code (Essential Hypertension, EHT) presents
a rate even higher than that linked to code 427, evi-
dencing the relationship between these CDs (HT and
CHF). The drug profile (see Figure 1 (c)) shows that
patients in CRG-5179 mainly consume C03CA (sul-
fonamides), A02BC (proton pump inhibitors), and
N02BE (anilides). The code C03CA corresponds to
loop diuretics used for primarily treating uncompen-
sated heart failure, A02BC is usually prescribed as a
stomach protector, and N02BE are non-opioid anal-
gesic. Regarding the diagnosis profile of CRG-6191
(see Figure 1 (e)), the ICD9-CM codes with the high-
est presence rate were 250 (DM), 401 (EHT), 427,
and 428. The drug profile of CRG-6191 (see Fig-
ure 1 (g)) indicates that ATC codes most prevalent
On the Use of Generative Adversarial Networks to Predict Health Status Among Chronic Patients
169

are C03CA, A02BC, N02BE and C10AA (HMG CoA
reductase inhibitors). C10AA is commonly used for
reducing high cholesterol levels and the other drugs
were previously detailed. For CRG-7060 (CHF, DIA,
and COPD), in the diagnosis profile (see Figure 1 (i))
the most frequent ICD9-CM codes were 250 (DM),
427, 428 (related to CHF), and 518 (linked to COPD),
while the drug profile (see Figure 1 (k)) showed a high
presence rate of ATC codes C03CA, A02BC, N02BE,
and C10AA. A summary of the most frequent codes
in the profiles for the rest of the considered CRGs is
provided in Table 2.
Table 2: Most prevalent ICD9-CM codes in the base-CRGs,
and associated presence rate. Values over 0.8 are in bold.
ICD9-CM codes
base-CRG 250 272 401 427 428 518 780
5179 0.03 0.21 0.47 0.4 0.54 0.04 0.18
5192(1) 0.01 0.22 0.79 0.01 0.00 0.00 0.08
5192(2) 0.01 0.25 0.83 0.01 0.00 0.00 0.16
5192(3) 0.01 0.42 0.85 0.01 0.00 0.03 0.18
5192(4) 0.00 0.33 0.92 0.00 0.00 0.00 0.13
5424(1) 0.88 0.22 0.05 0.00 0.00 0.00 0.07
5424(2) 0.97 0.15 0.04 0.00 0.00 0.00 0.01
5424(3) 0.92 0.26 0.08 0.00 0.00 0.00 0.13
5424(4) 1.00 0.20 0.00 0.00 0.00 0.00 0.00
6190 0.91 0.00 0.00 0.93 0.52 0.80 0.64
6191 0.89 0.31 0.64 0.45 0.54 0.07 0.23
6313(1) 0.86 0.25 0.69 0.01 0.00 0.00 0.17
6313(2) 0.93 0.31 0.73 0.02 0.00 0.00 0.22
6313(3) 0.95 0.37 0.79 0.01 0.00 0.00 0.28
6313(4) 0.95 0.38 0.87 0.04 0.02 0.09 0.31
7060 0.89 0.47 0.66 0.54 0.79 0.50 0.25
7080 0.93 0.48 0.67 0.32 0.69 0.26 0.34
7081 0.22 0.35 0.54 0.59 0.87 0.65 0.25
Table 3: Most prevalent ATC codes in the base-CRGs, and
associated presence rate. Values over 0.8 are in bold.
ATC codes
base-CRG A02BC A10AB A10BA C03CA C09AA C10AA N02BE R03AC
5179 0.62 0.00 0.00 0.79 0.45 0.46 0.60 0.05
5192(1) 0.29 0.00 0.00 0.03 0.42 0.31 0.32 0.02
5192(2) 0.46 0.00 0.00 0.04 0.40 0.36 0.44 0.03
5192(3) 0.54 0.00 0.00 0.06 0.44 0.44 0.58 0.05
5192(4) 0.36 0.00 0.00 0.00 0.44 0.31 0.38 0.03
5424(1) 0.22 0.09 0.65 0.00 0.00 0.45 0.24 0.01
5424(2) 0.19 0.46 0.36 0.00 0.01 0.34 0.31 0.02
5424(3) 0.32 0.39 0.50 0.00 0.00 0.34 0.26 0.03
5424(4) 0.20 0.20 0.40 0.00 0.00 0.60 0.60 0.00
6190 0.91 0.00 0.00 0.93 0.53 0.52 0.80 0.64
6191 0.80 0.19 0.50 0.93 0.54 0.71 0.73 0.05
6313(1) 0.40 0.05 0.71 0.05 0.47 0.66 0.33 0.02
6313(2) 0.59 0.06 0.63 0.06 0.42 0.67 0.51 0.0
6313(3) 0.69 0.08 0.59 0.1 0.41 0.67 0.65 0.06
6313(4) 0.78 0.13 0.56 0.15 0.47 0.65 0.73 0.11
7060 0.92 0.46 0.38 0.97 0.53 0.64 0.87 0.72
7080 0.88 0.36 0.35 0.94 0.52 0.64 0.79 0.37
7081 0.97 0.14 0.09 0.98 0.54 0.42 0.95 0.66
For the CRG-5192, the ICD9-CM codes with the
highest presence rate (see Table 2) were 401 (EHT)
and 272 (disorders of lipid metabolism), showing
the association between overweight and hypertension.
Regarding the ATC codes, the highest presence rates
are for drugs related to the cardiovascular system (see
Table 2), with drugs like C09AA (ACE inhibitors) and
C10AA. C09AA is the first-line drug recommended
for treating hypertension, while C10AA is key for
reducing cholesterol and preventing cardiovascular
events. It is interesting to emphasize that the increase
in the severity level is linked to an increase in the pres-
ence rate of non-steroidal anti-inflammatory medica-
tions (M01AE) and non-opioid analgesics (N02BE).
For the CRG-5424, the diagnoses with the highest rate
regardless of the severity level are 250 and 272, show-
ing a link between DM and overweight. By analyzing
the presence rate of the ATC codes in Table 3, A10BA
(biguanides) and A10AB (insulins) were more fre-
quent. Literature indicates that patients with type
1 diabetes require insulin therapy to maintain long-
term glycemic control, while biguanides are antihy-
perglycemic agents used for type 2 diabetes (Raval
and Vyas, 2020). Note also that the presence rate of
insulin increases with the severity level of the base-
CRG.
Concerning CRG-6190 (see Table 3), the ICD9-
CM codes with the highest rate are 401 (EHT) and
427, 428 (linked to CHF). The drug codes with the
highest presence rate are C03CA (loop diuretic, also
frequent in patients of CRG-5179), and R03BB (an-
ticholinergics, a medication for treating obstructive
airway diseases). Regarding the CRG-6313, Table 2
shows high rates for the ICD9-CM codes 250 and 401.
By analyzing ATC codes for CRG-6313 in Table 3,
we observe a high presence rate of drugs for treat-
ing diabetes (A10BA) and cardiovascular diseases
(C09AA and C10AA). When patients have more than
CDs, more complex patterns in diagnoses and drugs
can be identified. For the CRG-7080 (see Table 2),
there is a high presence rate of ICD9-CM codes re-
lated to DM (250), CHF (428 or 427) and also 780
(general symptoms). Since the third chronic condi-
tion of patients encompassed in this CRG is not spec-
ified, there is a wide range of potential CDs. The ATC
codes (see Table 3) with the highest rates are related
to the cardiovascular system such as C03CA, C09AA,
and C10AA and analgesics (N02BE).
Finally, for CRG-7081, the ICD9-CM codes with
the highest rates are those related to EHT and CHF
(401 and 427), and COPD and the respiratory sys-
tem (518 and 519). There is also a high presence
of antithrombotics (B01AB) and drugs related to the
respiratory system (R01AX). In general, note that
as the CRG number increases, the rate of A02BC,
N02BE and M01AE also rises, showing that patients
HEALTHINF 2023 - 16th International Conference on Health Informatics
170

with co-occurrence of three CDs consume a high
number of these drugs. Clinical evidence reveals
that multimorbid patients generally consume multi-
ple drugs for treating their diseases (Palmer et al.,
2018) and consequently they require stomach pro-
tectors (ATC A02BC) to prevent any polypharmacy-
related risks. Regarding analgesics, the literature in-
dicates that their use increases with age (Roumie and
Griffin, 2004), with 20-30% of older adults taking
analgesic medication. Then, it seems reasonable to
find these drug codes in CRGs with a predominant
presence of elderly patients.
3 METHODS
The GAN-based methods for generating synthetic pa-
tient data are first described. Then, the model to pre-
dict the chronic health status of new patients, a deci-
sion tree (interpretable ML) is presented.
3.1 GAN-based Methods for Generating
Patient Data
GANs are artificial neural networks designed to
learn generative models through an adversarial pro-
cess (Creswell et al., 2018). The GAN architecture
is composed of two artificial networks: (i) a genera-
tor G that captures the distribution of the input data
and generates synthetic samples by trying to mimic
characteristics close similar to real data; and (ii) a dis-
criminator D that tries to separate real from synthetic
samples. Formally, G takes a random vector z from
a distribution F
z
∼ N (0, 1) by creating a latent vec-
tor
ˆ
x. The generator D estimates the probability that
input is taken from ρ
data
(x). Both G and D aim to
optimize a zero-sum min-max game, with the value
function V (G, D) given by:
min
G
max
D
V (G, D) = E
x∼ρ
data
(x)
[logD(x)]
+E
z∼ρ
z
(z)
[log(1 − D(G(z)))],
(1)
where ρ
data
(x) and ρ
z
(z) are the probability density
function (pdfs) of real data and the noise (commonly
uniform or spherical Gaussian distribution), and E[·]
is the symbol for the expectation.
GANs have been used in multiple applications,
especially in computer vision for generating high-
quality and trustworthy images (Cao et al., 2018).
However, the conventional GAN was designed to
learn the distribution of continuous values and it could
not work properly with discrete data (Choi et al.,
2017). The medGAN was proposed for handling
high-dimensional binary and tabular data, and it was
specifically trained with clinical codes extracted from
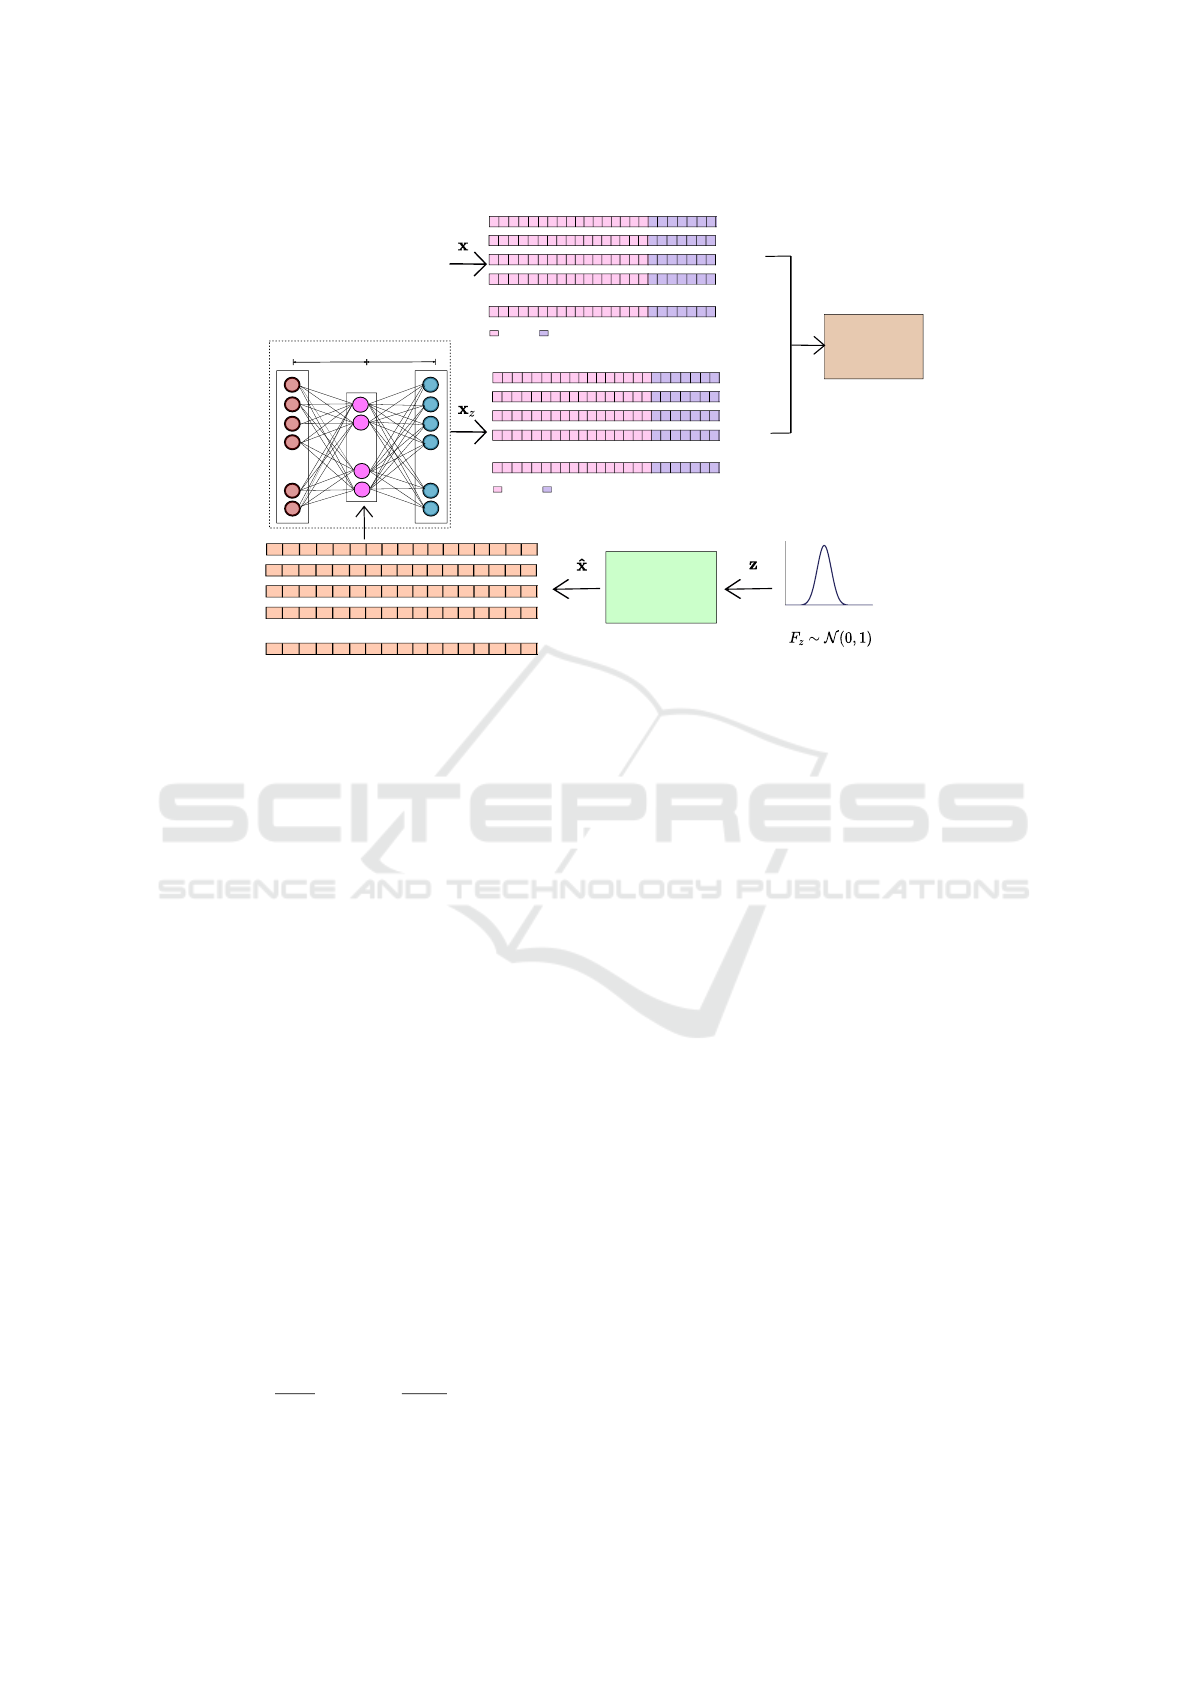
EHRs (Choi et al., 2017). To work with binary data,
the medGAN architecture (see Figure 2) introduces
an autoencoder in the generator architecture to map
discrete input samples to a continuous output, which
is passed through the decoder. Despite the promis-
ing results of medGAN, it is prone to the mode col-
lapse and the mode drop. In the former, the genera-
tor learns to map different inputs to the same output.
In the second, the generator only captures certain re-
gions of the underlying distribution of the real data.
To stabilize GAN training and solve these challenges,
several medGAN-like architectures have been pro-
posed (Baowaly et al., 2019), introducing boundary-
seeking GAN and Wasserstein GAN. Among these,
medWGAN (Baowaly et al., 2019) improves the ro-
bustness and effectiveness for generating synthetic
data with the addition of a weigh clipping called gra-
dient penalty, changing the Jensen–Shannon diver-
gence (original GAN) to the Wasserstein divergence.
A schematic of the medWGAN procedure for training
is shown in Figure 2. Note that the autoencoder has
been trained as a prior step to performing medWGAN
by taking as input real EHR data (high-dimensional
binary feature vectors) and a fixed number of neu-
rons in the latent space. According to (Baowaly et al.,
2019), medWGAN outperforms other GAN architec-
tures and works properly with binary features.
3.2 Interpretable Predictive Model for
Multiclass Task
To identify chronic patients with different health sta-
tuses using just the presence of clinical codes, a de-
cision tree (DT) has been considered (Bishop, 2006).
It is a nonlinear and nonparametric technique provid-
ing a visual interpretation of how decisions are made
in the predictions (Bishop, 2006). We have explored
the use of DT in previous work with chronic con-
ditions (Soguero-Ruiz et al., 2020b), showing good
performance when considering high-dimensional bi-
nary clinical data. The underlying idea is to divide
complex decisions into simpler ones, hierarchically
organizing them with a tree-like shape, as indicated in
Figure 3. When using a DT, the feature space is par-
titioned in an iterative manner into regions containing
a more homogeneous set of observations. The root
node is the beginning of the tree (see feature C03CA
in Figure 3) and corresponds to the most important
feature to solve the task. Each partition of the fea-
ture space is represented as an intermediate node be-
low the root in the tree-like structure. The last nodes
of the tree are called leaf nodes, and do not generate
new partitions but assign a label to the encompassed
On the Use of Generative Adversarial Networks to Predict Health Status Among Chronic Patients
171
(a) (b)
(c) (d)
(e) (f)
(g) (h)
(i) (j)
(k) (l)
Figure 1: Profiles with real samples (left panels) and synthetic samples (right panels): CRG 5179 (diagnosis profiles (a-b),
drug profiles (c-d)); CRG 6191 (diagnosis profiles (e-f), drug profiles (g-h)); CRG 7060 (diagnosis profiles (i-j), drug profiles
(k-l)).
samples.
We observe in Figure 3 that the code C03CA (drug
related to the cardiovascular system) is the most rel-
evant feature for identifying the chronic patients pre-
sented in Section 2. The presence rate shown in Ta-
ble 2 for the ATC code C03CA is consistent with its
presence on the root node: note that the leaf nodes
shown in Figure 3 (absence of C03CA in the EHR)
mostly correspond to the base-CRGs where C03CA
has a low presence rate (CRG 5192, CRG 5424, and
CRG 6313). When interpreting the rules in the DT,
it is also important to consider the number of train-
ing samples on each leaf node. Specifically, the num-
ber of patients labeled by the DT in CRG 5179, CRG
6190, CRG 6191, and CRG 7060 (high presence rate
for the code C03CA) is reduced (8, 4, 4, and 6). De-
spite the code C03CA being present in 93% of pa-
tients assigned to CRG 6190, the number of samples
assigned to the leaf node shown in Figure 3 is low (4
out of 63, as detailed in Section 4), which corresponds
HEALTHINF 2023 - 16th International Conference on Health Informatics
172
0
0
0
1
0
0
0
1 1 1 1
1
1
1
0 0
0 0
0
0
0
0
0
0
1
0
0
0
1
0
0
1 1 1 1
0
0
0
0 0
0 1
0 1 0
0
0
0
0
1
0
1
0
0
0
0 1 1 1
1
0
1
0 0
1 0
0 0 0
0
0
0
0
0
0
1
1
0
0
1 0 1 0
1
0
0
1 0
1 0
0 0 0
0
0
1
0
0
0
0
0
0
1
1 1 1 1
1
1
1
0 0
0 0
0 0 0
0
0
1
ICD9-CM codes
ATC codes
Patient 2
Patient 3
Patient 4
.......
.......
Patient 1
Patient n
....
....
{W, b} {W', b'}
....
Generator
Encoder
Input noise
Decoder
0
0
0
1
0
0
0
1 1 1 1
1
1
1
0 0
0 0
0
0
0
0
0
0
1
0
0
0
1
0
0
1 1 1 1
0
0
0
0 0
0 1
0 1 0
0
0
0
0
1
0
1
0
0
0
0 1 1 1
1
0
1
0 0
1 0
0 0 0
0
0
0
0
0
0
1
1
0
0
1 0 1 0
1
0
0
1 0
1 0
0 0 0
0
0
1
0
0
0
0
0
0
1
1 1 1 1
1
1
1
0 0
0 0
0 0 0
0
0
1
ICD9-CM codes
ATC codes
Patient 2'
Patient 3'
Patient 4'
.......
.......
Patient 1'
Patient n'
Real EHR data
Synthetic EHR data
Discriminator
.
......
Synthetic latent EHR data
0.1 0.2
0.3
0.3
0.2
0.3 0.3 0.2 0.1 0.1 0.4 0.2 0.3 0.2 0.4 0.1 0.1 0.5 0.2 0.2 0.5
0.1
0.1
0.2
0.20.1
0.3
0.1
0.40.30.20.10.20.10.20.20.10.20.30.20.10.40.1
0.5
0.2
0.2 0.1
0.2
0.2 0.3
0.6
0.1 0.2
0.2
0.1 0.3
0.4
0.1 0.4
0.3
0.2 0.4
0.5
0.6 0.1 0.1 0.1 0.2 0.2 0.2 0.3
0.2
0.50.2
0.10.2
0.20.1
0.20.20.10.3
0.1 0.2 0.2
(G)
(D)
Autoencoder
Figure 2: Schematic of the medWGAN pipeline when considering high-dimensional binary feature vectors. This picture
assumes the autoencoder has been previously trained taken as input real EHR data (feature vector x) by using a fixed number
of neurons in the hidden layer.
to the 6% of the samples. It is interesting to remark
that the branch number 0 in the DT (patients with the
code C03CA, not shown in this paper for space is-
sues) lead to the base-CRGs with 3 CDs, showing a
presence rate above 94% for C03CA in Table 2.
Following branch number 1 in Figure 3, the next
feature to be considered is code 250 (DM): if the code
is not registered in the patient’s EHR, branch number
2 is followed; otherwise, branch number 3. It is inter-
esting to observe that the leaf node corresponding to
CRG 5424 is located under the branch 3, showing that
these patients have code 250 registered. This is con-
sistent with the result shown in Table 2, where code
250 reaches a presence rate over 88% for CRG 5424.
The next code to be considered is the diagnosis code
428 (related to CHF) for the branch number 2, and
the code 401 (EHT) for branch number 3. The split-
ting procedure follows until reaching the leaf nodes,
where the sample is assigned to a base-CRG. Note
that the same feature (see the ICD9-CM 428, consid-
ered in branches 2 and 3) can be used in different parts
of the DT.
When creating the DT by including an interme-
diate node with the attribute a, the homogeneity of
the split is evaluated with the Gini impurity (Breiman
et al., 2017) and optimizing the next cost function:
J(a, l
a
) =
m
le f t
m
Gini
le f t
+
m
right
m
Gini
right
(2)
where a is the attribute chosen for the split, l
a
is the
threshold for the attribute, m is the total number of
samples in the intermediate node, m
le f t
is the number
of samples sent to the left branch and m
right
those sent
to the right branch.
4 SYNTHETIC SAMPLES
GENERATION AND
EVALUATION
The real-world dataset was randomly split into the de-
sign and test subsets, with 80% and 20% of samples,
respectively. The design subset is used for the syn-
thetic sample generation, while the test subset is only
used in Section 5 to evaluate the predictive models.
We present in this section the experimental setup and
the visual and quantitative results to evaluate the qual-
ity of synthetic data using the design subset.
4.1 Experimental Setup
The medWGAN was trained with the design sub-
set for 200 epochs, experimentally checking it was
enough for convergence when monitoring the valida-
tion loss (a validation subset was chosen for this pur-
pose). The autoencoder architecture has 2263 neurons
in the input and output layer, exploring three values
(128, 64, and 32 neurons) for the size of the hidden
On the Use of Generative Adversarial Networks to Predict Health Status Among Chronic Patients
173
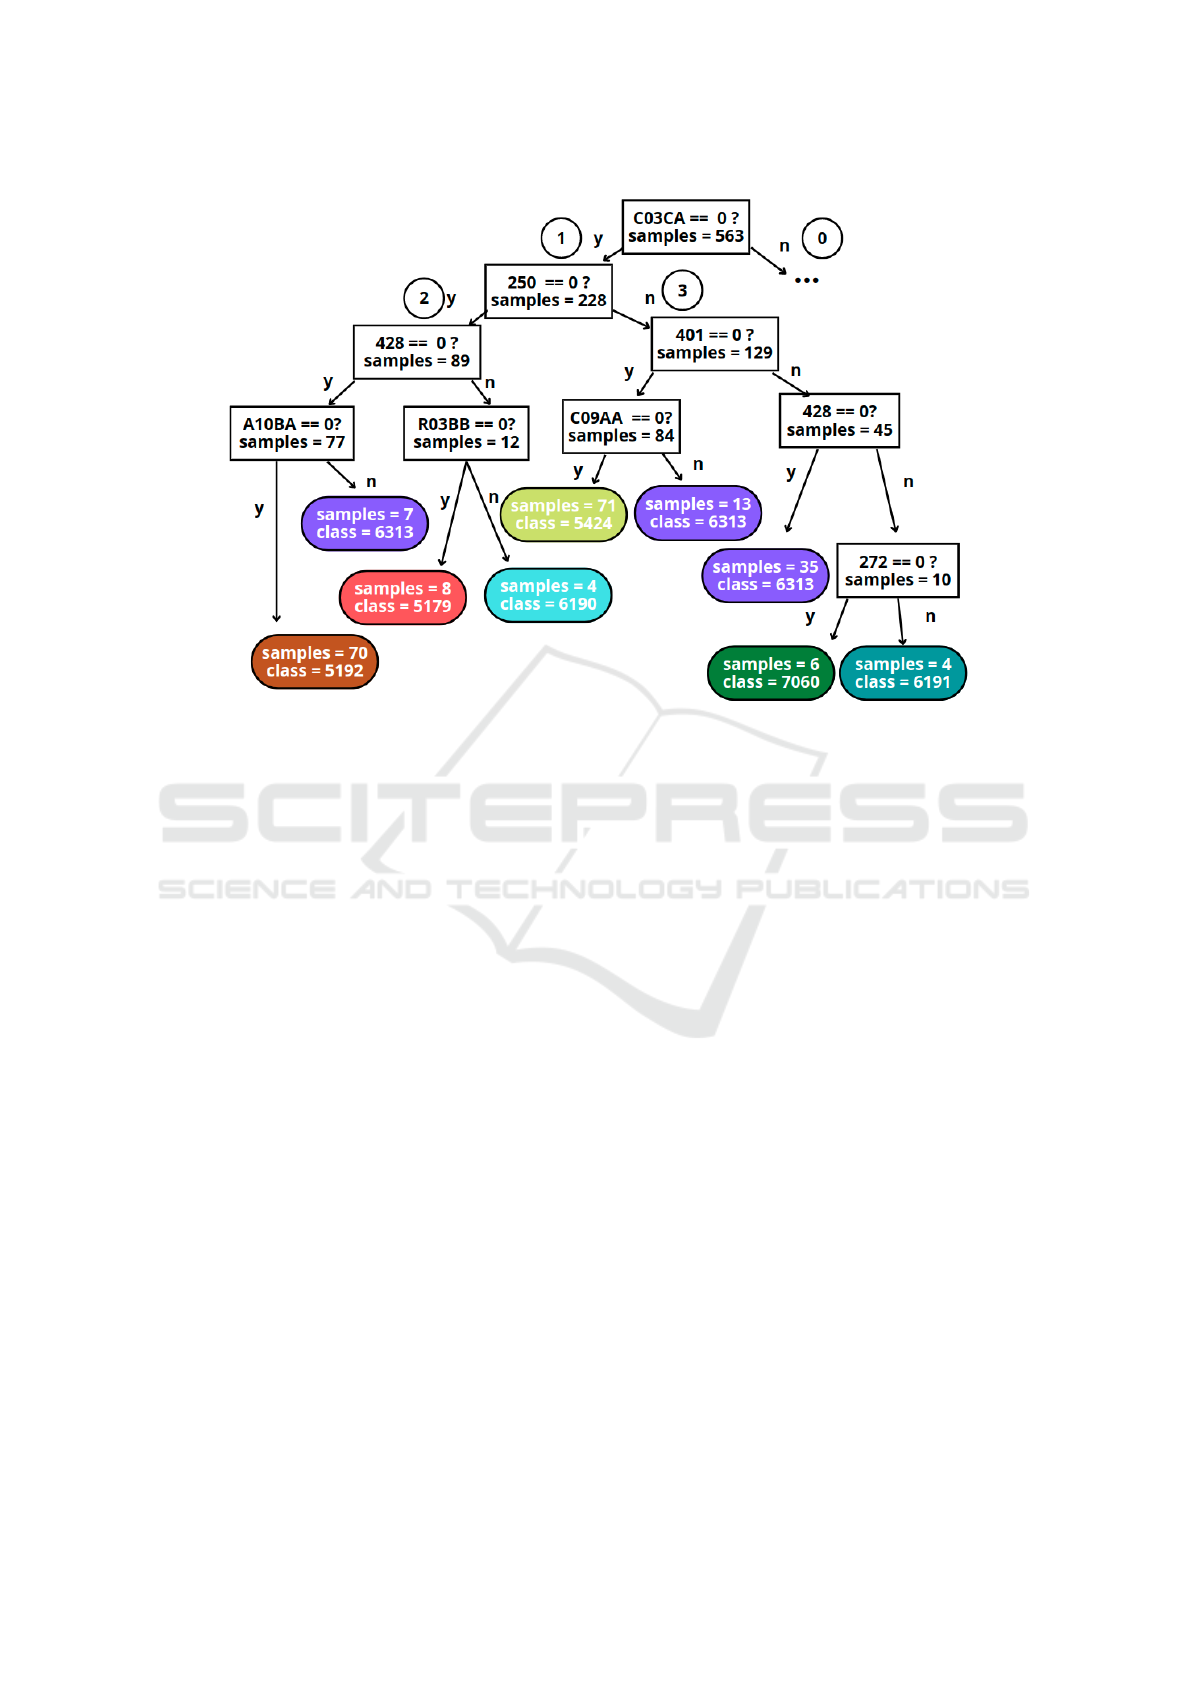
Figure 3: Detail of a branch of the DT using only the presence (arrow labelled as ‘n’) of diagnosis and drug codes to identify
chronic patients in the considered CRGs.
layer (see Figure 2). The generator G is an artificial
neural network, also exploring a different number of
neurons in the layers {(128, 128), (64, 64), (32, 32)}.
Regarding the discriminator D, it is also a neural net-
work with 2263 neurons in the input layer and 1 neu-
ron in the output layer. Three architectures with one
hidden layer (32, 64 and 128 neurons) were explored
for the discriminator network. Note that the num-
ber of neurons in the output of the generator matches
with the number of neurons in the hidden layer of the
autoencoder. As for number of neurons in the in-
put layer of the discriminator, it is the same as the
number of features in the input data. Following the
same approach in prior works (Baowaly et al., 2019;
Zhang et al., 2020), we selected the medWGAN ar-
chitecture considering the dimension-wise probability
(DWP), providing 64 neurons for both the generator
and the discriminator.
To evaluate the quality of the generated synthetic
samples from an ML perspective, we designed sev-
eral decision trees, one DT per each base-CRG. For
each one, we considered the same number of synthetic
samples as those in the design subset (real-world sam-
ples). Since synthetic and real-world samples are
joined in a new set called X
b
, every DT is built with
balanced classes to discriminate between real-world
and synthetic samples. The new set X
b
was split into
two partitions, one for the DT training (80%) and the
other one for evaluation (20%).
The minimum number of samples per leaf was set
to 10% of the number of training samples.
4.2 Visual and Quantitative Evaluation
In this subsection, a visual and quantitative compar-
ison between the profiles obtained from real-world
and synthetic patients is carried out. For the visual
comparison, the diagnosis and drug profile of syn-
thetic patients is obtained for each CRG. For simplic-
ity, only the profiles of CRG-5179, 6191, and 7060
using synthetic data are depicted on the right panels
of Figure 1. Note the high similarity between the pro-
files of real-world samples and those obtained from
the synthetic samples (created with the medWGAN).
As an example, note that the four ICD9-CM codes
with the highest presence rates in CRG 5179 are the
same when considering synthetic and real-world sam-
ples. It is also interesting to observe a regularization
effect of the network since some codes with low pres-
ence rate when considering real-world samples have
even a lower presence rates in the profile with the syn-
thetic samples. To remark that, when the medWGAN
considers a large number of real samples for training,
the profiles created from real samples and synthetic
samples are increasingly indistinguishable.
The first quantitative evaluation aims to measure
HEALTHINF 2023 - 16th International Conference on Health Informatics
174

the correlation between the profiles of real-world and
synthetic data (Chushig-Muzo et al., 2022). Toward
that end, the Pearson correlation coefficient (PCC)
was considered. PCC is ranged between [−1, 1], with
higher absolute values indicating high correlation and
0 meaning no linear relationship. Thus, we quantify
the relationship between the profiles of real and syn-
thetic patients corresponding to each CRG. High PCC
values indicate that synthetic data is more similar to
real data in terms of linear correlations across the fea-
tures. The resulting PCC values for the profiles linked
to all CRGs were over 0.9, showing that medWGAN
captures reasonably well the characteristics of real-
world data.
The second quantitative evaluation takes advan-
tage of the potential of an ML classifier (specifically
a DT) to determine whether samples are real-world
or synthetic. Twelve DTs (one per CRG in Table 4)
were designed for this purpose by considering just bi-
nary clinical codes. It is important to emphasize that,
before the classifier design, a pre-processing stage is
considered to ensure that every sample, real or syn-
thetic, is unique. Details about the number of train
and test samples (balanced classes), together with the
accuracy rates in the test set are shown in Table 4.
Note that results are fairly good, providing accuracy
rates between 45%-66%.
Table 4: Accuracy in the test set when designing a DT for
discriminating between real and synthetic samples (binary
classification) linked to a specific CRG.
base-CRG # train samples # test samples accuracy
5179 192 48 60.41%
5192(1) 8929 2233 54.23%
5192(234) 1584 386 54.29%
5424(1) 1433 359 52.36%
5424(234) 176 44 52.20%
6190 144 36 55.55%
6191 176 44 45.45%
6313(1) 1592 399 56.14%
6313(234) 1600 400 54.00%
7060 144 36 55.35%
7080 128 32 65.62%
7081 261 66 62.12%
5 HEALTH STATUS PREDICTION
FOR CHRONIC PATIENTS
We now proceed to determine the patient’s health sta-
tus from a set of nine, all with chronic conditions. The
nine health statuses correspond to the nine base-CRGs
(5179, 5192, 5424, 6190, 6191, 6313, 7060, 7080,
7081) presented in Section 2, such that samples of all
the severity levels linked to the same base-CRG are
collected under the same base-CRG. To evaluate the
performance in the multiclass scenario, the confusion
matrix (CM) was used. For a scenario with 9 classes,
the size of the CM is 9 × 9, showing the actual classes
(rows in the CM) and the predicted ones (columns in
the CM). Values in the entries in the diagonal cells re-
port the number of samples with correct predictions,
whereas those on the off-diagonal cells represent the
number of misclassified samples.
Two settings are considered for learning: (i) the
first setting, which uses just real-world data (X
r
);
and (ii) the second setting, using both real-world and
synthetic data (X
r
∪ X
s
). For both settings, a pre-
processing stage is performed to ensure that any sam-
ple, real or synthetic, is unique and that the same sam-
ple (same feature vector) is not considered in different
base-CRG. For a fair comparison, the model perfor-
mance is always evaluated with real-world samples
(test set), not considered neither to train the GANs
and generate synthetic examples nor to train the DTs.
For the multiclass DT, the validation set is obtained by
randomly selecting 20% of the training set X
r
. Once
the validation set is determined (note classes are un-
balanced), we undersample the train set X
r
for bal-
ancing purposes, leading to X
0
r
, such that all the con-
sidered base-CRG have the number of samples of the
base-CRG with fewer samples.
Several values for each hyperparameter were con-
sidered, selecting the model with the best perfor-
mance following the multiclass Area Under the Curve
(AUC) analysis (Hanley and McNeil, 1982) on the
validation set. The AUC, a common figure of merit
used in the clinical domain, reflects here how good the
model is at identifying chronic patients with differ-
ent health statuses. Since we are tackling a multiclass
task, the AUC for each base-CRG is computed (see
Table 5). To complement the results for multi-class
classification, the macro average (macro-avg) and mi-
cro average (micro-avg) measurements were also cal-
culated.
Once the model for the first setting has been de-
signed (see part of the DT in Figure 3), we evaluate
its performance using the test subset (only real-world
samples). The corresponding CM is presented in Fig-
ure 4: the first value in every cell refers to the number
of patients with the actual label (row) assigned to the
predicted label (column); the second value is the first
number expressed as a percentage (in relation to the
actual label). The CM shows the worst performance
for the base-CRG 7080 and 7081 (the chronic health
statuses with more complex patterns). By analyzing
the actual and predicted base-CRG, note that patients
in the CRG 7081 are misclassified as the base-CRG
6190: both groups encompass patients with CHF and
On the Use of Generative Adversarial Networks to Predict Health Status Among Chronic Patients
175
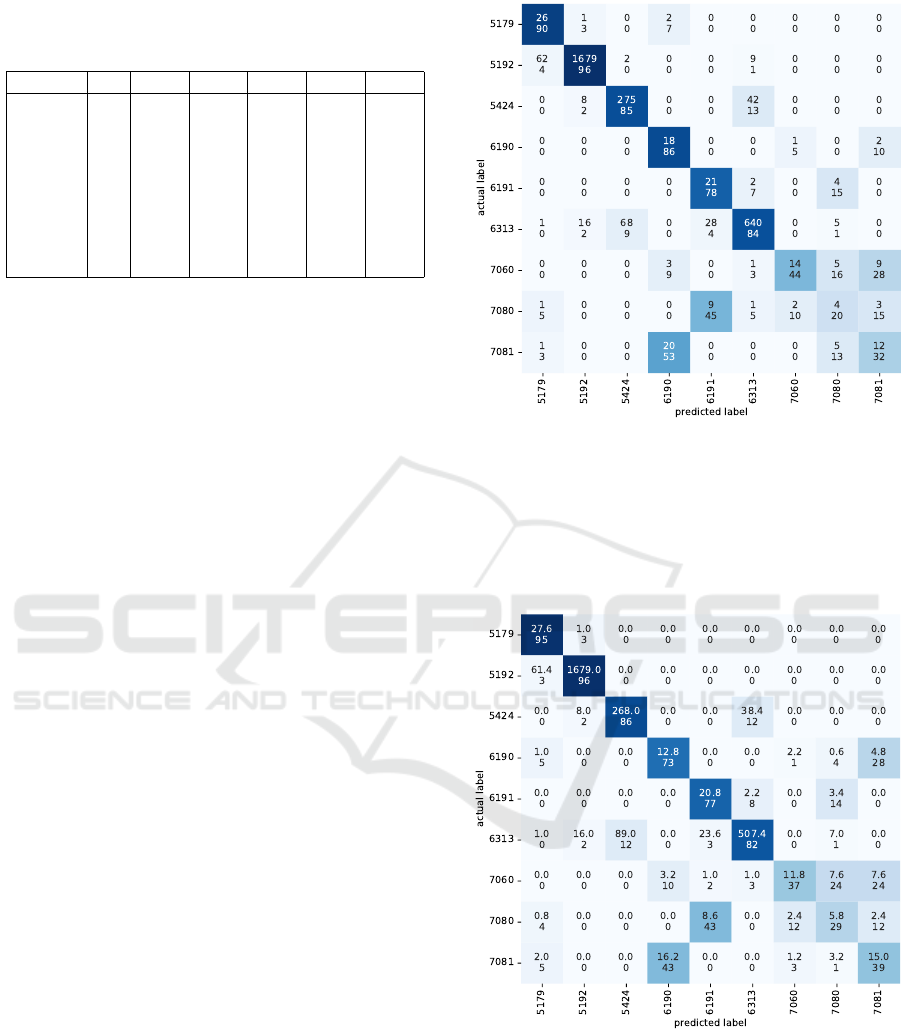
Table 5: Multiclass AUC analysis on the validation subset,
considering real samples (X
0
r
) and five augmented sets (X
0
r
∪
X
s
) composed by real and synthetic samples.
X
0
r
X
0
r
∪ X
(1)
s
X
0
r
∪ X
(2)
s
X
0
r
∪ X
(3)
s
X
0
r
∪ X
(4)
s
X
0
r
∪ X
(5)
s
macro-avg 0.89 0.89 0.90 0.86 0.88 0.87
micro-avg 0.92 0.94 0.95 0.94 0.93 0.94
CRG-5179 0.94 0.94 0.97 0.97 0.95 1.00
CRG-5192 0.93 0.97 0.97 0.97 0.94 0.97
CRG-5424 0.87 0.89 0.90 0.86 0.91 0.87
CRG-6190 0.90 0.94 0.94 0.90 0.90 0.93
CRG-6191 0.90 0.85 0.83 0.83 0.83 0.78
CRG-6313 0.90 0.89 0.93 0.92 0.90 0.92
CRG-7060 0.92 0.88 0.80 0.78 0.82 0.80
CRG-7080 0.84 0.81 0.87 0.80 0.84 0.77
CRG-7081 0.77 0.85 0.87 0.72 0.80 0.78
COPD, though the base-CRG 7081 includes another
unspecified pathology. In the same line, 9 patients
assigned to the CRG 7080 are also misclassified in
the CRG 6191, with both base-CRG sharing CHF and
DM.
For the second setting using both real-world and
synthetic data, we create five multiclass DTs with dif-
ferent subsets of synthetic samples. For this purpose,
we randomly select five partitions from the X
s
set,
namely {X
(i)
s
}
5
i=1
. Since the X
s
set is unbalanced,
we select the 90% of each base-CRG from X
s
to ob-
tain samples used in each partition. Then, we balance
health statuses in each of the five partitions, obtain-
ing 40 samples for each base-CRG and partition. To
create each of the five multiclass DTs, we join the
subset of real samples X
0
r
with each of other five sub-
sets X
(i)
s
, such that {X
0
r
∪ X
(i)
s
}
5
i=1
and design the five
multiclass DTs. Finally, we obtain five CM linked to
the same test set and the nine base-CRG. The average
of the five CM is presented in Figure 5. It shows that
the classification performance improves when includ-
ing synthetic samples in the training set, especially
for those health statuses with the lowest performance
(multi-morbidity), which are more interesting from a
clinical viewpoint.
6 CONCLUSIONS
In this work, we evaluated the use of medWGAN
to generate synthetic clinical data aiming to improve
the identification of chronic patients in a multi-class
scenario. The medWGAN has resulted to be an ef-
fective method for creating synthetic feature vectors
from high-dimensional clinical codes (ICD9-CM and
ATC). To evaluate how similar synthetic and real-
world patients are, the profiles and the PCC be-
tween profiles were first considered. The PCC val-
ues were over 0.9 in most cases, showing similar
profiles and presence rates for the most prevalent
Figure 4: CM when evaluating the test subset (real-world
samples) with the DT designed using only real-world sam-
ples (training samples). The first number in each cell refers
to the number of patients with the actual label (rows in the
CM) classified by the DT with the predicted label (columns
in the CM). The second number in every cell represents the
percentage of test patients of the actual class that are classi-
fied with different labels.
Figure 5: Averaged CM for the test subset (real-world sam-
ples) with the DT designed using real-world and augmented
samples (training samples). Since five subsets of the syn-
thetic samples were considered for training, the average of
the five CM was computed. The first number in every cell
refers to the average number of patients with the actual la-
bel (rows in the CM) classified by the DT with the predicted
label (columns in the CM). The second number in each cell
represents the average percentage of test patients of the ac-
tual class classified with different labels.
HEALTHINF 2023 - 16th International Conference on Health Informatics
176

ICD9-CM and ATC codes. The classification results
between real and synthetic samples also prove that
these samples are hard to discriminate. Regarding
the results in the multi-class scenario, the identifi-
cation of patients with multiple chronic conditions
was improved (specifically for patients assigned to
CRG-6191, CRG-7080, and CRG-7081). Further re-
search may explore cost-sensitive learning methods
and GAN-based models that handle categorical and
numerical features aiming to improve the classifica-
tion results. Our study highlights the effectiveness of
GAN-based models to work with a high-dimensional
and sparse clinical dataset, allowing us to create real-
istic patient data and improve prediction performance.
ACKNOWLEDGMENT
This work was partly funded by the Spanish Re-
search Agency, grant numbers PID2019-106623RB-
C41/AEI/10.13039/501100011033 (BigTheory) and
PID2019-107768RA-I00 (AAVis-BMR) funded by
MCIN/AEI/10.13039/501100011033, by the Com-
munity of Madrid in the framework “Encourage-
ment of Young Phd students investigation” (Mapping-
UCI, F661), and by the European Union NextGenera-
tionEU funds (Youth Employment Plan of the Spanish
Government) in the INVESTIGO project with refer-
ence URJC-AI-11.
REFERENCES
American Medical Association (2004). International Clas-
sification of Diseases, 9th Revision, Clinical Modifi-
cation.
Baowaly, M. K., Lin, C.-C., Liu, C.-L., and Chen, K.-T.
(2019). Synthesizing electronic health records us-
ing improved generative adversarial networks. Jour-
nal of the American Medical Informatics Association,
26(3):228–241.
Bishop, C. M. (2006). Pattern Recognition and Ma-
chine Learning (Information Science and Statistics).
Springer-Verlag, Berlin, Heidelberg.
Bouza, C., Lopez-Cuadrado, T., and Amate-Blanco, J.
(2016). Use of explicit ICD9-CM codes to identify
adult severe sepsis: impacts on epidemiological esti-
mates. Critical Care, 20(1):313.
Breiman, L., Friedman, J. H., Olshen, R. A., and Stone,
C. J. (2017). Classification and regression trees. Rout-
ledge.
Budreviciute, A. et al. (2020). Management and preven-
tion strategies for non-communicable diseases (ncds)
and their risk factors. Frontiers in Public Health,
8:574111.
Cao, Y.-J., Jia, L.-L., Chen, Y.-X., Lin, N., Yang, C., Zhang,
B., Liu, Z., Li, X.-X., and Dai, H.-H. (2018). Recent
advances of generative adversarial networks in com-
puter vision. IEEE Access, 7:14985–15006.
Chawla, N. V., Bowyer, K. W., Hall, L. O., and Kegelmeyer,
W. P. (2002). Smote: synthetic minority over-
sampling technique. Journal of Artificial Intelligence
Research, 16:321–357.
Choi, E., Biswal, S., Malin, B., Duke, J., Stewart, W. F., and
Sun, J. (2017). Generating multi-label discrete patient
records using generative adversarial networks. In Proc
of the Machine learning for Healthcare Conference,
pages 286–305, Boston, Massachusetts.
Chong, J. L., Lim, K. K., and Matchar, D. B. (2019). Popu-
lation segmentation based on healthcare needs: a sys-
tematic review. Systematic Reviews, 8(1):1–11.
Chushig-Muzo, D., Soguero-Ruiz, C., de Miguel-Bohoyo,
P., and Mora-Jim
´
enez, I. (2021). Interpreting clinical
latent representations using autoencoders and proba-
bilistic models. Artificial Intelligence in Medicine,
122:102211.
Chushig-Muzo, D., Soguero-Ruiz, C., de Miguel-Bohoyo,
P., and Mora-Jim
´
enez, I. (2022). Interpreting clinical
latent representations using autoencoders and proba-
bilistic models. BioData Mining, 15(18):1–27.
Creswell, A., White, T., Dumoulin, V., Arulkumaran, K.,
Sengupta, B., and Bharath, A. A. (2018). Generative
adversarial networks: An overview. IEEE Signal Pro-
cessing Magazine, 35(1):53–65.
Engelmann, J. and Lessmann, S. (2021). Conditional
wasserstein gan-based oversampling of tabular data
for imbalanced learning. Expert Systems with Appli-
cations, 174:114582.
Falhammar, H., Lindh, J. D., Calissendorff, J., Skov, J.,
Nathanson, D., and Mannheimer, B. (2019). An-
tipsychotics and severe hyponatremia: A swedish
population–based case–control study. European Jour-
nal of Internal Medicine, 60:71–77.
Finison, K., Mohlman, M., Jones, C., Pinette, M., Jor-
genson, D., Kinner, A., Tremblay, T., and Gottlieb,
D. (2017). Risk-adjustment methods for all-payer
comparative performance reporting in vermont. BMC
Health Services Research, 17(1):1–13.
Hanley, J. A. and McNeil, B. J. (1982). The meaning and
use of the area under a receiver operating characteris-
tic (roc) curve. Radiology, 143(1):29–36.
He, H. and Garcia, E. (2009). Learning from imbalanced
data. IEEE Transactions on Knowledge and Data En-
gineering, 21(9):1263–1284.
Hughes, J. S., Averill, R. F., Eisenhandler, J., Goldfield,
N. I., Muldoon, J., Neff, J. M., and Gay, J. C. (2004).
Clinical Risk Groups (CRGs): a classification system
for risk-adjusted capitation-based payment and health
care management. Medical Care, 42(1):81–90.
Ma, Y. and He, H. (2013). Imbalanced learning: foun-
dations, algorithms, and applications. John Wiley &
Sons.
Palmer, K., Marengoni, A., Forjaz, M. J., Jureviciene, E.,
Laatikainen, et al. (2018). Multimorbidity care model:
Recommendations from the consensus meeting of the
On the Use of Generative Adversarial Networks to Predict Health Status Among Chronic Patients
177

joint action on chronic diseases and promoting healthy
ageing across the life cycle (ja-chrodis). Health Pol-
icy, 122(1):4–11.
Raval, A. D. and Vyas, A. (2020). National trends in di-
abetes medication use in the united states: 2008 to
2015. Journal of Pharmacy Practice, 33(4):433–442.
Roumie, C. L. and Griffin, M. R. (2004). Over-the-counter
analgesics in older adults. Drugs & Aging, 21(8):485–
498.
Shameer, K., Johnson, K. W., Glicksberg, B. S., Dudley,
J. T., and Sengupta, P. P. (2018). Machine learning
in cardiovascular medicine: are we there yet? Heart,
104(14):1156–1164.
Soguero-Ruiz, C., Alonso-Arteaga, N., Mu
˜
noz-Romero,
S., Rojo-
´
Alvarez, J. L., Rubio-S
´
anchez, M., L
´
opez-
Fajardo, I. C., and Mora-Jim
´
enez, I. (2020a). Finding
associations among chronic conditions by bootstrap
and multiple correspondence analysis. In Intl Conf on
Bioinformatics and Biomedicine, pages 2066–2073,
Seoul, Korea (South).
Soguero-Ruiz, C., Mora-Jim
´
enez, I., Mohedano-Munoz,
M. A., Rubio-Sanchez, M., Miguel-Bohoyo, P. d., and
Sanchez, A. (2020b). Visually guided classification
trees for analyzing chronic patients. BMC Bioinfor-
matics, 21(2):1–19.
Wagner, K.-H. and Brath, H. (2012). A global view on the
development of non communicable diseases. Preven-
tive Medicine, 54:S38–S41.
World Health Organization (2006). The anatomical ther-
apeutic chemical classification system with defined
daily doses (ATC/DDD).
Zhang, Z., Yan, C., Mesa, D. A., Sun, J., and Malin, B. A.
(2020). Ensuring electronic medical record simulation
through better training, modeling, and evaluation. J
American Medical Informatics Association, 27(1):99–
108.
HEALTHINF 2023 - 16th International Conference on Health Informatics
178
