Synthetic Data for Object Classification in Industrial Applications
August Baaz
1
, Yonan Yonan
1
, Kevin Hernandez-Diaz
1 a
,
Fernando Alonso-Fernandez
1 b
and Felix Nilsson
2
1
School of Information Technology (ITE), Halmstad University, Sweden
2
HMS Industrial Networks AB, Halmstad, Sweden
Keywords:
Synthetic Data, Object Classification, Machine Learning, Computer Vision, ResNet50.
Abstract:
One of the biggest challenges in machine learning is data collection. Training data is an important part since it
determines how the model will behave. In object classification, capturing a large number of images per object
and in different conditions is not always possible and can be very time-consuming and tedious. Accordingly,
this work explores the creation of artificial images using a game engine to cope with limited data in the
training dataset. We combine real and synthetic data to train the object classification engine, a strategy that
has shown to be beneficial to increase confidence in the decisions made by the classifier, which is often critical
in industrial setups. To combine real and synthetic data, we first train the classifier on a massive amount of
synthetic data, and then we fine-tune it on real images. Another important result is that the amount of real
images needed for fine-tuning is not very high, reaching top accuracy with just 12 or 24 images per class. This
substantially reduces the requirements of capturing a great amount of real data.
1 INTRODUCTION
Popularized since 2015, Industry 4.0 (Xu et al., 2021)
refers to integrating Computer Vision (CV), Artificial
Intelligence (AI), Machine Learning (ML), the Inter-
net of Things (IoT), and cloud computing into indus-
trial processes. Some significant changes of industry
4.0 are increased automation, self-optimization, and
predictive maintenance. For example, object detec-
tion and image classification could significantly ben-
efit industrial scenarios. Models need training data to
learn, and the quality and quantity of such data is the
most crucial part to obtain a reliable model. However,
collecting data can be challenging and costly.
This research explores methods to minimize the
data collection needed to train object recognition and
classification. We aim at developing a system to rec-
ognize industrial products using a camera. It could
monitor production lines and reduce human repetitive
workload for tasks such as sorting, inventory keep-
ing, and quality control. We use ResNet50 (He et al.,
2016) Convolutional Neural Network (CNN) as clas-
sification architecture in conjunction with methods to
reduce the amount of data needed, exploring possi-
bilities other than manually collecting a large number
a
https://orcid.org/0000-0002-9696-7843
b
https://orcid.org/0000-0002-1400-346X
of images per class. Our most important contribution
is the use of synthetic data rendered with a game en-
gine. Synthetic data is then combined with real data,
demonstrating by experiments that the classification
network not only keeps a good accuracy but increases
its confidence in classifying the different objects.
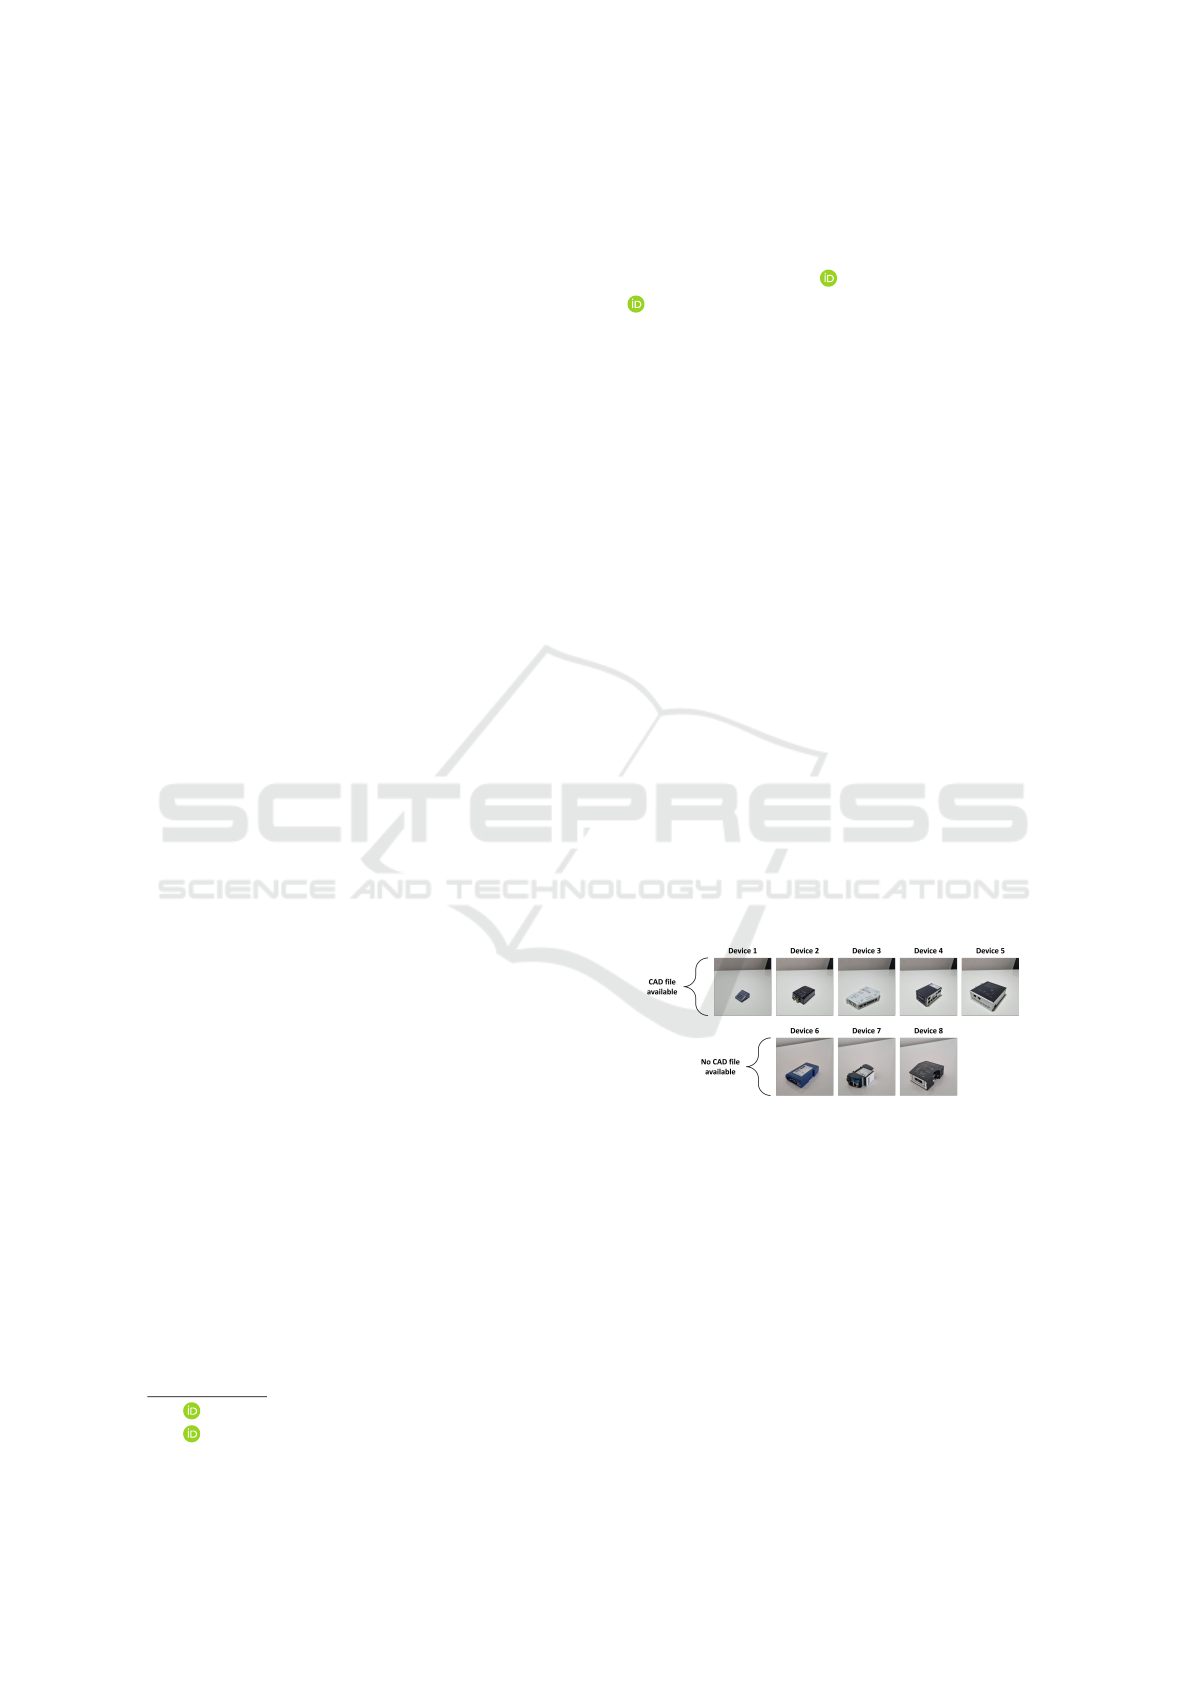
Figure 1: Target objects to be classified. Device 1: Com-
pactCom M40 Module EtherNet/IP IIoT Secure. D2: Wire-
less Bridge II Ethernet. D3: Communicator PROFINET
IO-Device Modbus TCP server. D4: Edge Gateway with
Switch. D5: X-gateway Modbus Plus Slave PROFINET-
IRT Device. D6: Communicator PROFINET-IRT. D7:
Edge Essential Sequence. D8: Anybus PROFINET to .NET
Bridge. All devices can be found at www.anybus.com
This project is a collaboration of Halmstad Uni-
versity with HMS Networks AB in Halmstad. HMS
makes products that enable industrial equipment to
communicate over various industrial protocols (HMS,
2022). They explore emerging technologies, and one
crucial technology is AI, where they want to exam-
ine different applications of AI and vision technolo-
Baaz, A., Yonan, Y., Hernandez-Diaz, K., Alonso-Fernandez, F. and Nilsson, F.
Synthetic Data for Object Classification in Industrial Applications.
DOI: 10.5220/0011689900003411
In Proceedings of the 12th International Conference on Pattern Recognition Applications and Methods (ICPRAM 2023), pages 387-394
ISBN: 978-989-758-626-2; ISSN: 2184-4313
Copyright
c
2023 by SCITEPRESS – Science and Technology Publications, Lda. Under CC license (CC BY-NC-ND 4.0)
387
gies, e.g. (Nilsson et al., 2020), which may be part
of future products. As shown in Figure 1, HMS prod-
ucts have simple shapes, although the system is po-
tentially applicable to other products in the industry
where sorting and flow control are needed.
2 RELATED WORKS
2.1 Object Classification
Image classification is a well-known CV field applied
to various tasks (Al-Faraj et al., 2021). A CNN-based
visual sorting system can be used in an inventory or
a warehouse where items lack other tokens, such as
a damaged barcode or unreadable tag (Wang et al.,
2020). Tailored to retail, (Femling et al., 2018) iden-
tified fruit and vegetables with a video-camera attach-
able to a scale, which could aid or relieve customers
and cashiers of navigating through a menu.
A visual-based system is also beneficial for qual-
ity control in manufacturing. An operator can get
tired after many quality checks and thus misclassify
products. To avoid that, (Hachem et al., 2021) imple-
mented ResNet50 for automatic quality control.
In recycling, waste has to be sorted to be recycled
properly. This has been studied in (Gyawali et al.,
2020) using CNNs, achieving an accuracy of 87%.
Similarly, (Persson et al., 2021) developed a method
to short plastics from Waste from Electrical and Elec-
tronic Equipment (WEEE).
Surveillance is another field. (Jung et al.,
2017) detected (using YOLOv4) and classified (using
ResNet) various vehicle types, including cars, bicy-
cles, buses and motorcycles. Similarly, (Svanstr
¨
om
et al., 2021) developed a drone detector via sensor fu-
sion, being able to distinguish drones from other typ-
ical objects, such as airplanes, helicopters, or birds.
2.2 Synthetic Data
Ship classification from overhead imagery is a largely
unsolved problem in the maritime domain. The main
issue is the lack of ground truth data. (Ward et al.,
2018) addressed this by building a large-scale syn-
thetic dataset using the Unity game engine and 3D
models of ships, demonstrating that synthetic data in-
creases performance dramatically while reducing the
amount of real data required to train the models.
For car surveillance, game engines such as Grand
Theft Auto V are an excellent way to generate
real-looking synthetic images (Richter et al., 2016).
(Tremblay et al., 2018) applied this, achieving an av-
erage precision of 79%, which is similar to (Jung
et al., 2017) with real data. Thus, it is safe to say
that similar results can be achieved training with syn-
thetic data, with the advantage that it is far easier to
collect. Also, in (Tremblay et al., 2018), the results of
synthetic data far exceed the results of real data after
fine-tuning with as few as 100 images.
This work is about sorting industrial products. We
can assume that they have a CAD file used in their
manufacturing process. 3D scanning is also an effec-
tive way. If the object cannot be 3D scanned and does
not have a CAD file, Generative Adversarial Net-
works (GANs) can be used. GANs artificially create
similar data using a discriminator that checks if the
feature distribution of the generated data looks close
to the real data. Some notable GANs are StyleGAN
for face generation (Karras et al., 2021) and Cycle-
GAN (Zhu et al., 2017), which allows translating an
image from one domain to another (e.g. indoor to out-
door, summer to winter, etc.)
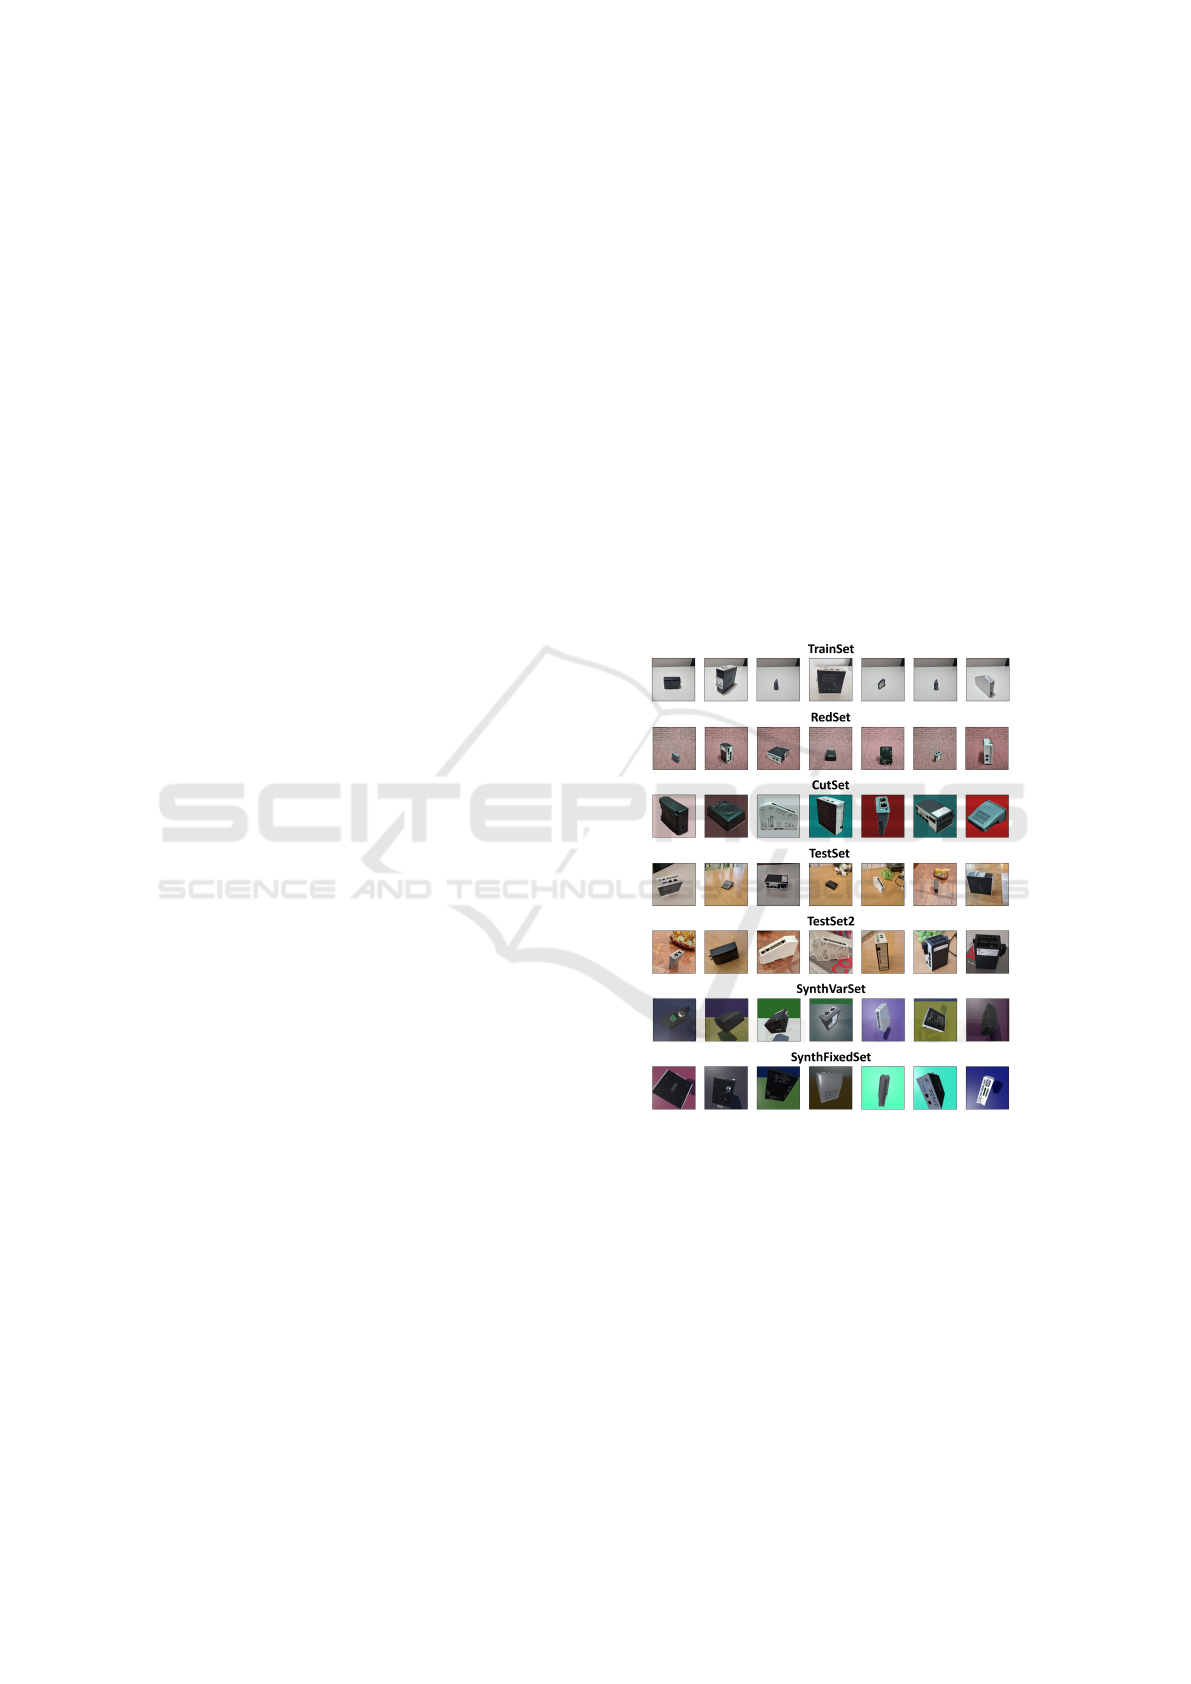
Figure 2: Example of images from the different datasets.
3 METHODOLOGY
3.1 Data Acquisition and Synthesis
An overview of the different datasets created for this
work is given in Table 1. Several HMS products
are chosen as target objects (Figure 1). They are
mostly routers and switches for industrial machines
that HMS sells. Our research was conducted in two
stages. In the initial one, we started to build a dataset
of training and test data with devices 3 to 8. How-
ICPRAM 2023 - 12th International Conference on Pattern Recognition Applications and Methods
388

Table 1: Datasets created for this work. The indicated devices are shown in Figure 1.
Initial stage of our research
Name Data Devices Classes
Images/
class
Scale Rotation Notes
TrainSet Real 3 4 5 6 7 8 6 96 Random Random Light on/off
TestSet Real 3 4 5 6 7 8 6 30 Random Random Cluttered background
Later stage of our research
Name Data Devices Classes
Images/
class
Scale Rotation Notes
TrainSet Real 1 2 3 4 5 5 96 Random Random Light on/off
RedSet Real 1 2 3 4 5 5 48 Random Random Light on, red background
CutSet Real 1 2 3 4 5 5 48 Fixed Random RedSet with fixed scale + transparent background
TestSet Real 1 2 3 4 5 5 30 Random Random Cluttered background
TestSet2 Real 1 2 3 4 5 5 30 Fixed Random TestSet with fixed scale
SynthVarSet Synth. 1 2 3 4 5 5 2000 Random Random Tries to recreate TrainSet conditions
SynthFixedSet Synth. 1 2 3 4 5 5 2000 Fixed Random Like SynthVarSet but with fixed scale
ever, we did not have accessibility to CAD files of all
these products initially used. For this reason, we later
employed devices 1 to 5, for which CAD files were
available to enable the possibility of creating 3D syn-
thetic data. However, a few experiments were con-
ducted on the initial dataset before switching to the
later one, but they were not re-run, so we keep the
description of both datasets here. In the experimental
section, we will make clear which one is being used
in each particular experiment.
Real images from each product were captured us-
ing a smartphone with 4K resolution, creating the fol-
lowing datasets (see Figure 2):
• TrainSet: using the smartphone on a tripod to
simulate a stationary camera, with 96 images per
class. Each object is rotated on all sides, with
lights on/off to vary the illumination in the room.
• RedSet: created exactly like TrainSet, except that
it has a red backdrop that can be segmented digi-
tally. This dataset has 48 pictures per class since
it was only captured with lights on.
• CutSet: created from RedSet by segmenting the
background and normalizing the object scale. The
segmentation mask is created by applying thresh-
olds to the HSV channels. Morphological opening
and closing are also applied to clean artifacts. The
background is transparent, allowing addition of
different backgrounds as desired to simulate dif-
ferent environments. In our experiments, it is re-
placed with a random RGB color during runtime.
• TestSet: for evaluation, with 30 images per class.
It has cluttered backgrounds, and not stationary
camera, so the target objects may not be the only
objects in the image.
• TestSet2: created by cutting the objects of interest
of TestSet manually to fill the entire frame.
Using Unity’s universal render pipeline (URP),
synthetic data is also generated. It takes 16ms to gen-
erate one image, or 3750 images/minute, which is a
fast and reliable way to generate datasets in minutes.
A Unity scene has been built with a room that can be
randomized. The camera that renders the scene can be
programmed to focus anywhere in the room, and its
distance to the object can be varied. The intensity and
rotation of the lighting can also be randomized, and
the background can be replaced too. Unity offers a li-
brary called Perception (Borkman et al., 2021). Using
this package, the images for the synthetic datasets are
artificially generated. The same seed is provided for
every product to generate the same random scene for
every object, as can be seen in Figure 3.
A 3D model of the objects has to be obtained for
Unity to render images. If the products have a CAD
file, they can be converted into 3D models. HMS
provided us with all the CAD files for the products.
With this, two synthetic datasets are created, having
2000 images per class (see Figure 2). Every synthetic
dataset also uses the same seed to generate the same
randomness for every object:
• SynthVarSet: created with varying distances be-
tween the object and the camera to simulate dif-
ferent scaling, and with randomized orientation,
light direction and background. This dataset tries
to simulate and recreate TrainSet.
• SynthFixedSet: is exactly like SynthVarSet with
randomized rotations and backgrounds. The dif-
ference is that the distance between the objects
and the camera is fixed, so that every object fills
the frame, thus normalizing the scale.
3.2 System Overview
This research has developed an AI to classify indus-
trial products (Figure 1) with a camera. This is about
finding the type of object (class or category) that is
Synthetic Data for Object Classification in Industrial Applications
389
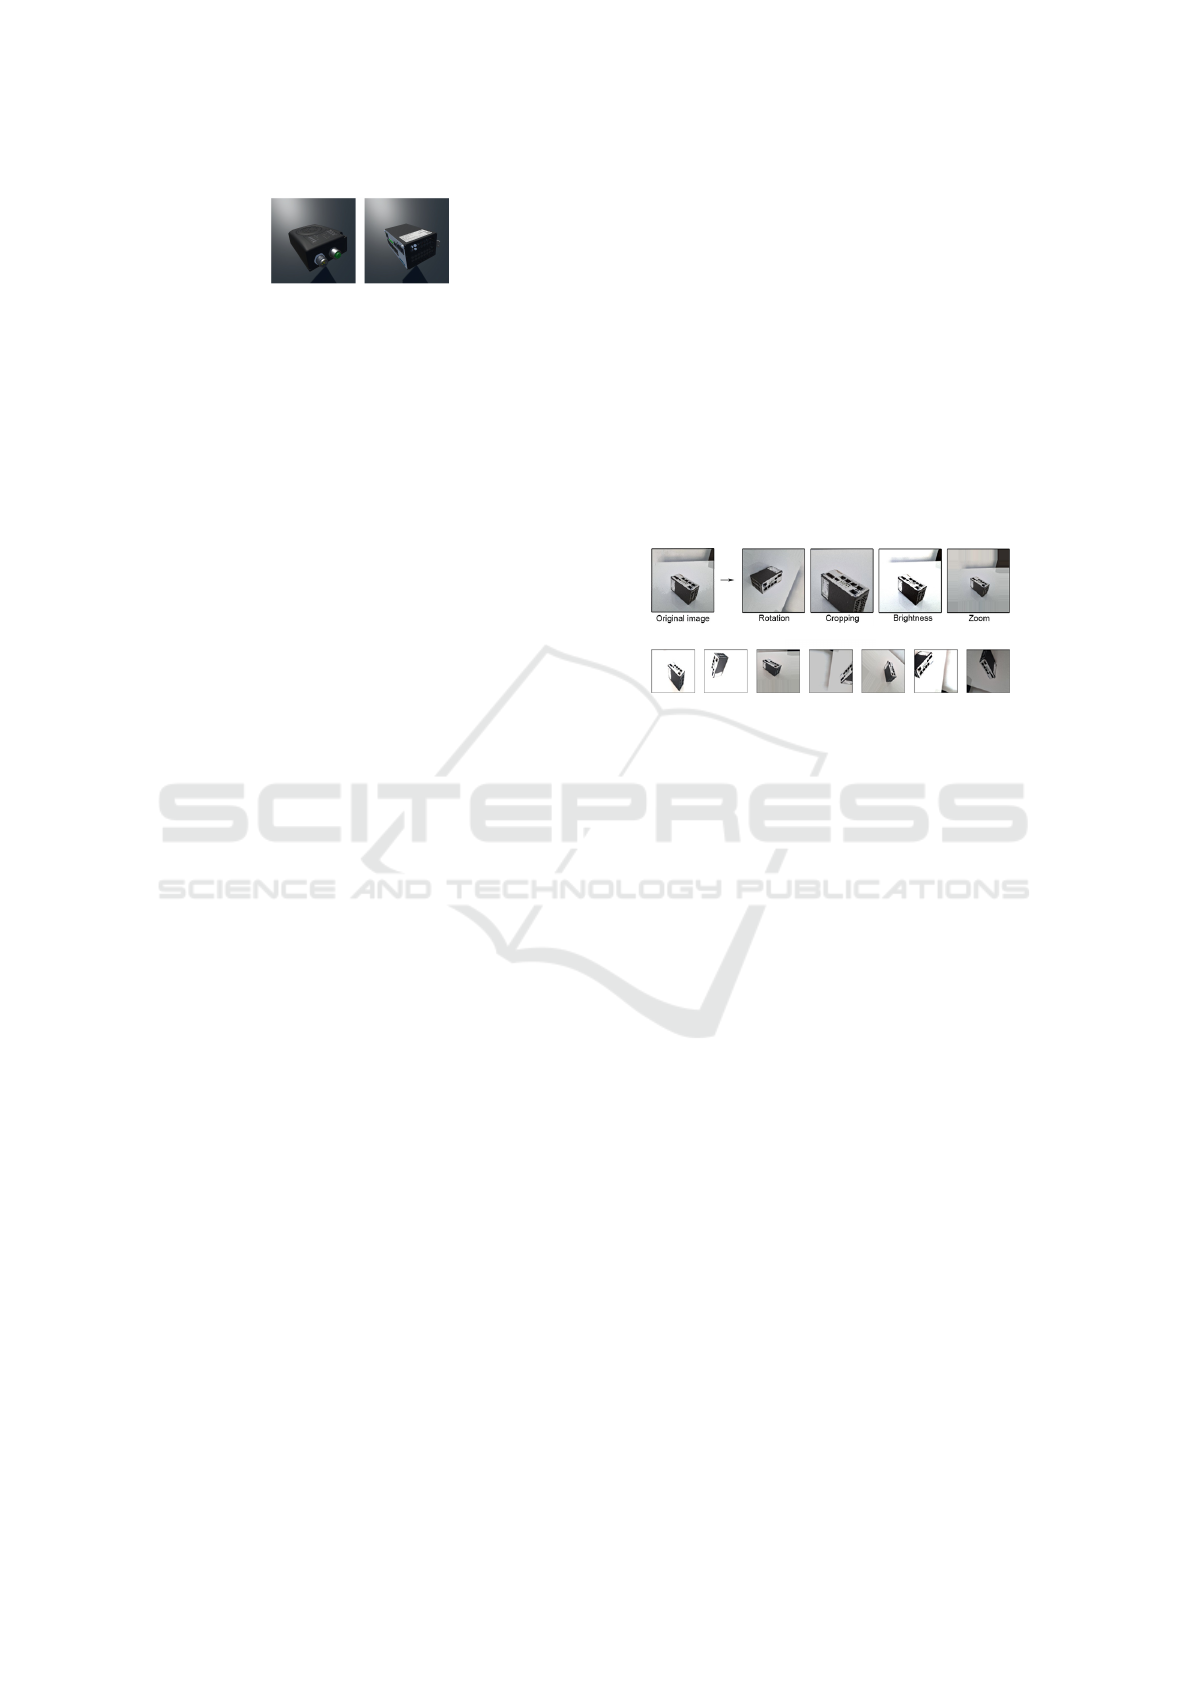
Figure 3: Synthetic images of device2 and device4 gener-
ated with the same seed.
appearing in the image. This significantly differs in
complexity depending on the specific scenario. For
this work, the following limitations are considered: i)
the camera is stationary, located to one side, and an-
gled towards the table where objects are located; ii)
the camera is in colour, iii) the objects are in focus, iv)
the table is well-lit, and the objects are visible, and v)
only one product needs to be identified at a time. The
objective is to identify products reliably (measured by
accuracy on a test set not seen during training) regard-
less of their orientation or scale.
The model architecture is based upon ResNet50
pre-trained on ImageNet as a feature extractor. The
network is connected to a single fully connected layer
with dropout, followed by a five/six neurons layer (the
number of classes in our datasets) with softmax ac-
tivation. The original ResNet50 has two fully con-
nected layers of 4096 each, which makes up for a
large portion of the weights (Reddy and Juliet, 2019).
Using only a single layer at the end of ResNet50 is en-
tirely arbitrary but common for transfer learning with
ResNet. During training, we will test the optimal size
of this fully connected layer, as well as the number of
early layers that are frozen. Generally speaking, early
layers find simple patterns that are general for vision
tasks, such as lines or shapes, and they can be kept
frozen. On the other hand, later layers find more com-
plex patterns that are specific of each task, (Yosinski
et al., 2015). so it is expected to benefit accuracy by
re-training these last layers on the task-specific data.
4 EXPERIMENTS AND RESULTS
Many parameters affect the training and performance
of a machine-learning model like ours. A series of
experiments were done to find the best model param-
eters. The learning rate highly depends on other fac-
tors, so we tune it up and down in all tests to do a
grid search. The results reported on each sub-section
correspond to the learning rate that produces the best
numbers. The batch size is kept constant at 64, ex-
cept in Section 4.1.4, where the experiments demand
to change this value. The main evaluation metric em-
ployed is Accuracy, given by the fraction between
correctly classified trials and the total amount of tri-
als. For a given object (class) to be classified, we also
employ i) Precision (P), the fraction between True
Positives (number of correctly detected objects of the
class), and the total amount of trials labeled as be-
longing to the class, and ii) Recall (R), the fraction be-
tween True Positives and the total amount of trials that
belong to the class. Precision measures the proportion
of trials labeled as a given class that are really objects
of that class, whereas Recall measures the proportion
of objects of a given class that are correctly associ-
ated with that class. A single measure summarizing P
and R is the F1-score, which is their harmonic mean,
computed as F1=2×(P×R)/(P+R). Another way is the
confusion matrix, a table that provides the model pre-
dictions (x-axis) against the true prediction of an ob-
ject (y-axis).
Figure 4: Example of data augmentation methods (top: iso-
lated effect, bottom: combined effect on a single image).
4.1 Finding the Best Configuration
4.1.1 Data Augmentation
We first test different data augmentation methods
(Figure 4), to test if they allow to combat over-fitting
and help the models to better generalize against light
and camera changes. These data augmentation ex-
periments are the only ones carried out on the ini-
tial dataset with six classes that we gathered (Table 1,
top). In all the remaining sections, the later dataset
with five classes is employed. Because of that, the
test results cannot be compared directly, but we be-
lieve that the conclusions of this sub-section, i.e. us-
ing data augmentation, are still valid.
Experiments of this sub-section are done on real
data, using TrainSet/TestSet as train/test sets, with
80% of TrainSet used for actual training and 20% for
validation to stop training. Rotation (360
◦
), cropping
(0-30% in all sides), brightness change (50-120%),
and zooming (100-150%) are used. For these exper-
iments, the network is left with 32 unfrozen layers
at the end and a fully connected layer (before soft-
max) of 256 elements. The obtained accuracy with-
out/with data augmentation is 73.9/84.4%. Without
data augmentation, most misclassified images are ob-
jects that appear far away (small scale). This sug-
gests that zooming may have a significant effect on
model performance. It is well known that CNNs of-
ICPRAM 2023 - 12th International Conference on Pattern Recognition Applications and Methods
390
ten struggle to identify objects on different scales (Liu
et al., 2018). However, the model was trained with all
data augmentation methods applied together, so the
effect of individual changes was not explored. Given
these results, all subsequent models in the project
were trained with data augmentation
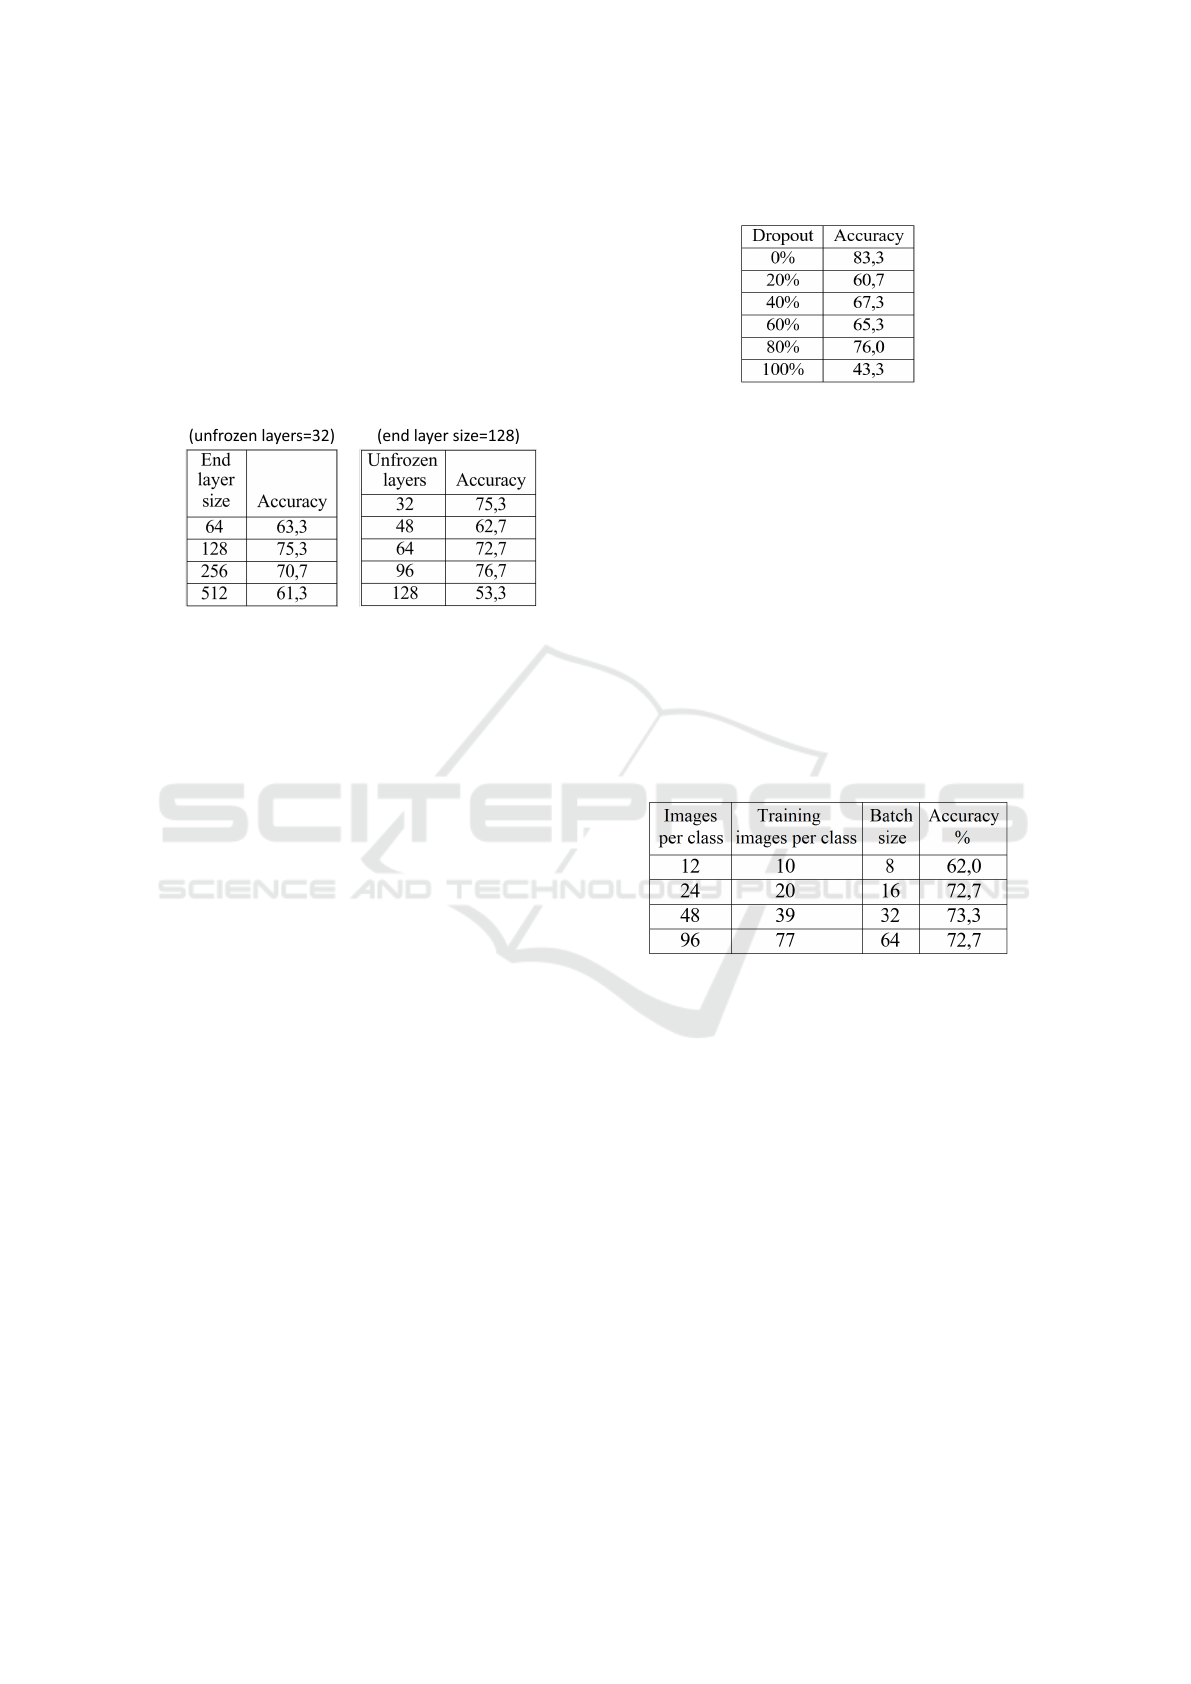
Table 2: Left: effect of changing the end layer size (un-
frozen layers set to 32). Right: effect of changing the num-
ber of unfrozen layers (end layer size set to 128).
4.1.2 ResNet Model Setup
Here, we test the optimal number of unfrozen lay-
ers left at the beginning of ResNet50, and the size
of the fully connected layer. Experiments are done
on real data, using TrainSet/TestSet as train/test sets
and 80/20% for actual training/validation. The more
layers are left unfrozen, the more a network is prone
to over-fitting if few training data is available, while,
while too few unfrozen layers may make the model
converge towards a lower accuracy. The size of the
end layer also has an impact on the network training
time and accuracy. Starting with 32 unfrozen layers
and an end layer size of 512, we first reduce the size
of the end layer by a factor of 2 (Table 2, left). A too
high-end layer size is seen to negatively affect accu-
racy. The model shows a significant improvement by
decreasing the layer size up to 128 and beyond that,
accuracy decreases again. We then set the size of the
end layer to 128 and increase the number of unfrozen
layers from 32 by a factor of 2 (Table 2, right). The
best result is obtained with 96 layers unfrozen (55%
of the network), and going beyond that hurts accuracy.
The difference between 96 and 64 layers unfrozen is
∼4%, but the model with 64 unfrozen layers (37% of
the network) has been observed to be more consistent
and less prone to over-fitting. Thus, the settings of 64
unfrozen layers and an end layer of 128 are identified
as the optimal settings of this subsection, which will
be used on all subsequent models.
4.1.3 Dropout
Dropout regularisation can help to make models more
general and reduce over-fitting, but too high dropout
Table 3: Effect of changing dropout.
might make the model converge towards a lower accu-
racy. We start with a dropout rate of 0% applied after
the fully connected layer, and then increased in steps
of 20% (Table 3). Experiments are done on real data,
using TrainSet/TestSet as train/test sets and 80/20%
for actual training/validation. The best result is ob-
tained when no dropout at all is applied, yielding an
accuracy of 83.3% on TestSet. One possible explana-
tion of this result is that we are using a feature vector
of 128 elements to classify only 5 classes, so dropout
is not providing any tangible benefit. This is quite
small compared to feature vectors of 2048 or 4096
elements, which are common in CNN architectures,
followed by a classification layer of 1000 elements
(e.g. in ImageNet).
Table 4: Effect of reducing the size of the training set.
4.1.4 Reduced Training Data
The TrainSet employed in previous subsections has
96 images per class. In an operational industrial sys-
tem, taking such amount of images per object that
needs to be sorted may be inconvenient. In this sub-
section, we will reduce the size of the training set to
48, 24 and 12 images per class to assess the practi-
cality of capturing fewer images vs its the effect on
accuracy. Accuracy is computed on TestSet. As we
decrease the amount of images per class, the mini-
batch size is also reduced, since models tend to learn
badly and overfit when the mini-batch size is too large
compared with the dataset size. Results are given in
Table 4. The change in accuracy between 96, 48 and
24 is negligible, which is positive for our purposes.
4.1.5 Synthetic Data
Products that need to be sorted for the manufactur-
ing industry likely have CAD models. Synthetic data
Synthetic Data for Object Classification in Industrial Applications
391
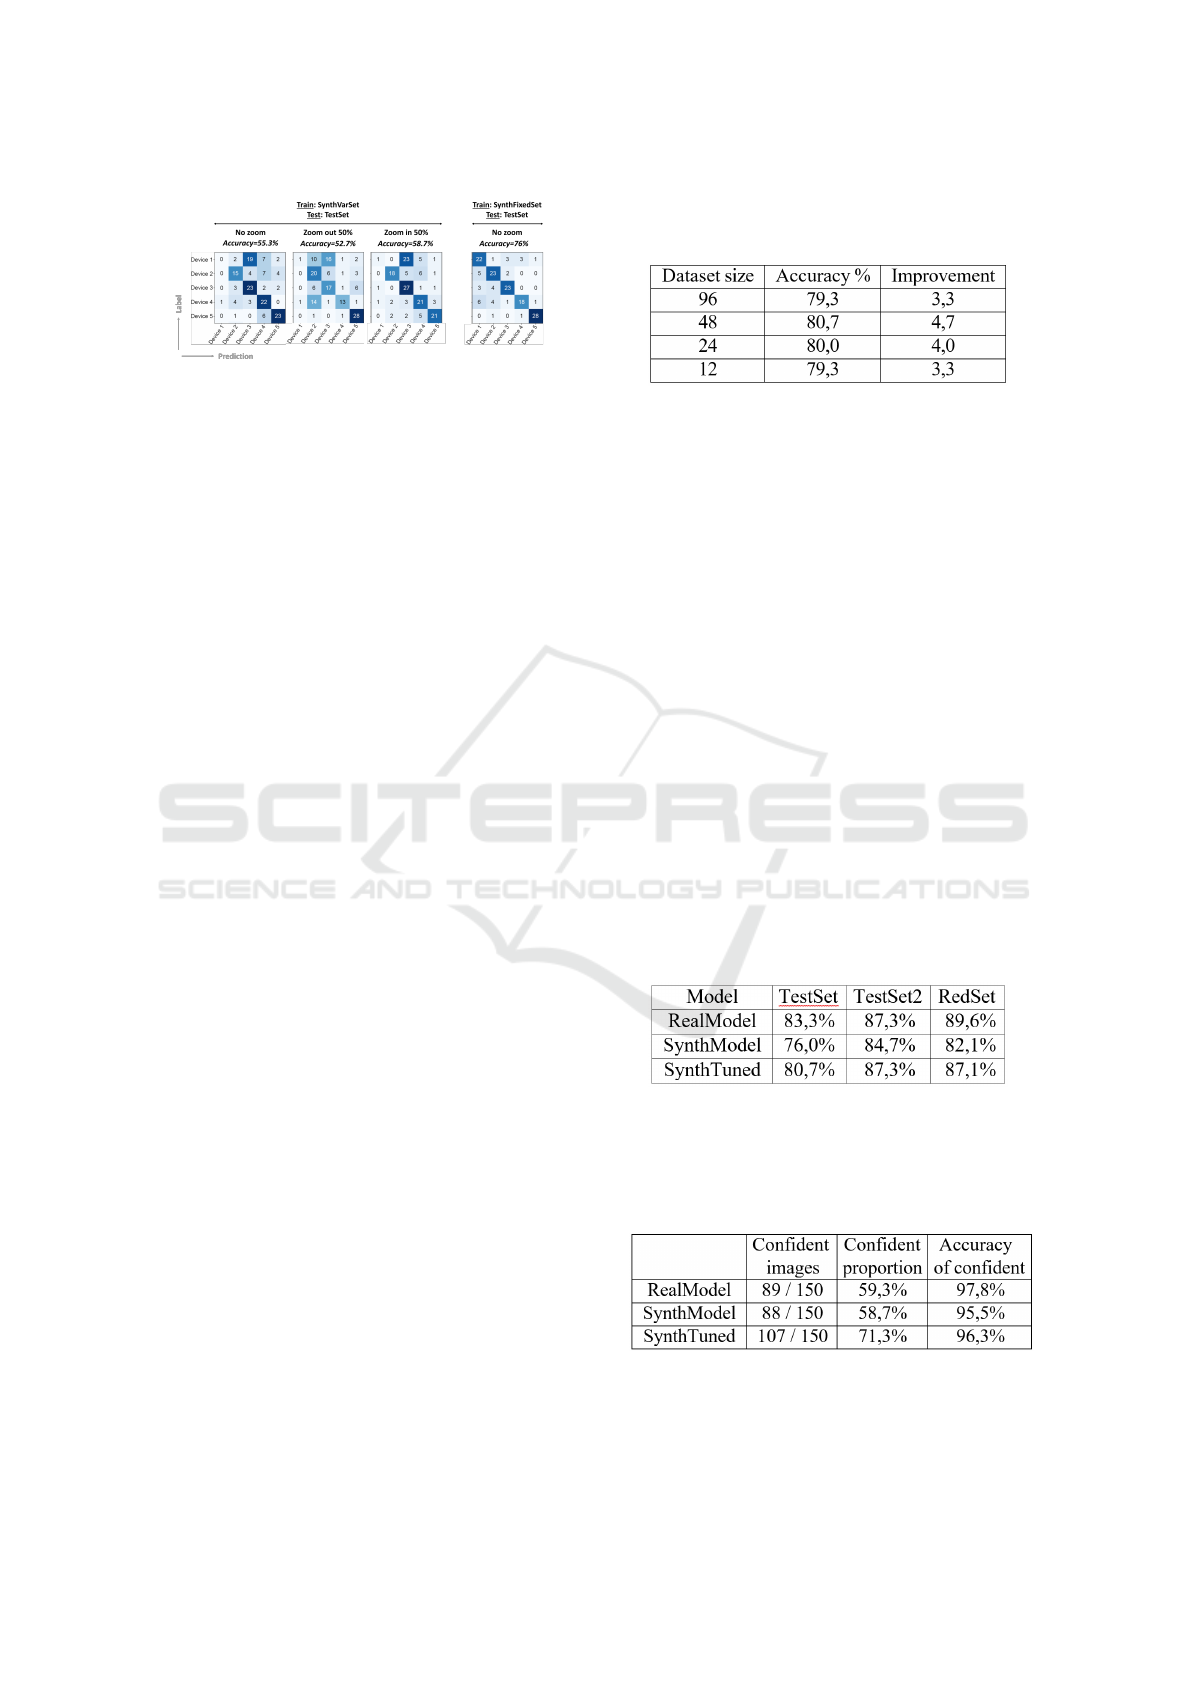
Figure 5: Synthetic model trained on SynthVarSet (left) or
SynthFixedSet (right) and tested on TestSet with different
scales.
generated from such models can be an alternative to
taking pictures of each object. A synthetic dataset can
be made many times larger, which can help against
over-fitting and make the models to generalize better.
We first train the model on SynthVarSet and com-
pute accuracy results on TestSet (Figure 5, left part).
The first sub-element (‘no zoom’) shows the results
with the original SynthVarSet and TestSet datasets.
As it can be seen, the model struggles with specific
objects (Device 2 and specially Device 1), which turn
out to be the smallest objects (see Figure 1). Recall
that in these two datasets, the objects appear with vari-
able scale (Figure 2 and Table 1). To check this scale
issue, the models were tested again on TestSet with
images zoomed out and in by 50%. As it can be seen,
this makes that different devices get better or worse
under zooming out or in. For example, Device 3 gets
better when zooming in, and worse with zooming out,
while Device 5 is the opposite. Also, Device 1 (the
smallest one) is mis-classified most of the times, no
matter in which option. The overall accuracy also in-
creases slightly with zooming in. Since the objects to
be detected fill a bigger portion of the image, this may
produce that the network is able to detect them better.
The model is then trained on SynthFixedSet (Fig-
ure 5, right). SynthFixedSet is generated in a way that
the scale is fixed, with objects filling the entire frame.
As it can be seen, this training provides the best bal-
anced accuracy among all objects, and the best overall
accuracy. Specially Device 1 (the smallest object) is
brough to a similar accuracy than the other devices,
very likely because now the object occupies a bigger
portion of the training images, so the network better
can ´see it’ when it appears smaller on images of Test-
Set. The overall accuracy on TestSet is 76%, with the
model trained on a synthetic dataset with 2000 images
per object. From the experiments of Section 4.1.4,
this size could likely be smaller without hurting per-
formance, although such option has not been tested.
Table 5: Effect of fine-tuning the model trained with syn-
thetic images of SynthFixedSet with real images of Train-
Set.
4.1.6 Real and Synthetic Data Mix
A model trained on a large synthetic dataset may learn
patterns from the synthetic data that do not apply to
reality. Fine-tuning the model on a small number of
real images may increase the real-world performance.
Another approach would be to combine synthetic and
real data during a single training round. However, the
size difference between our real and synthetic datasets
is large, which could prevent the real data from affect-
ing the results much if the images are mixed together.
To test our assumption, the best synthetic model
of the previous section (76% accuracy on TestSet) has
been retrained again on TrainSet with a lower learning
rate. We also carry out the same data reduction of
Section 4.1.4 and evaluate a size of 96, 48, 24 and
12 images per class. Results are shown in Table 5.
As it can be seen, this fine-tuning provides an extra
accuracy improvement, even with a small number of
images. The models with 24 and 12 images do not
perform much worse than those with 96 and 48, so
the synthetic model can be noticeably improved with
a small handful of real images.
Table 6: Accuracy of the best three models on different sets.
Table 7: Accuracy of the best three models on the Test-
Set2 dataset when predictions below 70% confidence are
discarded. ‘Confident proportion’ is the amount of images
with at least 70% confidence. ‘Accuracy of confident’ is the
accuracy after discarding images with less than 70% confi-
dence.
ICPRAM 2023 - 12th International Conference on Pattern Recognition Applications and Methods
392

4.2 Best Models’ Analysis
The best three models from previous sections are
brought here for further analysis. We name them as:
• RealModel: from dropout experiments of Sec-
tion 4.1.3, trained on real data (TrainSet).
• SynthModel: from Section 4.1.5, trained on syn-
thetic data (SynthFixedSet).
• SynthTuned: from Section 4.1.6, trained on syn-
thetic data (SynthFixedSet) and fine-tuned on real
data (TrainSet).
Their accuracy on several sets is summarized in
Table 6. As it can be observed, performance on Test-
Set2 is significantly better than on TestSet, with a no-
ticeable improvement with the models that use syn-
thetic data during training. A better performance on
TestSet2 can be expected since the objects occupy the
entire image, and the cluttered background is removed
(see Figure 2). To test which of the two components
(object size of background) are affecting the most, we
also report results on RedSet, which has objects with
variable scale but with a uniform red background. The
performance on RedSet appear to be on par with Test-
Set2, or even better with RealModel, suggesting that
eliminating a cluttered background has a more signif-
icant impact than normalizing the scale.
Comparatively, SynthTuned (trained on massive
synthetic data and fine-tuned on real data) has a per-
formance on-par with RealModel (trained on just real
data), so one may question the utility of the employed
synthetic data augmentation. However, accuracy does
not tell the full story of how well a model performs.
Even if an object is identified correctly, the confidence
of the classifier in such decision matters. Setting a
threshold on confidence is likely how an object clas-
sifier would be used in many practical scenarios. To
test the effect of such practice, we set a confidence
threshold of 70%, so decisions below this threshold
are considered ‘unsure’. Disregarding objects below
this confidence gives the results shown in Table 7. It
can be seen that the amount of trials on which the clas-
sifier is confident is substantially higher with Synth-
Tuned, revealing an important benefit given by adding
synthetic data to the training set. The overall accuracy
of the three models is in a similar range (96-98%), but
on SynthTuned, such entails a higher number of im-
ages that are actually classified correctly.
5 CONCLUSIONS
This paper has studied the utility of adding
synthetically-generated data to the training of object
detection models. One way to artificially create im-
ages is by a game engine, with many of the most
famous game engines providing libraries specifically
for synthetic data (Borkman et al., 2021; Qiu and
Yuille, 2016). We focus on industrial production set-
tings, where CAD models are often accessible for
manufactured parts, making possible to generate 2D
and 3D synthetic images of them. Synthetic images
can be rendered very quickly and effortlessly com-
pared to capturing real data, simulating a wide vari-
ability of viewpoints, illumination, scale, etc. In addi-
tion, the dataset can be auto-labeled, avoiding errors
in manual annotation, and the object’s position in the
image is known at pixel precision. It also offers many
more features that can be very hard to obtain with real
data, like 3D labeling, segmentation, and human key-
point labels (Borkman et al., 2021).
Here, we train a ResNet50 model pre-trained on
ImageNet to classify five different objects (Figure 1).
These are objects commercialized by the collaborat-
ing partner of this research, HMS Networks AB in
Halmstad. A dataset with images of each object
type from different viewpoints has also been acquired,
both of real and synthetic images (Figure 2) and with
different scales, illumination and background (Ta-
ble 1). We have conducted different experiments to
find the optimal setting of the classifier, including
data augmentation, number of frozen layers of the
network, size of the end layer, or dropout. We also
evaluated the impact of reduced training data and the
incorporation of synthetic data in the training set. The
latter is done by training the classifier first on a mas-
sive amount of synthetic data, and then fine-tuning it
on real data. Even if the overall accuracy of models
trained with synthetic+real data is on-par with models
trained with real data only, it has been observed that
the addition of synthetic data helps to increase confi-
dence in classification on a significant number of test
images. This is an important advantage in industrial
settings, where high confidence in the decision is crit-
ical in many situations. Another important contribu-
tion is that the amount of real data needed to fine-tune
the model is not very high to reach top accuracy (just
12-24 images per class), greatly alleviating the need
to obtain a substantial number of real images.
Scale or cluttered background has been identified
as two relevant issues. When making the objects fill
the entire image frame (thus removing the impact of
the background) or the background is set to constant
on the test data, a performance improvement is ob-
served (Table 6). Training on images where the ob-
ject fills the entire frame has also been shown to cope
with smaller objects in the test data that are other-
wise misclassified frequently (Figure 5). This work
Synthetic Data for Object Classification in Industrial Applications
393

has considered stationary objects in a relatively sim-
ple and well-lit environment. An obvious improve-
ment likely to appear in industrial settings is to al-
low motion between the camera and the objects, e.g.
due to conveyor belts. To do so, further research in
the detection and segmentation of moving objects is
necessary before presentation to the classifier. Pos-
sible solutions to this, depending on the scene com-
plexity, range from a traditional Mean Frame Sub-
traction (MFS) method to detect moving objects in
simple setups where the background remains static
for a long time (Tamersoy, 2009) to more elabo-
rated trained approaches such as RetinaNet (Lin et al.,
2020) or YOLOv4 (Bochkovskiy et al., 2020) object
detectors. The latter is more tolerant to changes in
scale, light, multiple objects, and motion, but often
they need more training data. This, however, could be
addressed with an approach based on synthetic data
like the one followed in this paper.
In a warehouse, new products are coming in all
the time. In our case, the classifier must be retrained
to recognize each new class. Other alternatives for
warehouses with many different products would be
expanding a classifier without retraining it (Schulz
et al., 2020). Using labels attached to products would
be another approach to identify objects. For example,
(Nemati et al., 2016) employs spiral codes, similar
in concept to barcodes, but detectable with any 360-
degree orientation (in contraposition to barcodes that
need to be properly oriented). However, this would
demand manual attachment of labels to the objects.
ACKNOWLEDGEMENTS
This work has been carried out by August Baaz and
Yonan Yonan in the context of their Bachelor Thesis
at Halmstad University (Computer Science and En-
gineering), with the support of HMS Networks AB
in Halmstad. Authors Hernandez-Diaz and Alonso-
Fernandez thank the Swedish Research Council (VR)
and the Swedish Innovation Agency (VINNOVA) for
funding their research.
REFERENCES
Al-Faraj, S. et al. (2021). Cnn-based alphabet identification
and sorting robotic arm. In ICCCES.
Bochkovskiy, A. et al. (2020). Yolov4: Optimal speed and
accuracy of object detection. CoRR, abs/2004.10934.
Borkman, S. et al. (2021). Unity perception: Generate syn-
thetic data for comp vis. CoRR, abs/2107.04259.
Femling, F., Olsson, A., Alonso-Fernandez, F. (2018). Fruit
and vegetable identification using machine learning
for retail applications. In SITIS.
Gyawali, D. et al. (2020). Comparative analysis of multiple
deep CNN models for waste classification. In ICAEIC.
Hachem, C. et al. (2021). Automation of quality control in
automotive with deep learning algorithms. In ICCCR.
He, K. et al. (2016). Deep residual learning for image
recognition. In CVPR.
HMS (2022). https://www.hms-networks.com.
Jung, H. et al. (2017). Resnet-based vehicle classif and lo-
calization in traffic surveillance systems. In CVPRW.
Karras, T. et al. (2021). A style-based generator architecture
for generative adversarial networks. IEEE TPAMI.
Lin, T. et al. (2020). Focal loss for dense object detection.
IEEE TPAMI.
Liu, Y. et al. (2018). Scene classification based on multi-
scale convolutional neural network. IEEE TPAMI.
Nemati, H. M., Fan, Y., Alonso-Fernandez, F. (2016). Hand
detection and gesture recognition using symmetric
patterns. In ACIIDS.
Nilsson, F., Jakobsen, J., Alonso-Fernandez, F. (2020). De-
tection and classification of industrial signal lights for
factory floors. In ISCV.
Persson, A., Dymne, N., Alonso-Fernandez, F. (2021).
Classification of ps and abs black plastics for weee
recycling applications. In ISCMI.
Qiu, W., Yuille, A. (2016). Unrealcv: Connecting computer
vision to unreal engine. In ECCVW.
Reddy, A. S. B., Juliet, D. S. (2019). Transfer learning with
resnet-50 for malaria cell-image classif. In ICCSP.
Richter, S. R. et al. (2016). Playing for data: Ground truth
from computer games. In ECCV.
Schulz, J. et al. (2020). Extending deep learning to new
classes without retraining. In SPIE DSMEOOT XXV.
Svanstr
¨
om, F., Englund, C., Alonso-Fernandez, F. (2021).
Real-time drone detection and tracking with visible,
thermal and acoustic sensors. In ICPR.
Tamersoy, B. (2009). Background subtraction. The Univer-
sity of Texas at Austin.
Tremblay, J. et al. (2018). Training deep networks with syn-
thetic data: Bridging the reality gap by domain ran-
domization. In CVPRW.
Wang, Y. et al. (2020). A cnn-based visual sorting system
with cloud-edge computing for flexible manufacturing
systems. IEEE TII.
Ward, C. M. et al. (2018). Ship classification from overhead
imagery using synthetic data and domain adaptation.
In IEEE OCEANS.
Xu, X. et al. (2021). Industry 4.0 and 5.0—inception, con-
ception and perception. Journal Manufacturing Sys.
Yosinski, J. et al. (2015). Understanding neural networks
through deep visualization. In ICMLW.
Zhu, J.-Y. et al. (2017). Unpaired image-to-image transla-
tion using cycle-consistent adversarial net. In ICCV.
ICPRAM 2023 - 12th International Conference on Pattern Recognition Applications and Methods
394
