
Temporal Constraints in Online Dating Fraud Classification
Harrison Bullock and Matthew Edwards
a
Department of Computer Science, University of Bristol, Bristol, U.K.
Keywords:
Concept Drift, Time Decay, Fraud, Online Dating, Uncertainty Sampling.
Abstract:
A number of automated systems attempt to combat online fraud through the application of classifiers created
using machine learning techniques. However, online fraud is a moving target, and cybercriminals alter their
strategies over time, causing a gradual decay in the effectiveness of classifiers designed to detect them. In
this paper, we demonstrate the existence of this concept drift in an online dating fraud classification problem.
Working with a dataset of real and fraudulent dating site profiles spread over 6 years, we measure the extent to
which dating fraud classification performance may be expected to decay, finding substantial decay in classifier
F1 over time, amounting to a decrease of more than 0.2 F1 by the end of our evaluation period. We also
evaluate strategies for keeping fraud classification performance robust over time, suggesting mitigations that
may be deployed in practice.
1 INTRODUCTION
Concept drift is a problem in machine learning clas-
sification, in which classifiers become less accu-
rate over time as the underlying data’s distribution
changes. Any subsequent fall in performance is
known as time decay. Concept drift often goes unex-
amined in classifier design due to temporal and spa-
tial biases in classifier evaluations. Temporal bias ex-
ists when a dataset is temporally inconsistent, which
means that the training and test sets are not chrono-
logically ordered, while spatial bias occurs when a
dataset is unrealistically balanced relative to the real
occurrence rates (Pendlebury et al., 2019).
In this paper, we investigate the presence and ef-
fect of concept drift for a novel application, namely,
an online dating fraud classification task. Online dat-
ing fraud, also referred to as romance scamming, is
a form of fraud in which a criminal entices a target
into an online romantic relationship using a false pro-
file, and then uses this relationship to extract money
from the target. In the US, the Federal Trade Commis-
sion reported losses of $537m in 2021 from romance
scams, up 80% from 2020 (FTC, 2022), a rapid in-
crease highlighting the urgent need for work tackling
this crime. Recent works have attempted to combat
this problem through a variety of classification ap-
proaches (Suarez-Tangil et al., 2020; Al-Rousan et al.,
2020; He et al., 2021; Shen et al., 2022). However, no
a
https://orcid.org/0000-0001-8099-0646
previous work on dating fraud classification has ad-
dressed the possibility of concept drift in deployment,
the speed or scale with which it may occur, or how it
may be mitigated.
In this work, we correct this gap and characterise
the temporal constraints relevant to dating fraud clas-
sification using a large dataset of over 100,000 dat-
ing profiles, including over 6,000 scam profiles, in an
evaluation window spread over 6 years of data. Using
the TESSERACT Python library (Pendlebury et al.,
2019), an example classifier for these scams is first
built and subsequently evaluated for concept drift un-
der constraints that correct for temporal and spatial
bias. Following that, two plausible mitigation strate-
gies – classification with rejection and uncertainty
sampling are then evaluated as solutions to make clas-
sification models more robust to concept drift and re-
duce the time decay in classifier performance.
2 BACKGROUND
2.1 Concept Drift
Concept drift, also known as concept shift or dataset
shift, occurs when the relationship between the in-
put and target variables changes between the training
dataset for a model and its deployment scenario. For
example, certain features of an Android application
may be reliably associated with a label of ‘malware’
Bullock, H. and Edwards, M.
Temporal Constraints in Online Dating Fraud Classification.
DOI: 10.5220/0011689000003405
In Proceedings of the 9th International Conference on Information Systems Security and Privacy (ICISSP 2023), pages 535-542
ISBN: 978-989-758-624-8; ISSN: 2184-4356
Copyright
c
2023 by SCITEPRESS – Science and Technology Publications, Lda. Under CC license (CC BY-NC-ND 4.0)
535

in a training dataset, but when running in the wild, a
model trained on such data may perform poorly. This
may occur because these features are no longer partic-
ularly associated with malware, as malware authors
have moved on from the techniques that produced
such a pattern. In other words, the concept of what
a safe Android application is has changed since the
model was trained. Concept drift has been described
as “the great elephant in the room for machine learn-
ing” (Webb et al., 2017), as it can considerably affect
the accuracy and reliability of applied machine learn-
ing models when deployed, meaning reported perfor-
mance figures from research results may be less trust-
worthy than expected.
Pendlebury et al. have created an open-source
evaluation tool for concept drift called TESSER-
ACT (Pendlebury et al., 2019), which includes a
Python library. Their paper examined the presence
of temporal and spatial bias, looking at three different
classifiers for Android malware detection (a support
vector classifier, a random forest, and a neural net-
work). These classifiers and their earlier published
work were believed to be temporally and spatially
biased. Pendlebury et al. define three constraints
that must be enforced for more realistic evaluations
(referred to as space-time aware evaluation), which
are (Pendlebury et al., 2019):
C1. Temporal Training Consistency, under which in-
stances in the training dataset must temporally
precede (i.e. chronologically come before) the in-
stances in the testing dataset.
C2. Temporal Testing Windows Consistency, under
which all instances in a testing window must be
from the same time slot. TESSERACT splits the
testing set into slots of fixed size. The exam-
ple provided is that a testing dataset of two years
could be split into slots of one month. This con-
straint states that each testing window should be
consistent, with all instances from the same time
slot. The user chooses the interval, but it should
contain a substantial number of instances in each
testing window. Pendlebury et al. suggest at least
1,000 instances in each window.
C3. Realistic Label Ratio in Testing, under which the
average percentage of class labels in each cate-
gory in a testing dataset should be close to the es-
timated distribution that would be seen in the real
world.
This literature also defines a time-aware performance
metric, Area Under Time (AUT), and an algorithm
that optimises classifier performance by adjusting the
class ratio of the training dataset. AUT is calcu-
lated as the area under a curve of point estimates of
performance scores (such as F1 scores) over time,
where each point estimate is for a different testing
slot (Pendlebury et al., 2019). We adopt AUT as
our primary evaluation metric in the experiments de-
scribed later in the paper.
Two techniques that may be applied to mitigate
the effects of concept drift are Classification with re-
jection and Uncertainty sampling. Classification with
rejection is a mitigation in which lower confidence
predictions are rejected (Bartlett and Wegkamp, 2008;
Barbero et al., 2020). Observations with a conditional
probability close to 50% (when a binary classification
problem) are the most challenging instances to clas-
sify. Therefore, a reject option can be used to express
doubt over these more uncertain examples (Bartlett
and Wegkamp, 2008). When these examples are re-
jected, they can be quarantined and manually classi-
fied.
Uncertainty sampling is a technique under which,
rather than refusing to label, class labels are requested
for uncertain instances. These instances are found by
using the prediction probabilities of an existing model
and are then used for retraining the classifier (Ku-
bat, 2017). The technique was originally proposed
as a methodology for situations where large quanti-
ties of labelled data are difficult to obtain. However,
it can also be used to mitigate the effects of concept
drift (Pendlebury et al., 2019).
2.2 Online Dating Fraud
Online dating is becoming more popular, and this in-
creased popularity has become an attractant for crime.
Online dating fraud started to attract research inter-
est in the 2010s (Rege, 2009; Whitty and Buchanan,
2012), but Huang et al. (2015) were the first to quan-
titatively study how romance scammers operated on-
line, using data from an undisclosed Chinese dating
site between 2012 and 2013. They found there were
four types of scammers, including a category they re-
ferred to as Swindlers, who establish a long-distance
relationship online, and after a certain amount of time,
request money from the victim. This form of romance
fraud is the one that most resembles that described by
Whitty & Buchanan.
Edwards et al. (2018) discussed indicators of dat-
ing fraud profiles such as reused profile elements and
common geographic origins, but it was Suarez-Tangil
et al. (2020) who first described an ensemble classi-
fier for automatically detecting profiles likely to be
romance scammers, using only passively-accessible
static profile elements. Since then, a variety of ap-
proaches have been attempted. Al-Rousan et al.
(2020) focused on the detection of celebrity images
ICISSP 2023 - 9th International Conference on Information Systems Security and Privacy
536
used in some scam profiles, describing a system us-
ing reverse image search mechanisms to reveal such
impersonation. He et al. (2021) described DatingSec,
which built upon the approach of Suarez-Tangil et
al. by additionally examining dynamic behaviour and
textual messaging features within data from the Chi-
nese dating app Momo, with promising results. Most
recently, Shen et al. (2022) have proposed a detection
approach grounded in a user trust model, which also
integrates both static and dynamic features to identify
the accounts used in online dating fraud.
3 BASELINE CLASSIFIER
3.1 Dataset
The data and methods used to extract and process the
dating fraud datasets were heavily influenced by pre-
vious work by Suarez-Tangil et al. (2020). Our study
aims to extend previous work to classify this fraud-
ulent activity to evaluate and mitigate the effects of
concept drift. It is not intended to be a heavy re-
working of the feature selection or classifier models
in these domains. It is also not intended to be a criti-
cism of previous work. The quality of previous work
has provided an in-depth understanding of classifica-
tion in these domains and has allowed particular pro-
cesses to be replicated.
The data was scraped from the websites https:
//datingnmore.com and https://scamdigger.com using
a slight modification of the method used by Suarez-
Tangil et al. (2020). 96,960 real dating profiles and
6,074 scam profiles were scraped and stored in JSON
format. To reduce the costs of training and evaluation,
only the demographic data from profiles were used in
these experiments. The data was cleaned following
the same process as described by the original authors,
with slight modifications for fields that have altered
format in the online data source.
There were rows of data that either did not have a
username or were duplicates. This duplication was
part of the original cleaning process, as particular
fields in the scam reports contain several options. By
way of example, the location given for a scam may
originally have been “New York, USA or Amsterdam,
Netherlands”, and this would create two instances in
the original cleaning process, a variant profile for each
location. We dropped these near-duplicate variants in
a process that consolidated the dataset and meant that
profiles with multiple entries in a field were not given
greater weight within the dataset. When doing this,
the first of the variant field values were kept in the
dataset. This did mean that some information was
lost, as, in this example, only the profile with New
York as the location would remain in the dataset.
The presence of timestamps is crucial when exam-
ining concept drift. Without them, we cannot evaluate
classifiers under the relevant constraints. Timestamps
were provided within the scam set, as the scamdig-
ger.com website has two fields that reflect the month
and the year that a scam was reported. For real pro-
files, however, there is no reported date (due to their
very nature of being genuine). As an appropriate
comparison date, the date a profile was last active was
scraped and used to create the timestamp field for real
profiles – this being how the real dating site user chose
to present themselves at a given date.
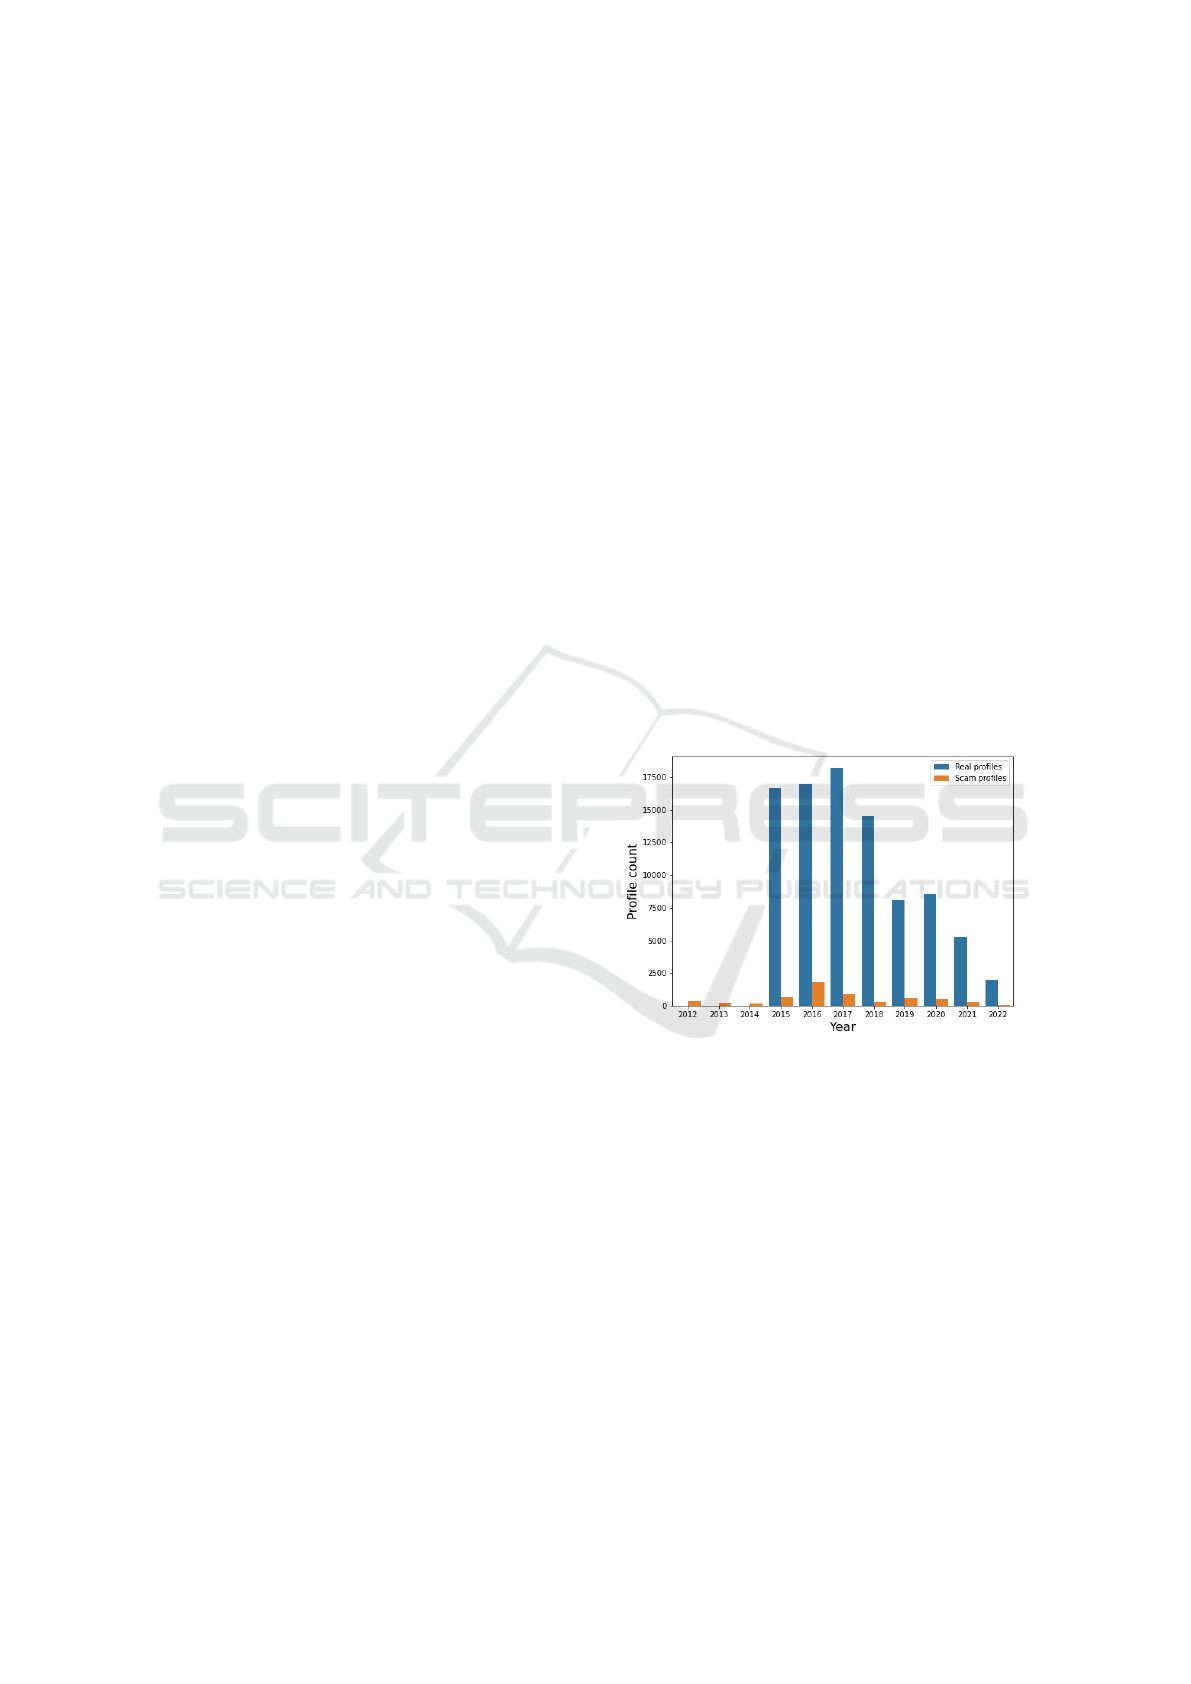
Figure 1 shows the real and scam profile counts
across different years. The visualisation highlights
several imbalances. Firstly, there is a lack of real pro-
files in earlier years, between 2012 and 2015. Con-
versely, there has been a relative lack of reported scam
profiles in recent years. An imbalance can also be
seen between the real and scam profiles, where ap-
proximately 6% of the profiles were scams in the orig-
inal downloaded data. This proportion is less than the
10% estimated in Sift’s research (Beldo, 2022).
Figure 1: Count of real and scam dating profiles.
3.2 Baseline Classifier
Suarez-Tangil et al. used an ensemble classifier. The
different classifiers within the ensemble used different
data sources, which fell under three categories: de-
mographics, images, and description (Suarez-Tangil
et al., 2020). We focus on a classifier using only the
demographic data in this study, with the hope that the
variety of fields used by the demographic classifier
would better enable us to typify any concept drift in
the fraudulent or real profile data. The original study
combined a random forest (RF) and naive Bayes (NB)
classifier to handle demographic data, since an RF
classifier does not work with missing values, but the
NB model can appropriately deal with them. Miss-
Temporal Constraints in Online Dating Fraud Classification
537

ing data is common in dating sites where users will
have ‘incomplete’ profiles because they have decided
not to fill in certain sections. After initial compar-
isons, we instead opted to use a histogram gradient
boosting classifier (HGBC), which is also capable of
handling missing values, and achieves good perfor-
mance (scikit-learn developers, 2022).
The HGBC was trained initially on a dataset with-
out any temporal or spatial bias constraints. The
dataset was split into training and test sets and fit-
ted using the training data – operating a grid search
with k-fold cross-validation to decide specific model
hyperparameters. These were the learning rate, the
maximum number of leaf nodes, and the maximum
number of iterations. K-fold cross-validation splits
the training set into k number of partitions, set to ten,
and trains the model on all but one partition. It is
then tested on the remaining fold, and this operation
repeats k times, leaving one partition out to test each
time. Scores are calculated as the average of the rel-
evant performance metric from these tests. A grid
search repeats the 10-fold cross-validation but uses a
different hyperparameter combination each time. The
best-performing combinations were used for training
the model, and then this model was scored on the
test dataset. The results in Table 1, while underper-
forming relative to Suarez-Tangil et al.’s full ensem-
ble model, show performance similar to that of their
individual demographics classifier, with an F1 score
of 0.77. The HGBC classifier has a lower recall than
precision, and just 70% of scam profiles in the test
dataset have been correctly identified.
Table 1: Performance metrics for the baseline HGBC clas-
sifier.
Precision Recall F1 Accuracy
0.85 0.70 0.77 0.98
This result is reasonably encouraging and will be
referred to as the baseline classifier. However, in de-
ployment in the real world, for how long can such
a performance result be trusted? This question is at
the heart of this paper’s investigation and will be ad-
dressed in the following sections.
4 CONCEPT DRIFT
EVALUATION
A key concern when evaluating a classifier under tem-
poral constraints is how to split the data into training
and testing windows. The classifier uses the training
window to learn and then is evaluated for each testing
window subsequently.
Table 2: Minimum outcomes of different training and test-
ing window lengths.
Training
time
(months)
Test
window
(months)
Min.
testing
window
sample
size
Min.
positive
cases
Min.
positive
ratio
12 1 303 0 0.00
12 3 1574 0 0.00
12 4 2099 77 1.78
12 6 3528 153 1.90
18 1 303 0 0.00
18 3 1574 0 0.00
18 4 1044 0 0.00
18 6 3528 153 1.90
24 1 303 0 0.00
24 3 1574 0 0.00
24 4 2099 77 1.78
24 6 3528 153 1.90
Different training and testing window length com-
binations are examined in Table 2. When deciding
the testing window length, a rule of thumb of at least
1,000 samples in a split (Pendlebury et al., 2019) is
enforced. The minimum testing window sample size
column gives information on whether this occurs in
all windows for each combination. Scam profiles
need to be present in all windows, so the minimum
positive cases column depicts if this is true. The min-
imum positive ratio is how low the ratio of scam pro-
files to genuine profiles could be. This ratio is mean-
ingful if it is changed by the spatial constraint to make
it closer to the in-the-wild ratio. Based on this re-
view, 18 months for the training set and 6 months for
the testing windows were deemed appropriate for this
task. These intervals ensured no less than 1,000 pro-
files and a reasonable number of scam profiles in each
testing window
With the training and testing window sizes de-
cided, the HGBC classifier was trained with the first
18 months of data (starting from 2015). We then
evaluated the dataset under the constraints of tempo-
ral training consistency and temporal testing windows
consistency (C1 & C2). Figure 2 indicates that con-
cept drift is present. There is time decay, as the classi-
fier’s performance reduces in subsequent six-monthly
periods, with the F1 scores dropping lower than the
previously reported figure of 0.77. The classifier’s
ability to correctly identify the scam profiles dimin-
ishes, scoring an AUT of 0.63. The recall and F1
scores fall to 0.45 and 0.51 in the ninth testing pe-
riod, four years after the initial training. This result is
crucial as it answers one of the critical questions: is
there concept drift present in the online dating fraud
classifier? The answer is yes – substantial drops in
performance can be seen over time.
ICISSP 2023 - 9th International Conference on Information Systems Security and Privacy
538
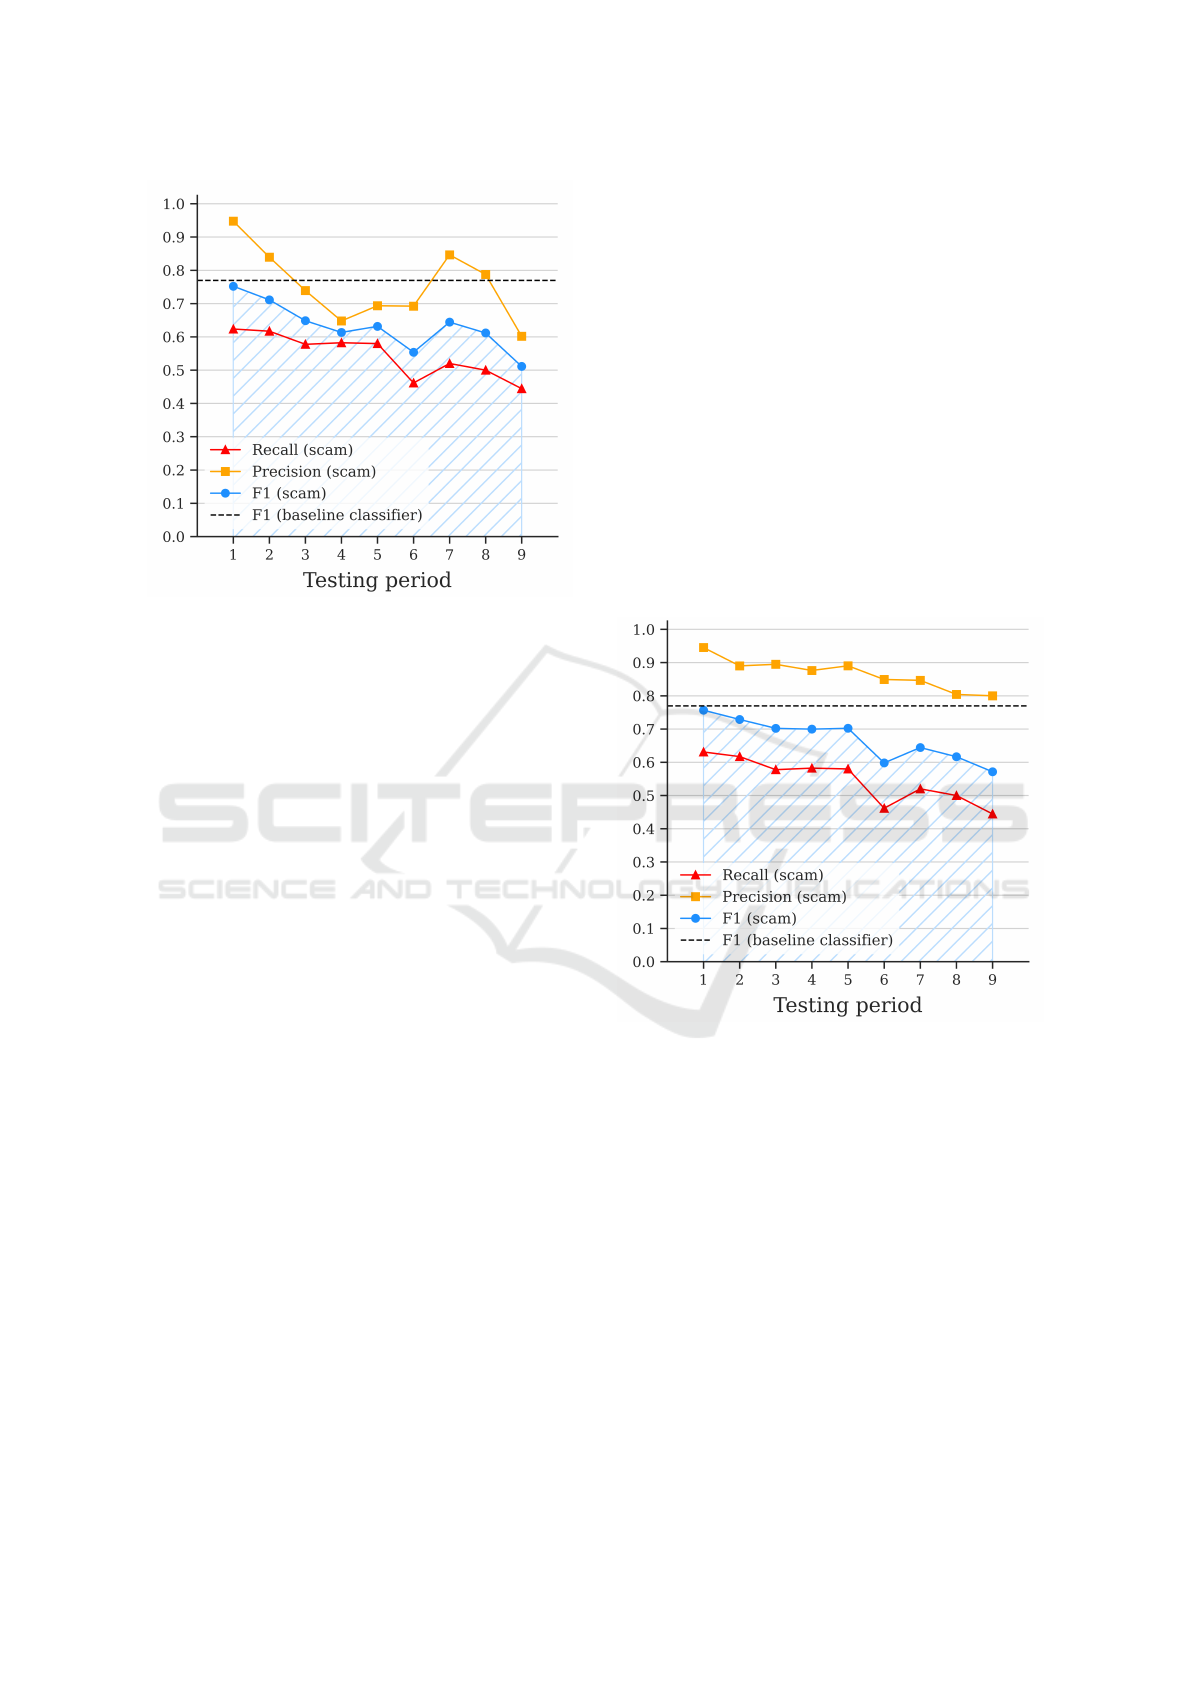
Figure 2: Evaluation of online dating fraud classification
with constraints C1 & C2.
The size of the datasets used for training reduces
under this evaluation methodology, as the baseline
classifier has the advantage of learning from more
data. It used over 70,174 samples, whereas the con-
strained classifier learned from 26,017 samples from
the first 18 months of the dataset (from 2015). The
performance of a classifier with no temporal con-
straints but with a similar amount of data can be
compared to the baseline classifier. The test scores
were similar to the baseline classifier when training
an HGBC model with a randomised split of around
26,000 instances. The F1 score for this comparison
classifier, trained on a smaller amount of data, was
0.76. This result suggested it is still a sufficient quan-
tity of data.
The previous results in Figure 2 did not include
the spatial constraint of a realistic label ratio in test-
ing. This additional constraint is included, where the
ratio is forced to be between 7.5% and 12.5% in the
testing windows. This range includes the 10% es-
timate of scam profiles from Sift’s research (Beldo,
2022). A caveat of using this estimate was that it
was the best research on the in-the-wild ratio that
could be found, but it is just one estimate and was
not tailored for the datingnmore.com population but
the wider online dating population. This constraint is
implemented by changing the sample size and down-
sampling the scam or real profiles until one of the
bounds of the range is met. To clarify, if 20% of
a testing window were scam profiles, they would be
downsampled until the proportion was 12.5%. If 2%
of the window were scam profiles, then the real pro-
files would be downsampled until 7.5% is the ratio
(this is the scenario encountered for most of the test-
ing windows for the online dating fraud dataset). The
AUT improved, rather than decreased, to 0.67 when
imposing this constraint. The difference can be ex-
plained by the lower number of real profiles tested for
many windows (with some downsampled to force the
sample ratio to 7.5%). A smaller magnitude of false
positives is reported, increasing the classifier’s preci-
sion since it decreases the number in the calculation
denominator (all else being equal - the true positives
do not change as the number of scam profiles remains
consistent in this scenario). This increase in precision
leads to a higher F1 score and AUT metric. The recall
is not affected in most windows, as this metric only
considers scam profiles and they are not downsam-
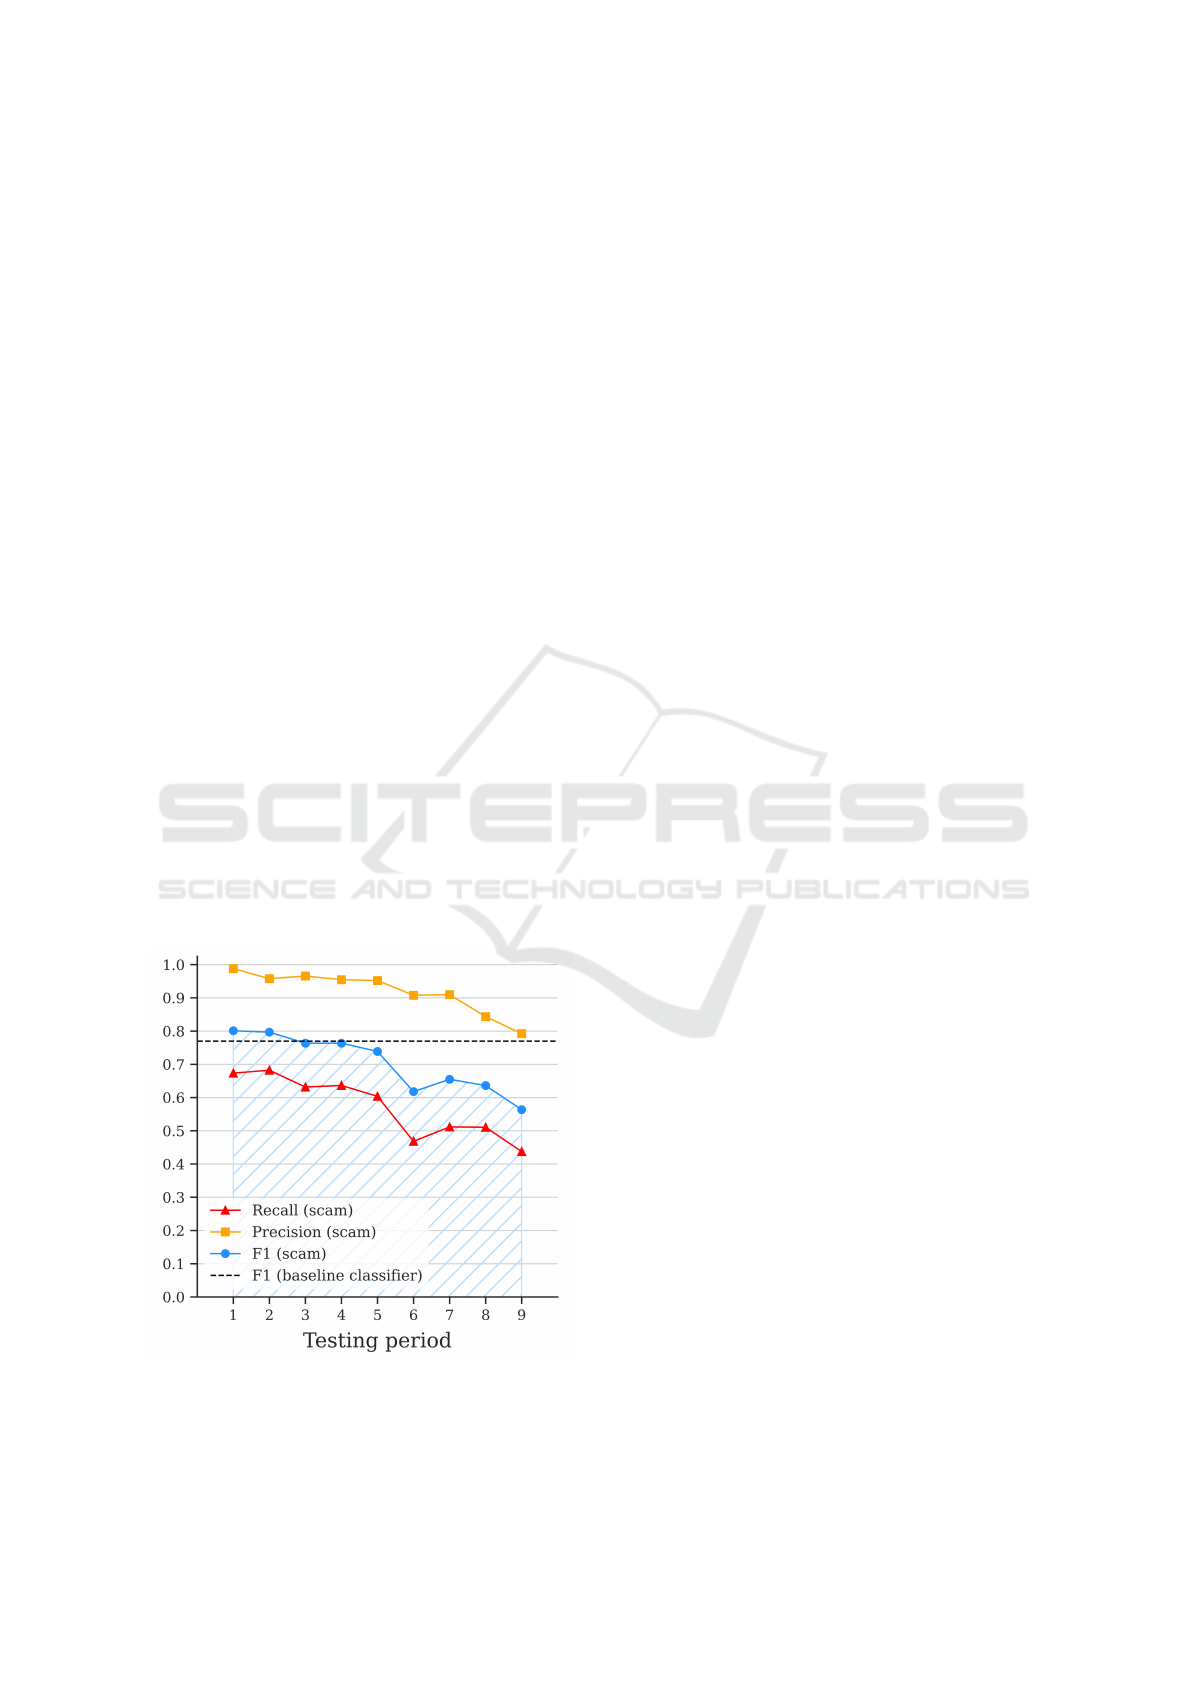
pled, apart from in the first testing window. Figure 3
demonstrates the revised impact under all three con-
straints, still presenting evidence of a substantial drop
in performance over time.
Figure 3: Evaluation of online dating fraud classification
with all three constraints (C1, C2 & C3).
To understand the dataset differences underlying
this performance drop, we made both visual and au-
tomated comparisons of the windows at the two most
different time windows. The comparisons were made
between the training window dataset (the first 18
months of data) and the ninth testing window dataset,
which is the last six months of the data in 2020. A
HGBC model was trained to distinguish between pro-
files from the two time windows but achieved only
poor performance (0.16 F1 for distinguishing the cor-
rect window for any profile, 0.32 F1 for distinguish-
ing the correct window for only scam profiles). The
differences between the profiles were not strongly evi-
dent in the distribution of demographic features: mar-
ital status, ethnicity and other factors appear to have
Temporal Constraints in Online Dating Fraud Classification
539
similar distributions in both the training window and
the final test window. One feature which did show
some variation was the ‘occupation’ field, in which
female scam profiles became relatively more likely to
report ‘self-employed’, ‘student’ or ‘military’ occu-
pations, while male scam profiles became more likely
to report occupations in ‘construction’. These dif-
ferences, together with possible alterations in the co-
occurrence patterns of other more stable demographic
features, could explain why the classifier performance
degraded. However, it is important to note that these
changes in the underlying data are small and difficult
to detect, and so any plan for mitigating the impact of
concept drift on classification will likely need to do
more than monitor cohort statistics.
5 CONCEPT DRIFT MITIGATION
Classification with Rejection: can mitigate the ef-
fects of concept drift. This technique looks at the clas-
sifier’s probability prediction for each testing example
and will reject those that fall below a chosen thresh-
old. Samples for which the HGBC prediction prob-
abilities fall below the rejection threshold are placed
into ‘quarantine’, offloading decisions on these sam-
ples to manual labelling. A higher rejection thresh-
old means more predictions are rejected. The trade-
off is that there is a higher cost to label the examples
that have been quarantined since it is a manual task.
Figure 4 displays the results when rejecting instances
with a predicted probability below 80%.
Figure 4: Evaluation under classification with rejection
(80%) (C1, C2 & C3).
Classification with rejection increases the AUT
metric to 0.71 but does not stop time decay. The ninth
testing period has an F1 score of 0.56, which com-
pares to 0.77 for the baseline classifier. The perfor-
mance is not a large improvement from the results
seen in the evaluation of the classifier without any
mitigation. It is interesting to note that only 1,785
testing instances out of 37,651 were rejected based
on this 80% threshold. The choice of 80% as the re-
jection threshold was arbitrary, and a higher rejection
threshold could improve the AUT performance of the
model, but with the trade-off of higher labelling costs
– rejection means the classifier is producing fewer
decisions, increasing the manual workload. Model
probability prediction also does not always translate
to expected outcomes; if the rejection threshold is set
to 95%, the AUT changes to 0.72. However, if it is set
to 99%, the AUT is 0.62 – worse than at 80%. There
is reason to believe that model probabilities can be
skewed towards high values (Jordaney et al., 2017),
suggesting that the gains from confidence-based re-
jection may be limited.
Uncertainty Sampling: extends beyond rejection
to create a process that can make the classifier more
robust to concept drift and involves retraining the
classifier with a subset of the most uncertain exam-
ples. A proportion parameter is used, and there is
a subtle difference between this method and classi-
fication with rejection. Classification with rejection
examines each example’s prediction scores and quar-
antines it if it falls below α%, where α is some pre-
determined threshold. With uncertainty sampling, the
predictions are first sorted by their highest prediction
probabilities. A subset containing β% of the most
uncertain instances is then used by the model to re-
train. If β were set to 100%, this would be an example
of complete incremental learning, where the model
would learn from all the labelled data in each period.
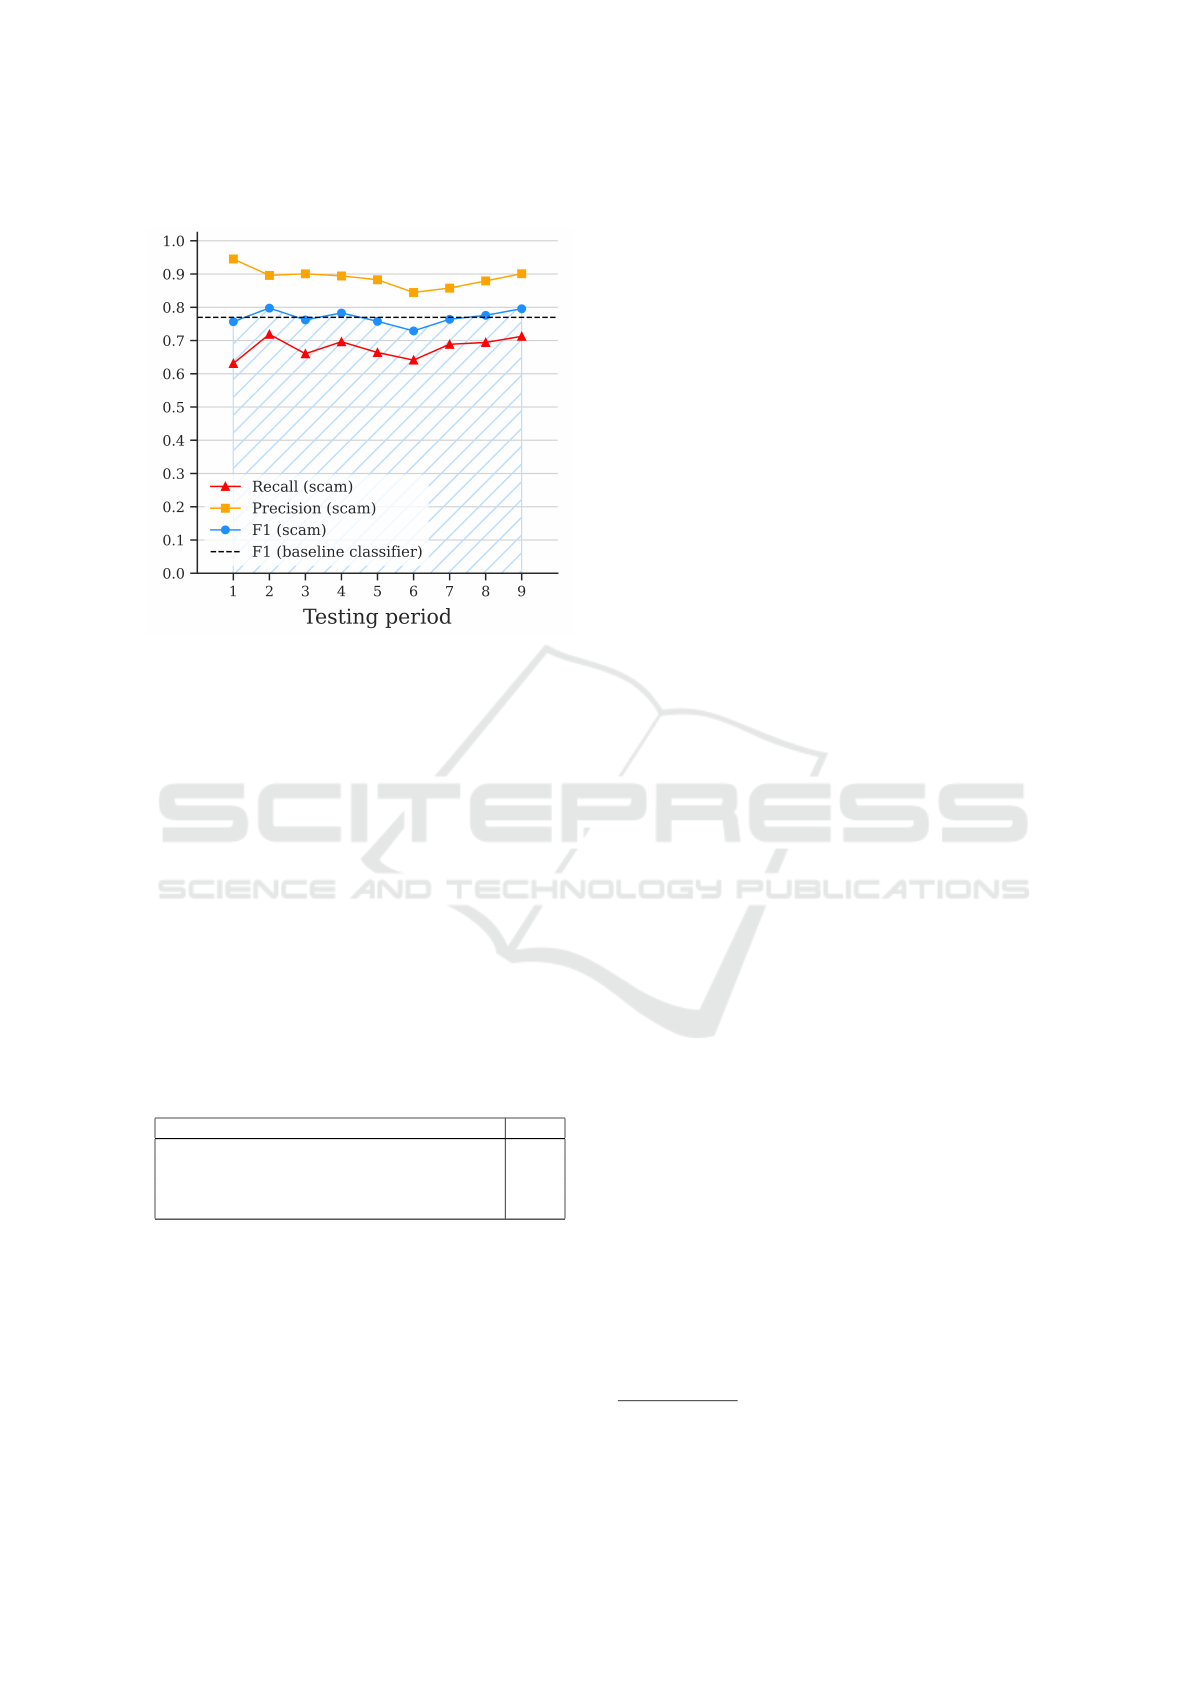
Under this method, the AUT metric improves to
0.77 when retraining with the 20% most uncertain
predictions. The visualisation in Figure 5 shows that
uncertainty sampling makes the classifier more robust
against a falling F1 score performance over time; its
trend is flat and close to the baseline level. As the
model is starting to learn from samples in each period,
it gives it a better chance to improve its recognition
of future scam profiles. The classifier now maintains
its performance to a level consistent with the baseline
classifier, which had an F1 score of 0.77. The 20%
was an arbitrary selection, but different subset sizes
were also tested. 5% can still achieve an AUT score
of 0.75, with the benefit that it requires a quarter of
the labelling compared to a level of 20%. This de-
cision regarding the appropriate level of sampling is
ICISSP 2023 - 9th International Conference on Information Systems Security and Privacy
540
best determined by the available resource.
Figure 5: Evaluation with uncertainty sampling (20%) (C1,
C2 & C3).
The AUT measures for our evaluations are sum-
marised in Table 3. Both the imposition of con-
straint C3 and each of our mitigation strategies in-
creased performance evaluated over time, with uncer-
tainty sampling displaying the highest AUT and the
least deviation from the performance established in
the baseline. However, it must be acknowledged that
uncertainty sampling in a deployment setting would
require a regular manual review of a sample of cases.
This poses a potential tradeoff for online dating sites
and similar platforms aiming to screen out fraud us-
ing automated means, and highlights the need for such
platforms to invest in reliable ground-truth-recording
mechanisms through both user fraud reporting and
manual review processes.
Table 3: Summarised AUT metrics for different constraints
and mitigation methods.
Method AUT
C1 & C2 0.63
C1, C2 & C3 0.67
C1–3 with classification with rejection (80%) 0.71
C1–3 with uncertainty sampling (20%) 0.77
6 CONCLUSION
Our central research question was assessing concept
drift and mitigating its effects in the domain of online
dating fraud. This is a serious problem, with growing
numbers of victims, and we ground our investigation
in a large real-world dataset. We find that substantial
declines in classifier performance can be seen across
the period covered by our testing windows. Our base-
line classifier is not intended to demonstrate state-of-
the-art performance levels, but rather to exemplify
how performance may decay over time in this do-
main, using features common to many current mod-
els (Suarez-Tangil et al., 2020; He et al., 2021; Shen
et al., 2022). We see that a classifier naively assessed
as performing at 0.77 F1 performs at 0.51 in the most
recent testing window when controlling for temporal
biases.
Similarly to Singh et al. (2012) in the domain of
malware, we find that the underlying shifts in the dis-
tribution of dating profile features are not easy to de-
tect or explain, highlighting that monitoring new data
may be insufficient protection for concept drift. We
evaluated two mitigation techniques and discovered
that classification with rejection does slow the decay
in performance over time, but does not halt it. Un-
certainty sampling, which involves the regular intro-
duction of new labelled data, is far more effective but
may pose operational concerns.
The practical takeaways from our work can be
summarised with two main considerations. Firstly,
online dating platforms need to be aware of this risk
wherever they may be deploying automated solutions
to prevent romance fraud, and should consider the
use of uncertainty sampling to guide their retrain-
ing methodology. Secondly, and more broadly, we
hope to demonstrate that concept drift is a measurable
problem for security and online safety classification
systems, beyond the specific domains in which it has
previously been established, and argue for the need
for temporal constraints to be more widely adopted as
checks on the robustness of detection and prevention
models. To give what support we might for this aim,
the code for this project is made publicly available as
a Github repository, to enable replication and future
comparisons
1
.
One requirement for temporal robustness checks
is the availability of a large, longitudinal dataset la-
belled for classification purposes. As part of our in-
vestigation we also attempted to investigate concept
drift in pet scams (Price and Edwards, 2020), but the
comparatively short period of time for which data was
available made the extent of any drift difficult to es-
tablish reliably. Other domains in which concept drift
might be a operational concern could also be suffering
from the lack of suitable data, meaning researchers
and developers willing to perform robustness checks
are not able to do so. Reliable access to well-designed
security datasets remains a crucial hurdle for many
1
https://github.com/hbu90/Online-dating-fraud-
classification-and-dataset-shift
Temporal Constraints in Online Dating Fraud Classification
541

technological developments in online safety and se-
curity.
REFERENCES
Al-Rousan, S., Abuhussein, A., Alsubaei, F., Kahveci, O.,
Farra, H., and Shiva, S. (2020). Social-guard: detect-
ing scammers in online dating. In 2020 IEEE Interna-
tional Conference on Electro Information Technology
(EIT), pages 416–422. IEEE.
Barbero, F., Pendlebury, F., Pierazzi, F., and Cavallaro, L.
(2020). Transcending TRANSCEND: Revisiting mal-
ware classification with conformal evaluation. arXiv
preprint arXiv:2010.03856.
Bartlett, P. L. and Wegkamp, M. H. (2008). Classification
with a reject option using a hinge loss. Journal of
Machine Learning Research, 9(8).
Beldo, S. (2022). What percentage of dating profiles
are fake? https://blog.sift.com/what-percentage-of-
dating-profiles-are-fake/, accessed 2022-10-18.
Edwards, M., Suarez-Tangil, G., Peersman, C., Stringhini,
G., Rashid, A., and Whitty, M. (2018). The geography
of online dating fraud. In Workshop on Technology
and Consumer Protection. IEEE.
FTC (2022). FTC data show show romance scams
hit record high; $547 million reported lost in
2021. https://www.ftc.gov/news-events/news/press-
releases/2022/02/ftc-data-show-romance-scams-
hit-record-high-547-million-reported-lost-2021,
accessed 2022-10-18.
He, X., Gong, Q., Chen, Y., Zhang, Y., Wang, X., and Fu, X.
(2021). DatingSec: Detecting malicious accounts in
dating apps using a content-based attention network.
IEEE Transactions on Dependable and Secure Com-
puting, 18(5):2193–2208.
Huang, J., Stringhini, G., and Yong, P. (2015). Quit play-
ing games with my heart: Understanding online dat-
ing scams. In International Conference on Detection
of Intrusions and Malware, and Vulnerability Assess-
ment, pages 216–236. Springer.
Jordaney, R., Sharad, K., Dash, S. K., Wang, Z., Papini, D.,
Nouretdinov, I., and Cavallaro, L. (2017). Transcend:
Detecting concept drift in malware classification mod-
els. In 26th USENIX Security Symposium (USENIX
Security 17), pages 625–642.
Kubat, M. (2017). An Introduction to Machine Learning,
volume 2. Springer.
Pendlebury, F., Pierazzi, F., Jordaney, R., Kinder, J., and
Cavallaro, L. (2019). TESSERACT: Eliminating ex-
perimental bias in malware classification across space
and time. In 28th USENIX Security Symposium
(USENIX Security 19), pages 729–746.
Price, B. and Edwards, M. (2020). Resource networks of pet
scam websites. In Proceedings of the Symposium on
Electronic Crime Research (eCrime). Anti-Phishing
Working Group.
Rege, A. (2009). What’s love got to do with it? Exploring
online dating scams and identity fraud. International
Journal of Cyber Criminology, 3(2).
scikit-learn developers (2022). Histgradientboostingclassi-
fier. https://scikit-learn.org/stable/modules/generated/
sklearn.ensemble.HistGradientBoostingClassifier.
html, accessed 2022-10-18.
Shen, X., Lv, W., Qiu, J., Kaur, A., Xiao, F., and Xia, F.
(2022). Trust-aware detection of malicious users in
dating social networks. IEEE Transactions on Com-
putational Social Systems.
Singh, A., Walenstein, A., and Lakhotia, A. (2012). Track-
ing concept drift in malware families. In Proceedings
of the 5th ACM workshop on Security and Artificial
Intelligence, pages 81–92.
Suarez-Tangil, G., Edwards, M., Peersman, C., Stringhini,
G., Rashid, A., and Whitty, M. (2020). Automati-
cally dismantling online dating fraud. IEEE Transac-
tions on Information Forensics and Security, 15:1128–
1137.
Webb, G. I., Lee, L. K., Petitjean, F., and Goethals, B.
(2017). Understanding concept drift. arXiv preprint
arXiv:1704.00362.
Whitty, M. T. and Buchanan, T. (2012). The online romance
scam: A serious cybercrime. CyberPsychology, Be-
havior, and Social Networking, 15(3):181–183.
ICISSP 2023 - 9th International Conference on Information Systems Security and Privacy
542
