
Model-Driven Optimisation of Monitoring System Configurations for
Batch Production
Andreas Margraf
1 a
, Henning Cui
2 b
, Simon Heimbach
3
, J
¨
org H
¨
ahner
2
, Steffen Geinitz
1
and Stephan Rudolph
3
1
Fraunhofer IGCV, Am Technologiezentrum 2, 86159 Augsburg, Germany
2
Institute for Computer Science, University of Augsburg, Am Technologiezentrum 8, 86159 Augsburg, Germany
3
Institute of Aircraft Design, University of Stuttgart, Pfaffenwaldring 31, 70569 Stuttgart, Germany
Keywords:
Engineering Automation, Graph-Based Design Language, Machine Vision, Algorithm Selection.
Abstract:
The increasing need to monitor asset health and the deployment of IoT devices have driven the adoption
of non-desctructive testing methods in the industry sector. In fact, they constitute a key to production effi-
ciency. However, engineers still struggle to meet requirements sufficiently due to the complexity and cross-
dependency of system parameters. In addition, the design and configuration of industrial monitoring systems
remains dependent on recurring issues: data collection, algorithm selection, model configuration and objective
function modelling. In this paper, we shine a light on impact factors of machine vision and signal processing in
industrial monitoring, from sensor configuration to model development. Since system design requires a deep
understanding of the physical characteristics, we apply graph-based design languages to improve the decision
and configuration process. Our model and architecture design method are adapted for processing image and
signal data in highly sensitive installations to increase transparency, shorten time-to-production and enable de-
fect monitoring in environments with varying conditions. We explore the potential of model selection, pipeline
generation and data quality assessment and discuss their impact on representative manufacturing processes.
1 INTRODUCTION
The growing use of automation, non-desctructive sys-
tems (NDT) and optical sensors raises the need for
highly accurate yet efficient machine vision solutions.
While the algorithmic perspective of monitoring sys-
tems has been addressed by a highly dynamic com-
munity around the field of Artificial Intelligence (AI),
only little research has been conducted to bridge the
gap between system design and algorithm configu-
ration. This paper proposes a model-driven frame-
work for selecting architectural synthesis of machine
vision systems according to technical requirements
for a given monitoring task. For the realization of
this framework, a graph-based design language is uti-
lized, a tool, that allows for the automation of large
parts of an engineering design process. Modeled after
human languages, they use vocabulary and rules to
create a design language grammar. Each valid com-
bination of words then forms a variant of the prod-
a
https://orcid.org/0000-0002-2144-0262
b
https://orcid.org/0000-0001-5483-5079
uct. The execution of the abstract rules of the design
grammar and the domain-specific model is performed
by translations of the model using a design compiler
(Alber and Rudolph, 2004). Beyond that, we discuss
methods to select the most promising and efficient al-
gorithms besides the popular Deep Neural Networks
(DNN).
The spread of large systems with interactive be-
havior renders them more difficult to manage, while at
the same time they exhibit partly unexpected emerg-
ing behavior. A computing paradigm denoted Or-
ganic Computing (OC) is set out to equip systems
with so-called self-x properties, e.g. self-healing, self-
configuring and self-adapting (M
¨
uller-Schloer and
Tomforde, 2017). The vision of OC is highly focussed
on the idea to incorporate nature-inspired algorithms
to allow for a self-organization in dynamically chang-
ing requirements (Schmeck et al., 2010). This study is
intended to incorporate OC principles into the process
of monitoring system design and configuration.
While engineering design usually builds on infor-
mal textual representation, system variants are typi-
cally created by domain experts without predefined
176
Margraf, A., Cui, H., Heimbach, S., Hähner, J., Geinitz, S. and Rudolph, S.
Model-Driven Optimisation of Monitoring System Configurations for Batch Production.
DOI: 10.5220/0011688900003402
In Proceedings of the 11th International Conference on Model-Based Software and Systems Engineering (MODELSWARD 2023), pages 176-183
ISBN: 978-989-758-633-0; ISSN: 2184-4348
Copyright
c
2023 by SCITEPRESS – Science and Technology Publications, Lda. Under CC license (CC BY-NC-ND 4.0)

design decisions. A design variant is considered valid
as long as it is consistent with the requirements. Due
to the physical complexity, alternative design variants
are never explored. In addition, the process chain is
confronted with gaps and discontinuities, which pre-
vents an efficient exploration of the solution space.
The approach proposed in this study intends to bridge
that gap by providing a formal model-based transfor-
mation chain that generates an executable represen-
tation of the system according to predefined require-
ments. Although the potential of machine learning for
real-world applications remains undisputed, the setup
stage of industrial monitoring sensors requires great
human effort due to extensive configuration and adap-
tation. In the context of the challenge imposed on a
monitoring system, we pledge to explore the follow-
ing research questions (RQ):
RQ1: How can graph-based design languages re-
duce the factor of uncertainty in monitoring sys-
tem development?
RQ2: Which are the limiting factors that impede al-
gorithm development in an application environ-
ment?
RQ3: How can the gap between a lab-based and
real-world environment be narrowed?
These questions were previously discussed as part
of Automated Design of Processing Pipelines (ADPP)
(Stein et al., 2018) which has been proposed for im-
age segmentation, interpretation and signal filtering,
cf. (Margraf et al., 2017b; Hammami et al., 2018).
While ADPP optimizes the combinations of opera-
tors, this study will mainly discuss the development
of monitoring systems designed to acquire data.
The remainder of this work is structured as fol-
lows:
Sec. 1 starts by introducing graph-based design
concepts in monitoring system development, before
giving an overview on related work in Sec. 2. Sec.
3 describes the model-based approach for system de-
sign and configuration before testing it on related real-
world use cases in Sec. 4. In Sec. 4.2, we critically
reflect on our model and discuss the results for indus-
trial applications. We conclude on our findings in Sec.
5 and give a short outlook on future work.
2 RELATED WORK
The following section gives an overview on related
fields of research and previous work that inspired this
paper:
The application of grammars inspired by formal
languages proved useful for the development of de-
scription languages for engineering design objects as
shown by Alber et al. (Alber and Rudolph, 2004).
Furthermore, Walter et al. proposed a process chain
that automatically generates state machines from re-
quirements for system designs to provide an exe-
cutable system model (Walter et al., 2019). Neumaier
et al. used graph-based languages to generate the pipe
structure for landing gear design (Neumaier et al.,
2022).
State-of-the-art monitoring systems are equipped
with machine learning algorithms which have been
developed over several decades for signal process-
ing, image segmentation, natural language processing
and classification (Schmidhuber, 2015). Several sci-
entific publications between 2010 and 2015 marked
a turning-point in deep learning research: transfer
learning significantly improved model accuracy, as
shown in related studies (Lin and Jung, 2017; Tan
et al., 2018), while data augmentation helped to en-
large training data as presented by Mertes et al. for
defects in fibre textiles (Mertes et al., 2022).
To the best of our knowledge, graph-based design
languages have not been applied before for generating
monitoring system designs as proposed in this study.
While heuristic-driven approximation allows to bet-
ter generalize under uncertainty, our approach offers
interpretable solution paths and detailed documenta-
tion but rules out unexpected behaviour. The depth
of the solution space can be adapted to the engineer-
ing domain. However, complex applications require
an elaborated analysis and a far-ranging technical un-
derstanding modeling the physical constraints accord-
ingly.
The aforementioned publications cover the most
relevant topics of the field of research but serve as a
summary to the reader and therefore cannot guarantee
completeness.
3 GRAPH-BASED COMPONENT
AND ALGORITHM SELECTION
In this paper, we propose a novel, innovative
framework for developing monitoring solutions us-
ing graph-based design languages. Our concept is
deemed to improve efficiency of signal and image
segmentation in the context of industrial quality mon-
itoring. We take a bottom-up approach to the selection
of sensors, components and filter algorithms, which is
referred to as ‘Monitoring Architecture and Algorithm
Selection (M-AAS)’.
Model-Driven Optimisation of Monitoring System Configurations for Batch Production
177

A B C
(a) Graph G
A
L:
B
(b) Pattern graph L
X
R:
(c) Replacement graph R
X C
(d) Modified graph H
Figure 1: An example graph G, a replacement rule and its
modified graph after the rule has been applied.
3.1 Graph Rewriting and Model
Transformation
Let G = (V,E) be a connected (un)directed graph with
vertex set V and edge set E. The solution of any opti-
mization problem on G corresponds to some subset of
vertices V
′
⊆ V or subset of edges E
′
⊆ E. A graph
rewriting system consists of a set M of rewrite rules
p : L → R, with L being the pattern graph and R be-
ing the replacement graph. A graph rewrite rule p is
applied to the host graph G by searching for an oc-
currence of the pattern graph L and by replacing the
subgraph by an instance of the replacement graph R.
The search for the occurrence of L in G, known as
isomorphism, is solved using a pattern matching al-
gorithm. Graph H represents the modified graph as
a result of the application of a graph rewrite rule p,
formally known as: L
p
−→ R. As can be seen in Fig.
1, given host graph G and using rewrite rule p returns
graph H. Rewrite rules can be further regulated in
the case of labelled graphs, such as in string-regulated
graph grammars.
Each node in a graph is set to represent a re-
quirement, component, function or a solution princi-
ple. In our framework, the design language is based
on the Unified Modeling Language (UML). The key
components of a graph-based design language are the
vocabulary, the set of rules and the production sys-
tem. While the vocabulary is modeled in a UML
class diagram, the rules are represented as Model-to-
Model (M2M) or Model-to-Text (M2T) transforma-
tions. An activity diagram defines the production sys-
tem workflow. The result graph H, which we refer
to as design graph, is generated during compilation
when the design language is applied. It is then vi-
sualized in an UML instance diagram. For further
use, the design graph can be mapped into domain-
specific languages by software plug-ins for e.g. trans-
lation to CAD models. M-AAS allows the generation
of variants based on models and rule sets combined,
which is why mere model translations, e.g. through a
QVT (Query/View/Transformation) approach, would
not be sufficient. The M-AAS approach is performed
over three stages:
(1) Assign specific values or value ranges to each in-
put node (problem understanding)
(2) Search for a valid system composition and algo-
rithms with respect to rules (formal dependencies,
constraints)
(3) Configure and optimize the suggested algorithms
The parameters for stage (1) have to be requested
from domain experts or users. This first step is con-
sidered decisive; it is usually the origin of miscon-
ceptions and faulty system designs when carried out
without guidelines. Therefore, this part of the M-ASS
approach is developed with regard to the guidelines
by VDI/VDE
1
no. 2632 for machine vision design
(VDI/VDE, 2015) and ISO 8758 (ISO, 1998).
In stage (2), we apply the aforementioned graph
transformation using the rule set. All rules are mod-
eled as part of activity diagrams and contain context-
specific constraints and formal dependencies as ex-
plained in Sec. 3.3. Stage (3) covers the fine-tuning
of algorithm configurations, depending on the output
reflected in the design graph. Details of algorithm
tuning are not part of this study. At first, the system
requirements have to be documented by specific met-
rics and definitions. In light of the aforementioned
workflow, the following section offers an overview
of methods to meet its challenges and explains the
details of M-AAS. From the model perspective, each
edge E is derived from an object instance; the ob-
jects are created as soon as the collection of input
parameters, derived from the requirements collection,
has been applied. All objects are created according
to the class diagram as shown in Fig. 2 and 4. As
a result, the framework provides a use-case specific
system architecture with components and processing
units as well as suitable segmentation and classifica-
tion models. Any unforeseen changes can be fed into
the framework upon request and optimization can be
performed repeatedly.
3.2 Requirements Analysis
At the start of the monitoring system design process,
the inspection task needs to be converted to a set of
requirements. Solving the trade-off between target
performance and hardware is heavily dependent on a
precise understanding of the inspection task. The in-
spection task depends on the following criteria: task
1
German Association of Engineers
MODELSWARD 2023 - 11th International Conference on Model-Based Software and Systems Engineering
178
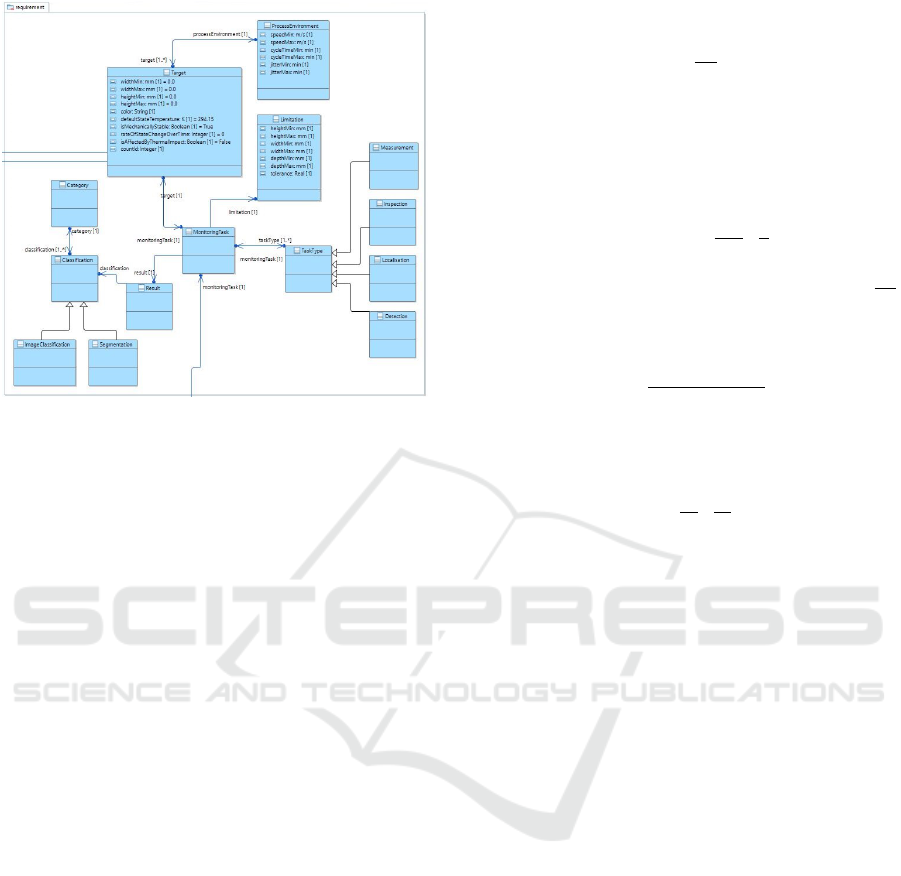
Figure 2: Model view of a typical industrial inspection task;
this model represents a high-level perspective on the prob-
lem domain, but reveals dependencies between requirement
values and possible system components and algorithms.
category, difficulty, complexity and context-invariant
representation. For image processing, task categories
can be divided into five major types of processing: a)
image classification, b) object detection, c) semantic
segmentation, d) instance segmentation, e) panoptic
segmentation. For sources offering time series or sig-
nal flow data, classification and segmentation tasks
comprise the following categories: a) signal classi-
fication, b) instance detection, c) outlier or anomaly
detection, d) change point detection.
For the application assessment, we collect the fol-
lowing parameter range [min,max]:
• the scan area width l
scan
and height h
scan
• the space dimension width l
Space
, height h
Space
and depth d
Space
• cycle time CT
• production speed v
p
• inspection object width l
ob j
and height h
ob j
The graph rewriting and model transformation can be
successfully executed if the requirement data is valid.
3.3 System Design Rules Derived from
Physical Laws
For the camera system, we define the parameters as
follows:
According to the Nyquist-Shannon sampling the-
orem, at least twice the sampling rate B is required to
sufficiently approximate the original signal f
s
(Shan-
non, 1948):
f
s
>
1
2B
For the system design, we define the nyquist factor
nyq = 10 for measurement and nyq = 3 for inspection
tasks. Additionally, the sensor resolution equals the
object space resolution ξ and depends on tolerance t
and interpolation i as follows, cf. (Smith, 2000):
ξ
ob ject space
=
t
nyq
·
1
i
For i = 1 this can be shortened to: ξ
ob ject space
=
t
nyq
The sensor pixel size (s
p
) depends on object width
W
ob j
and object space resolution ξ as follows:
s
p
=
max(l
ob j
,h
ob j
)
ξ
ob ject space
The sensor frequency f
s
depends on production speed
v
p
, resolution r
c
and sensor pixel size s
p
and is defined
as follows:
f
s
=
v
p
r
c
·
1
s
p
The minimum bandwidth W
min
depends on bit size
(i.e. number of bits) b and s
p
in the following manner:
W
min
= s
p
· f
s
· b
Moreover, the specifications of optical systems are de-
termined on the basis of the parameters image size
y
′
(by default 1/3
′′
), (real) target size (and width) y,
working distance a and focal length f
′
o
. The character-
istics for the optics component are defined as follows:
f
′
o
= a/(y/y
′
+ 1)
y = y
′
· (a/ f
′
o
− 1)
a = f
′
· (y/y
′
+ 1)
y
′
= y · f
′
/(a − f
′
o
)
Parameter f
′
o
constitutes a minimum requirement that
applies to specific optics. Furthermore, the con-
straints for y and vector of space dimensions a are
defined as follows:
y ≥ max(l
ob j
,h
ob j
)
a = min[w,h,l] ∧ a ≤ (l
space
,h
space
,d
space
)
The real-time frame T F is defined as the difference
between the cycle time CT and jitter J:
T F = CT − J
All formulas listed here represent the core part of the
rule set that defines the model transformation of the
monitoring system design.
Model-Driven Optimisation of Monitoring System Configurations for Batch Production
179
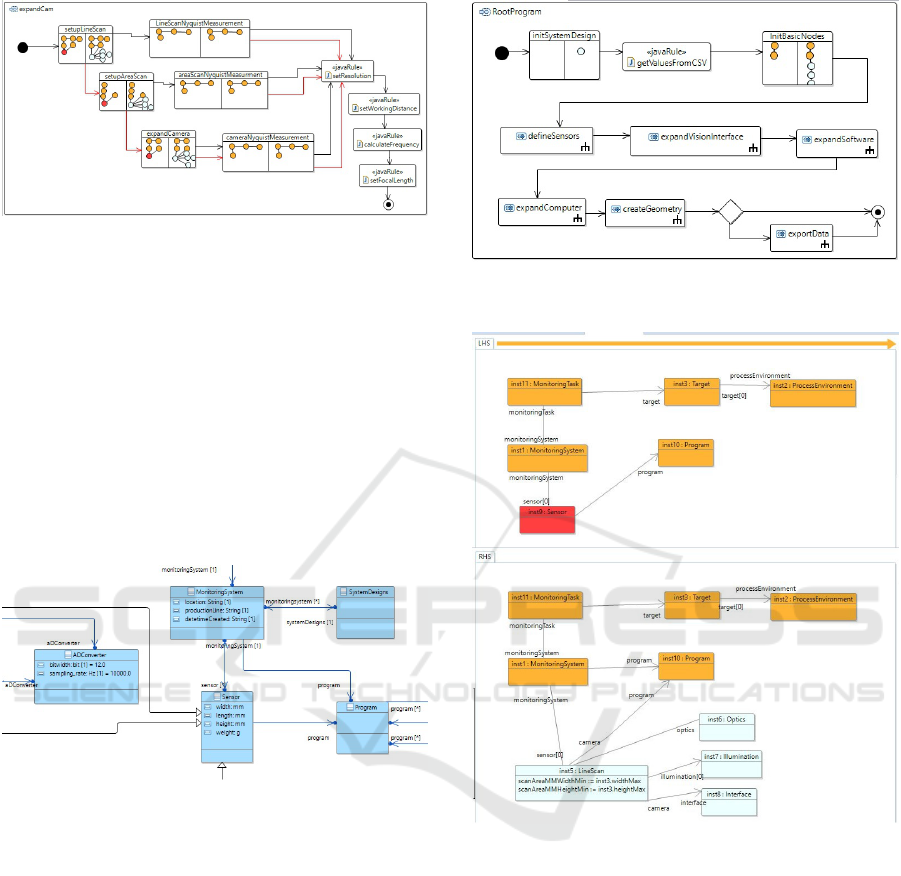
Figure 3: Rule set for camera and optics.
3.4 Component and Algorithm
Modelling
As can be seen in the model in Fig. 4, a machine vi-
sion system consists of the following parts: sensor, il-
lumination, communication interface, computer, pro-
cessor and a program for data processing.
Since stage 2 suggests a high level representation
of the system, there is still room for optimization in
each node. At this stage, only nodes that contain sen-
sor types or periphery compatible to the system re-
quirements remain in the result graph.
Figure 4: Model view of the superordinate architecture
model of a monitoring system.
For applications that require a camera-based sys-
tem, the sensor class is replaced by a camera object
(LineScan or AreaScan) and included in the graph as
a node. The model also considers analogue signals,
i.e. vibration and weight which requires accelerom-
eters or piezoelectric sensors. A sample transforma-
tion rule for the camera component is given in Fig. 3
(expandCamera): if the requirements suggest optical
monitoring, a camera node is instantiated. Accord-
ing to the model, the camera node contains parame-
ters that determine its state and functionality. This in-
cludes sensor frequency f
s
, which is calculated based
on cycle time, scan range and resolution s
p
. The
rule set also determines the details of the optics node
which contains parameters f
′
o
, y and a. The physical
basis for all of these parameters is elaborated in Sec.
3.3.
Figure 5: Root activity diagram that defines the order of rule
transformation on the graph.
Figure 6: Graph rewrite rule defining the replacement of
a sensor node with a line scan camera and related compo-
nents.
In addition, the model allows to equip the com-
puter with an FPGA chip. The graph is then expanded
with logic for signal processing which is later ex-
ported to VHDL code for the synthetisation of the bit-
stream. The expansion of the graph includes - among
other things - the number and types of digital inter-
faces to the sensors (AD converters) and the encoder-
s/decoders for the host communication. This commu-
nication can be based on a USB interface and contains
the live feed from the filtered signals as well as new
parameters for the filters from the host. Subsequently,
the filter pipeline is synthesized to a bitstream in a
specific FPGA model. The filter pipeline is set to lo-
calize anomalies in the incoming signal. Alongside
MODELSWARD 2023 - 11th International Conference on Model-Based Software and Systems Engineering
180

Figure 7: Illustration of the design graph showing one vari-
ant of a monitoring system for a specific set of requirements.
Each node represents a node instantiation, starting with the
monitoring system and ending at the program node.
the FPGA configuration, the model allows the use of
machine learning models.
It depends, of course, on the features of the input
data (bit size, frame size, structure) and process speci-
fications (frequency, bandwidth, realtime conditions).
Finally, the model suggests an interface for data stor-
age. At this point, we only provide the raw interface,
but will leave it up to future research activities to add
details on its specification.
Fig. 5 illustrates the activity diagram, modeling
the order of conditions and transformation rules ap-
plied on the graph. The activity nodes initSystemDe-
sign, getValuesFromCSV and InitBasicNodes are con-
cerned with the initialization of basic system nodes.
The stage denoted defineSensors decides on the type
of sensor to use whereas expandVisionInterface is
concerned with details on the machine vision com-
ponent. The nodes expandSoftware and expandCom-
puter finally add the related software and computing
unit. For further usage, the results are exported in a
routine called exportData.
Each sensor is connected to a program, a node
that is always required to process incoming data and
contains a data processing pipeline. The pipeline it-
self incorporates an algorithm represented by either
a machine learning model or a set of f ilter opera-
tors. The transformation ruleset expandSoftware con-
siders the parameters H
o
, f
s
,b,W to determine possi-
ble pipepline variants. A sample pipeline may look
as follows: (sensor) → (program) → (pipeline) →
(acquisition) → ( f ilter) → (SV M).
4 EVALUATION
4.1 Experimental Setup
In this section, the use of the presented model trans-
formation and graph rewriting method in industrial
applications will be discussed in more detail. For
Figure 8: CAD view based on open CASCADE that shows
the most promising configurations for each application
which are lined up for demonstration; each setup consists of
a camera sensor, optics, focus lighting and the target area.
this purpose, four representative application exam-
ples from industrial environments dealing with qual-
ity monitoring in production are demonstrated. The
industrial monitoring tasks mentioned include:
• Anomaly Detection in carbon fibre production
(CF) (Geinitz et al., 2016; Margraf et al., 2017b)
• Roving monitoring for fibre placement layups
2
(FP) (Margraf et al., 2017a)
• Monitoring of resin impregnation in the pultru-
sion process (PR) (Strauß and Wilhelm, 2020)
• Production of wetlaid nonwoven fabric (WL)
(Sauer et al., 2019)
All monitoring tasks can be potentially monitored
using optical sensors. In consequence, we expect the
following graph transformation rules to generate sys-
tem configurations with variants of camera sensors
and related software architectures.
Tables 1 and 2 contain all parameters relevant to
the related processes. For once, the values were ex-
tracted from the previously mentioned publications
which applies to CT,v
p
,l
ob j
,h
ob j
, or implicitly de-
ducted as for l
space
,h
scan
and the task context (cf. Tab.
2). Parameters l
space
and h
scan
are based on realistic
assumptions.
Furthermore, we apply the design language as
presented in Fig. 5 which includes the rule set ex-
pandCamera as illustrated in Fig. 3. The vocabu-
lary and transformation rules for the monitoring sys-
tem are modelled in the Design Compiler 43 (DC43)
(Schmitt, 2017) environment. The compilation en-
gine then generates the design graph.
4.2 Results and Discussion
In this section, the results of the model transformation
are critically reflected and evaluated in the context
2
Usually, 8 rovings exhibit a width of 1/4
′′
plus spacing.
Model-Driven Optimisation of Monitoring System Configurations for Batch Production
181
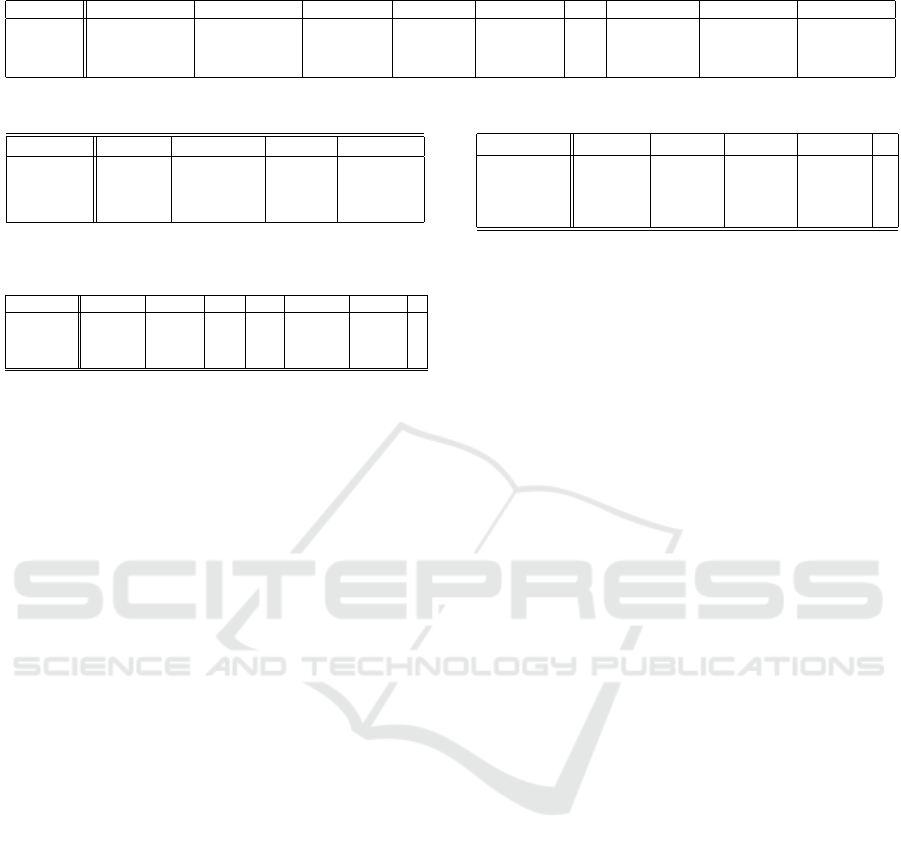
Table 1: Technical requirements of selected production processes for optical monitoring systems.
Application l
scan
h
scan
l
space
h
space
d
space
CT v
p
l
ob j
h
ob j
CF [30,1000] (mm) [0,∞] (mm) [50,50] (mm) [50,50] (mm) [50,50] (mm) [0,∞] [0.1,1] (m/s) [5,3000] (µ) [5,∞] (µ)
FP [0.635,200] (mm) [0, ∞] (mm) [0,300] (mm) [0,230] (mm) [0,150] (mm) [0,∞] [0.1,1] (m/s) [0.1,0.635] (cm) [0.1,0.635] (cm)
PR [78.76,86.6] (mm) [49.23,57.8] (mm) [0,∞] (mm) [0,∞] (mm) [0,1500] (mm) [0,∞] [0.3,5] (m/min) [5,86.6] [5,57.8] (mm)
WL [614,614] (mm) [0,∞] (mm) [0,1000] (mm) [0,∞] (mm) [0,720] (mm) [0,∞] [*,30] (m/min) [0.15,30] (mm) [0.15,30] (mm)
Table 2: Task context requirements.
Application Inspection Measurement Detection Localisation
CF - x x x
FP x - - x
PR - x x -
WL x - x -
Table 3: Values resulting from model transformation for
camera sensor configuration.
Application ξ[px] l[px] l[mm] h[px] h[mm] f
s
[1/T ] b
CF 1.65 · 10
−3
1.82 · 10
6
3000 1 1.65 · 10
−3
1.21 · 10
6
3
FP 6.60 4.55 30 1 30 151.50 3
WR 1.65 35.15 58 1 870 504.99 3
WL 3.30 · 10
−3
9090 30 1 30 1.52 · 10
5
3
of the application examples. Furthermore, the proce-
dure is discussed with regard to the research questions
mentioned in section 1.
The values for camera variants are listed in Tab. 3
and the optics solution space is given in Tab. 4. As
can be seen in Tab. 3, tiny objects increase the res-
olution and sensor size requirements substantially as
it is the case for CF and WL. In contrast, FP and PR
can be monitored with smaller sensors at a far lower
resolution. Likewise, the frequency values peak at
1.2 · 10
6
Hz for CF. While the frequency for WL is
still comparatively high, PR and FP are satisfied with
a frequency well below 1000 Hz. As Tab. 4 suggests,
low f
′
values correlate with high resolution require-
ments (cf. CF and WL). It should also be mentioned,
that the range for FP and PR between f
′
min
and f
′
max
is
comparatively large while it is strikingly small for CF
and WL which handle macroscopic objects. Also, the
maximum target size y
max
for CF largely exceeds the
values of all other sample applications. All param-
eters mentioned in this section result from applying
design rules and grammar and were stored as param-
eters in the nodes of the design graph (cf. Fig. 7).
The values can be regarded as accurate for the system
design concept, since they are based on real specifica-
tions and physical laws.
In reference to RQ1 we proposed a model which
is instantiated by collecting all relevant requirement
parameters. The nature of the transparent and human-
readable model and rule set allows to trace each deci-
sion made on design variants.
The limiting factors for algorithm development
mentioned in RQ2 result from the multi-dimensional
search space and uncertainties contained in the data.
Nevertheless, the M-AAS approach includes all rele-
vant dependencies between the system components
Table 4: Resulting specification for the optics configuration.
Application f
′
min
[mm] f
′
max
[mm] y
min
[mm] y
max
[mm] a
CF 3.3 · 10
−6
0.0165 1 5000 -
FP 0.57 113.80 1 200 -
PR 0.15 72.91 1 500 -
WL 6.6 · 10
−4
0.41 1 614 -
and the algorithms, although some details cannot be
fully considered.
RQ3 can be answered as follows: the proposed
approach ensures that details of the specification are
collected at the earliest possible stage, i.e. before sys-
tem development begins. The approach is set to auto-
mate large parts of monitoring system design.
The use of graph-based models, transformation
and user knowledge helps to efficiently identify the
solution space. Secondly, we provide an analysis of
the transferability of our approach and our detection
performance when only a single sample in the sup-
port set is targeted. This provides a lower bound of
our detection performance in essence. Thereby, the
adoption of each component to new, unknown situ-
ations can be performed upon request. This is even
the case without compromising on accuracy or run-
time. For reasons of simplicity, this study is limited
to the lab-based character of our experimental setup:
we have not explicitly taken into account the cost of
single components or the full-scale variants. For prac-
tical use, a connection to product databases will have
to be established. Since products and prices change
regularly, the authors decided to focus on merely tech-
nical parameters.
More than one relation is defined based on expert
input as to increase the compatibility of small datasets
by a quantitative comparison of results based on the
algorithm. Therefore, context-sensitive heuristics are
selected for different kinds of applications.
5 CONCLUSIONS AND FUTURE
WORK
This paper presents a top-down approach for model-
driven design of industrial monitoring systems and
data processing pipelines. Graph-based design lan-
guages and model transformation rules allow to map
the workflow from inspection task definition, sensor
design to algorithm selection and data flow configu-
ration. The framework proposed in this conceptual
MODELSWARD 2023 - 11th International Conference on Model-Based Software and Systems Engineering
182

study aims to automate a substantial part of monitor-
ing system development. The approach suggests im-
provements in design efficiency of complex monitor-
ing systems and processing algorithms. Furthermore,
it is expandable in terms of additional degrees of free-
dom.
Future work will focus on detailed, specific mon-
itoring tasks in industrial environment with long tail
detection and classification problems. We assume that
a more systematic decomposition of system design
tasks will lead to more compact designs. We encour-
age the research community to continue the ground-
work presented in this study by extending the models
and rule set to allow for more detailed design deci-
sions.
ACKNOWLEDGEMENT
The authors would like to thank the German Federal
Ministry for Economic Affairs and Climate Action
(BMWK) for public funding of the research project
AirCarbon III within Lufo-IV and the German Fed-
eral Ministry of Education and Research (BMBF) for
supporting the project SaMoA within VIP+.
REFERENCES
Alber, R. and Rudolph, S. (2004). On a grammar-based
design language that supports automated design gen-
eration and creativity. In Knowledge Intensive Design
Technology, pages 19–35. Springer US.
Geinitz, S., Margraf, A., Wedel, A., Witthus, S., and Drech-
sler, K. (2016). Detection of Filament Misalignment
in Carbon Fiber Production Using a Stereovision Line
Scan Camera System, volume 158-USB of DGZfP-
Proceedings BB. M
¨
unchen.
Hammami, M., Bechikh, S., Hung, C.-C., and Said, L. B.
(2018). A multi-objective hybrid filter-wrapper evo-
lutionary approach for feature construction on high-
dimensional data. In 2018 IEEE Congress on Evo-
lutionary Computation (CEC). IEEE. GP for multi-
objective feature contruction and selection.
ISO (1998). Geometrical product specification (gps) - sur-
face imperfections - terms, definitions and parameters.
Standard ISO 8785:1998, ISO.
Lin, Y.-P. and Jung, T.-P. (2017). Improving EEG-
based emotion classification using conditional transfer
learning. Frontiers in Human Neuroscience, 11.
Margraf, A., Geinitz, S., Wedel, A., and Engstler, L.
(2017a). Detection of surface defects on carbon fiber
rovings using line sensors and image processing algo-
rithms. SAMPE 2017.
Margraf, A., Stein, A., Engstler, L., Geinitz, S., and H
¨
ahner,
J., editors (2017b). An Evolutionary Learning Ap-
proach to Self-configuring Image Pipelines in the
Context of Carbon Fiber Fault Detection: 2017 16th
IEEE International Conference on Machine Learning
and Applications (ICMLA).
Mertes, S., Margraf, A., Geinitz, S., and Andr
´
e, E. (2022).
Alternative data augmentation for industrial monitor-
ing using adversarial learning.
M
¨
uller-Schloer, C. and Tomforde, S. (2017). Organic Com-
puting: Technical Systems for Survival in the Real
World. Autonomic Systems. Birkh
¨
auser, Cham, 1st
edition.
Neumaier, M., Kranemann, S., Kazmeier, B., and Rudolph,
S. (2022). Automated piping in an airbus a320 land-
ing gear bay using graph-based design languages.
Aerospace, 9(3):140.
Sauer, M., Feil, J., Manis, F., Betz, T., and Drechsler,
K. (2019). Thermoplastic multi-material nonwovens
from recycled carbon fibres using wet-laying technol-
ogy. In 22nd Symposium on Composites, volume 809
of Key Engineering Materials, pages 210–216. Trans
Tech Publications Ltd.
Schmeck, H., M
¨
uller-Schloer, C., C¸ akar, E., Mnif, M., and
Richter, U. (2010). Adaptivity and self-organization
in organic computing systems. ACM Transactions on
Autonomous and Adaptive Systems, 5(3):1–32.
Schmidhuber, J. (2015). Deep learning in neural networks:
An overview. Neural Networks, 61:85–117.
Schmitt, J. (2017). Total engineering automation.
https://www.iils.de/downloads/IILS-WhitePaper-
TotalEngineeringAutomation.pdf, accessed 10-08-
2022.
Shannon, C. E. (1948). A mathematical theory of communi-
cation. Bell System Technical Journal, 27(3):379–423.
Smith, W. (2000). Modern Optical Engineering: The De-
sign of Optical Systems. Optical and electro-optical
engineering series. McGraw Hill.
Stein, A., Margraf, A., Moroskow, J., Geinitz, S., and
H
¨
ahner, J. (2018). Toward an Organic Computing Ap-
proach to Automated Design of Processing Pipelines.
ARCS Workshop 2018; 31th International Conference
on Architecture of Computing Systems. VDE.
Strauß, S. and Wilhelm, F. (2020). Development of a flex-
ible injection and impregnation chamber for pultru-
sion of high reactive resins. Procedia Manufacturing,
47:956–961.
Tan, C., Sun, F., Kong, T., Zhang, W., Yang, C., and Liu,
C. (2018). A survey on deep transfer learning. In Ar-
tificial Neural Networks and Machine Learning ICAN
2018, pages 270–279. Springer International Publish-
ing.
VDI/VDE (2015). Machine vision - guideline for the prepa-
ration of a requirement specification and a system
specification. Standard VDI/VDE 2632 Part 2:2015-
10, VDI/VDE/VDMA, Berlin, DE.
Walter, B., Martin, J., Schmidt, J., Dettki, H., and Rudolph,
S. (2019). Executable state machines derived from
structured textual requirements - connecting require-
ments and formal system design. In Proceedings of the
7th International Conference on Model-Driven Engi-
neering and Software Development. SCITEPRESS -
Science and Technology Publications.
Model-Driven Optimisation of Monitoring System Configurations for Batch Production
183
