
Analysis of Postural Variability of Office Workers Using Inertial Sensors
F
´
abio Mendes
1
, Phillip Probst
1 a
, Eduarda Oliosi
1,2 b
, Lu
´
ıs Silva
1 c
, C
´
atia Cepeda
1 d
and Hugo Gamboa
1 e
1
LIBPhys (Laboratory for Instrumentation, Biomedical Engineering and Radiation Physics),
NOVA School of Science and Technology, NOVA University Lisbon, Caparica, Portugal
2
Faculty of Sports of the University of Porto, Porto, Portugal
Keywords:
Postural Variability, Posture, Musculoskeletal Disorders, Inertial Sensors, Ergonomics, Office Work.
Abstract:
Musculoskeletal disorders significantly impact workers in terms of quality of life, result in low organisational
productivity, and high insurance costs in society. Postural changes have been suggested as a prerequisite to
prevent musculoskeletal disorders. This paper examines the differences in postural changes of forty office
workers in a real working environment using a smartphone’s inertial sensors. Through these data, several
variables considered to characterise postural changes while sitting were extracted. Features based on the
number of changes and different postures, time spent and distance covered within a posture showed significant
differences in both time of the day (morning and afternoon) and day of the week (start and end of the week).
These results confirm that accumulated working time influences a person’s postural changes and could have a
potential use for worker’s ergonomic occupational risk evaluation.
1 INTRODUCTION
People that are part of the working population spend
a significant time of their daily lives at work. Good
conditions must be ensured to provide workers a safe
environment in which they feel confident and where
occupational risks and the onset of work-related dis-
orders (WRDs) are kept at a minimum, contribut-
ing to productivity and economic development (World
Health Organization, 2017). Exposure to risk fac-
tors such as heat, noise, and posture issues can di-
rectly contribute to causing diseases or aggravate
some health conditions. Additionally, stress and some
determinants at social relations at work also nega-
tively affect workers’ health (World Health Organi-
zation, 2017; Hulshof et al., 2021). Therefore, it is
essential to monitor and prevent WRDs to create a
safe environment and promote health at work. Strate-
gies such as the improvement of the conception of the
workplace and the education on keeping a proper pos-
ture can be very effective to reduce the risk of one
of these disorders (World Health Organization, 2017;
a
https://orcid.org/0000-0003-3239-9813
b
https://orcid.org/0000-0003-1002-4295
c
https://orcid.org/0000-0001-9811-0571
d
https://orcid.org/0000-0002-2998-976X
e
https://orcid.org/0000-0002-4022-7424
Perista et al., 2016).
Especially, occupations such as computerised of-
fice work are characterised by long-lasting low in-
tensities, static postures, and repetitive actions (Srini-
vasan and Mathiassen, 2012). Consequently, differ-
ent metrics and tools for measuring workers’ move-
ment have been assessed at various levels, includ-
ing kinematic components and neuromuscular pat-
terns. In healthy people, functional tasks are natu-
rally performed with variable motor patterns, illustrat-
ing an inherited normal variation in space and time to
preserve or achieve functional skills (Srinivasan and
Mathiassen, 2012). Nevertheless, in the presence of
musculoskeletal disorders (MSDs), people often show
different motor control strategies, and changes in mo-
tor variability are often reported in kinematic param-
eters (e.g., reduced degrees of freedom during walk-
ing or other activities of daily living) and neuromus-
cular variables (e.g., reduced variability of muscle
activity during repetitive lifting or other tasks) (Al-
subaie et al., 2021). Thus, variation in movements,
posture or muscle activity has been a prerequisite to
prevent musculoskeletal complaints during functional
tasks (Mingels et al., 2021).
The primary purpose of this research study is to
analyse the postural changes of public administration
workers in their natural work environment. The study
Mendes, F., Probst, P., Oliosi, E., Silva, L., Cepeda, C. and Gamboa, H.
Analysis of Postural Variability of Office Workers Using Inertial Sensors.
DOI: 10.5220/0011688500003414
In Proceedings of the 16th International Joint Conference on Biomedical Engineering Systems and Technologies (BIOSTEC 2023) - Volume 4: BIOSIGNALS, pages 273-280
ISBN: 978-989-758-631-6; ISSN: 2184-4305
Copyright
c
2023 by SCITEPRESS – Science and Technology Publications, Lda. Under CC license (CC BY-NC-ND 4.0)
273

focuses on sedentary work. Data were collected us-
ing the inertial sensors of a smartphone placed on the
subjects’ chest. This work is part of the PrevOccupAI
project (Biosignals LIBPhys-UNL, 2020), which has
the support of the Portuguese Autoridade Tribut
´
aria
e Aduaneira (AT) and Direc¸
˜
ao-Geral da Sa
´
ude. The
main goal of this project is to promote occupational
health and prevent WRDs, through the identification
of risk factors in the office context.
2 RELATED WORK
Previous research uses several observational and data-
mining techniques for occupational risk assessments.
For example, Carnide et al. evaluated possible causes
for MSDs through questionnaires and clinical exams,
including electromyography (EMG) (Carnide et al.,
2006). EMG sensors were used to compare mus-
cle activation during computer tasks in those with
and without pain in computer workers (Kelson et al.,
2019) and also to quantify the spatio-temporal ef-
fects of biofeedback by inducing active and passive
pauses on the trapezius activity patterns using high-
density sEMG sensors in computer work (Samani
et al., 2010).
Ryan and colleagues objectively investigated
workplace sedentary behaviour and adherence to cur-
rent recommendations via accelerometer in a popu-
lation of office workers (Ryan et al., 2011). Lenzi et
al. developed a toolbox to support expert video analy-
sis of manual handling of low loads at high frequency
through the use of inertial sensors (Lenzi et al., 2018).
Prior studies have used different technologies to
characterise posture changes in sitting posture, such
as: video analysis during laptop tasks (Mingels et al.,
2021); instrumented office-chairs to explore the re-
lation to the development of perceived discomfort
(Søndergaard et al., 2010) and detect the difference
between ages (Madeleine et al., 2021); textile pres-
sure mat to observe the characteristics of movement
patterns during a prolonged sitting bout and to de-
termine their association with musculoskeletal pain
(Arippa et al., 2022) and other concerning problems
such as back pain in office workers (Bontrup et al.,
2019); motion analysis system to quantify the self-
reported discomfort in a stool, a computer chair, and
a gaming chair (Chen et al., 2021) during sustained
office work via wireless inertial motion sensors (Jun
et al., 2019).
The mentioned studies all focus on using highly
specialised equipment that are often expensive. In this
paper we aim at utilising equipment that is available
to all workers without extra costs by using a smart-
phone placed on the subjects’ chest as a data acqui-
sition tool. Furthermore, to the best of our knowl-
edge, there are no studies that explore the evolution of
postural changes in office workers through the smart-
phone’s inertial sensors.
3 DATASET
3.1 Participants
The acquisition sessions were performed with office
workers from AT, working in a real-world scenario
at their own workplace. The participants performed
their regular office work, and each participant was
monitored while working for five consecutive days,
sitting at their desk.
These sessions took place at four different AT di-
visions and in four different weeks. There were a total
of 40 participants, 10 for each AT division. The par-
ticipants’ age was 51 ± 5 years and the overall body
mass index was 25.34 ± 4.40 kg/m
2
, 24.78 ± 4.79
kg/m
2
for females (n = 27) and 26.71 ± 3.03 kg/m
2
for males (n = 11).
3.2 Experimental Setup
The study was conducted in order to collect inertial
data from people working at their desks. A smart-
phone was placed on the chest of each participant,
using a special strap around the neck and torso, ac-
cording to Figure 1. This configuration ensured that
the smartphone’s y-axis was pointing up.
Figure 1: Smartphone placement for data acquisition.
The smartphones used are Xiaomi Redmi Note 9
models (Xiaomi Inc., www.mi.com), which include a
variety of sensors, such as accelerometer, gyroscope,
magnetometer, and rotation vector.
Using the PrevOccupAI mobile application (Silva
et al., 2022), a total of four acquisitions were sched-
uled for each of the five days. These included two
acquisitions in the morning and two in the afternoon,
to allow an analysis of the acquired signals through-
out the day and the week. The sampling rate was
set to 100 Hz and the acquisition time to 20 minutes.
BIOSIGNALS 2023 - 16th International Conference on Bio-inspired Systems and Signal Processing
274

Thus, while participants were working, the acquisi-
tions started and ended automatically.
4 METHODS
4.1 Data Pre-Processing
The smartphone runs the Android operating system,
which is designed to prioritise battery saving. That
can lead to the sensors starting at different times, sam-
pling asynchronously, and using a non-equidistant
sampling procedure. Hence, the acquired sensors of a
device become misaligned in time and therefore it is
necessary to resample all signals to the same equidis-
tant sampling rate and crop them to the same size. As
the acquisitions included accelerometer, gyroscope,
magnetometer, and rotation vector, the procedure was
done for all of them so that their signals could be anal-
ysed simultaneously.
The first step is to define the starting and stopping
points, and crop or pad the signals according to that.
For this work, we chose the starting point as the ini-
tial timestamp of the last sensor that started acquiring,
and the stopping point as the final timestamp of the
first sensor that stopped acquiring. The differences
between the starting and stopping times of the sensors
usually do not exceed a couple of seconds.
After cropping, each signal has to be individu-
ally resampled, to assure that the sampling frequency
is constant and the same for all sensors. Therefore,
a new time axis with constant intervals was gener-
ated, beginning and ending at the defined starting and
stopping points, respectively. Then, each signal was
individually interpolated, using the new time axis.
This way, the smartphone sensors data were finally
aligned. The new sampling rate was set to 100 Hz
and a linear interpolation was performed.
4.2 Removal of Non-Sitting Periods
As acquisitions were performed in a real-world sce-
nario, it is possible that the participants did not remain
seated for the entire acquisition period.
To ensure the validity of the analysis to be per-
formed, it was important to develop an algorithm to
detect the periods when a participant was not seated
and remove these from the data. For this purpose,
we performed some additional acquisitions of a per-
son sitting and walking (using the same setting) and
trained a machine learning model which detects when
a participant is not seated. This model is based on the
random forest algorithm and reached an accuracy of
100% using a 70/30% split with five different seeds.
To apply this machine learning model, the smart-
phone’s accelerometer signals were first filtered using
a smoothing filter with a Hanning window of 30 sam-
ples. Then, the signals were divided into windows of
5 seconds and both statistical and temporal features
were extracted from each signal window. Using these
features, each window was classified by the model as
sitting or walking. Finally, the windows classified as
walking were removed from the signals to analyse.
This way, the variables related to postural variability
while sitting could be extracted.
4.3 Extraction of Postural Variables
After pre-processing, we defined a set of variables
that we considered representative of postural variabil-
ity. This postural variability refers to the adjustments
each person makes to their sitting posture. Posture is
defined as the position where we keep our body when
we are seated. The considered variables include:
• Number of changes in posture;
• Number of different postures;
• Mean time of transition between postures;
• Time spent in each of the subject’s three most
common postures;
• Time spent in the remaining postures;
• Total distance covered;
• Distance covered in each of the subject’s three
most common postures;
• Distance covered in the remaining postures;
• Variance in each of the subject’s three most com-
mon postures;
• Mean variance in the remaining postures;
• Mean velocity;
• Mean velocity in each of the subject’s three most
common postures;
• Mean velocity in the remaining postures.
To extract these variables from the available data,
we used the smartphone’s rotation vector, which al-
lows the calculation of the subject’s trunk position at
each moment. The rotation vector sensor merges ac-
celerometer, gyroscope, and magnetometer data, and
is based on the mathematical concept of quaternions,
which is the description of 3D orientation using a
4D complex number system (Goldman, 2011). Thus,
the smartphone’s rotation vector returns four values
that describe the phone’s orientation relative to the
phone’s base coordinate system, which is illustrated
in Figure 2.
Analysis of Postural Variability of Office Workers Using Inertial Sensors
275

Figure 2: Coordinate system of the smartphone.
These quaternions were first converted to Euler
angles, and the median was subtracted and considered
as the reference point. The Euler angles were then
transformed into positions in the xz-plane (accord-
ing to Figure 2), which corresponds to the horizon-
tal plane when the subjects have the phone placed on
their chest. The x and z coordinates allow the determi-
nation of the inclination of the trunk in that plane, at
a given moment, which defines the different postures
of each person. To allow the comparison of postures
between subjects, these coordinates were normalised
by the height of each individual.
Furthermore, it was also necessary to categorise
the different possible postures into finite ranges. Tak-
ing into account that the obtained x and z coordinates
ranged from -1 to 1, the xz-plane was divided into a
grid of equal squares (7x7), whose dimensions were
manually chosen to optimise the number of different
postures, as represented in Figure 3. The grid was
equally distributed in both directions, consisting of 49
different possible postures. However, some of those
49 intervals are humanly impossible to reach.
Figure 3: Division of the xz-plane to define the possible
postures.
Moreover, some of the extracted variables
required the implementation of additional pre-
processing tools. To extract the variables not in-
volving variability within the same posture (number
of changes in posture, number of different postures,
mean time of transition between postures, time spent
in each of the subject’s three most common postures,
and time spent in the remaining postures), the pos-
tural sway behaviour was removed. This behaviour
corresponds to the small and unconscious movements
around the body’s center of mass needed to main-
tain balance while standing or sitting (Paterno et al.,
2013). This postural sway, if not removed, can cause
oscillations between the limits of two of the defined
postures, affecting the extracted variables. These
small oscillations are unconscious and do not involve
changes in posture, as they are only adjustments that
each individual makes to their posture. For this rea-
son, to extract some of the variables, the higher fre-
quencies were removed from the signals by applying
a low-pass filter with a cut-off frequency of 0.3 Hz
(Soames and Atha, 1982) to the Euler angles.
To allow comparison between subjects, some of
the 21 variables had to be normalised. The number of
changes in posture was normalised by an hour, while
some of the variables involving time (time spent in
the most common, second most common, third most
common, and remaining postures) and the variables
involving distance (total distance and distance cov-
ered in the most common, second most common, third
most common, and remaining postures) were nor-
malised by the time of acquisition (approximately 20
minutes).
4.4 Analysis of Postural Variables
From the four acquisitions per day, for the purpose of
this study, we extracted the first in the morning of the
first day, the last in the afternoon of the first day, the
first in the morning of the fifth day, and the last in the
afternoon of the fifth day (4 out of the 20 acquisitions
of each subject). Thus, the statistical analysis allows
to evidence the evolution of each variable throughout
the day and throughout the week.
A two-way repeated measures analysis of vari-
ance (ANOVA) test was applied to each dependent
variable considering as levels the time points of the
day (morning and afternoon) and days of the week
(first and fifth). The p-values were corrected by the
Greenhouse-Geisser method. Normality assumption
was considered under the Central Limit Theorem and
the level of significance was set to 5%.
5 RESULTS
Table 1 presents the results of the two-way repeated
measures ANOVA for time of the day (Time) and day
of the week (Day), and their respective interaction.
Figure 4 displays the evolution of the mean values
of the variables that showed statistically significant
differences and/or significant interaction according to
Table 1.
BIOSIGNALS 2023 - 16th International Conference on Bio-inspired Systems and Signal Processing
276
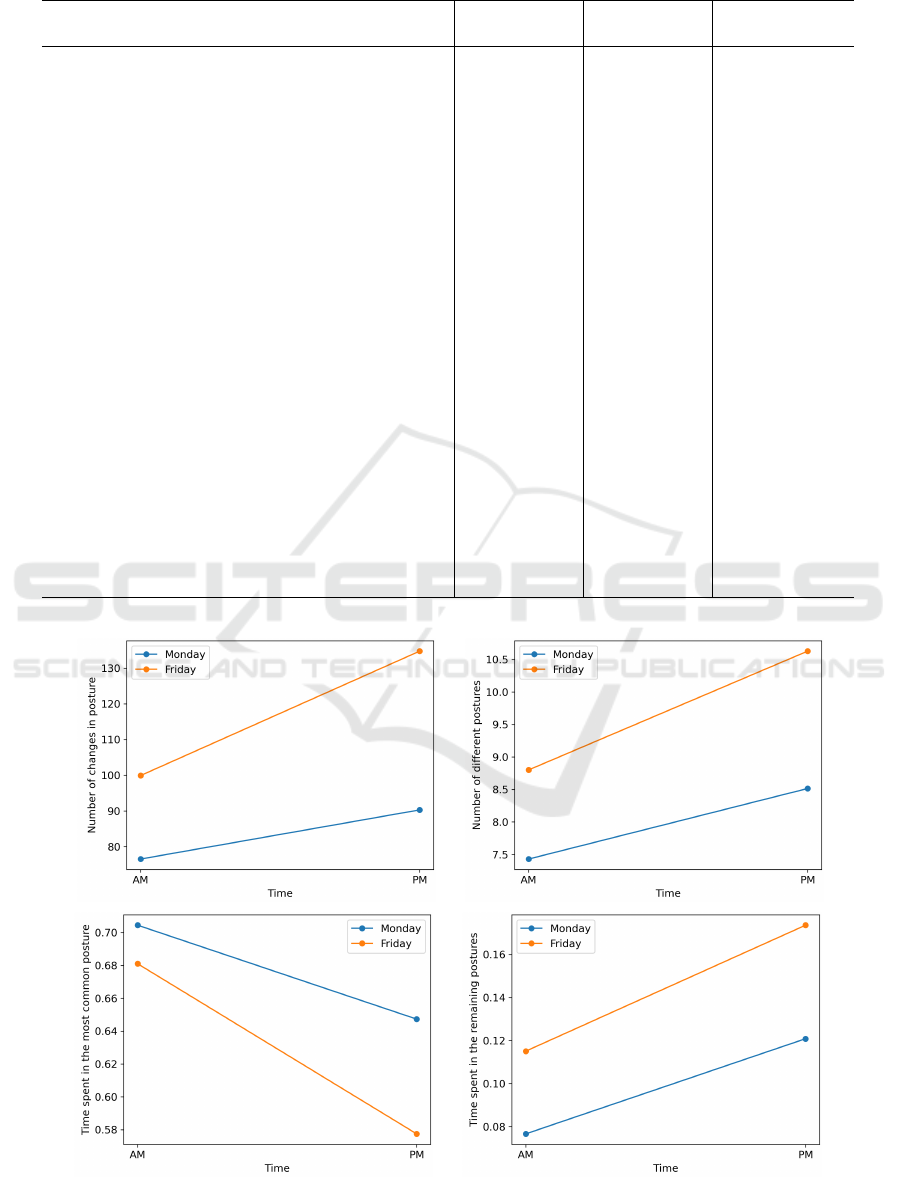
Table 1: Statistical analysis of the extracted postural variables by two-way repeated measures ANOVA.
Variable
Comparison Comparison Interaction
(Time) (Day) (Time × Day)
Number of changes in posture 0.014* 0.004* 0.274
Number of different postures 0.010* 0.011* 0.468
Mean time of transition between postures 0.761 0.066 0.396
Time spent in the most common posture 0.002* 0.154 0.423
Time spent in the second most common posture 0.351 0.927 0.152
Time spent in the third most common posture 0.067 0.776 0.595
Time spent in the remaining postures 0.001* 0.008* 0.631
Total distance covered 0.330 0.000* 0.799
Distance covered in the most common posture 0.074 0.017* 0.152
Distance covered in the second most common 0.936 0.935 0.386
posture
Distance covered in the third most common 0.861 0.793 0.181
posture
Distance covered in the remaining postures 0.001* 0.002* 0.089
Variance in the most common posture 0.022* 0.846 0.950
Variance in the second most common posture 0.752 0.017* 0.305
Variance in the third most common posture 0.088 0.085 0.080
Mean variance in the remaining postures 0.056 0.118 0.655
Mean velocity 0.657 0.003* 0.104
Mean velocity in the most common posture 0.171 0.177 0.369
Mean velocity in the second most common 0.895 0.029* 0.805
posture
Mean velocity in the third most common posture 0.074 0.425 0.433
Mean velocity in the remaining postures 0.069 0.029* 0.027*
*p-value significant at α = 0.05 level.
Figure 4: Evolution of the variables’ mean values throughout the day and throughout the week.
Analysis of Postural Variability of Office Workers Using Inertial Sensors
277
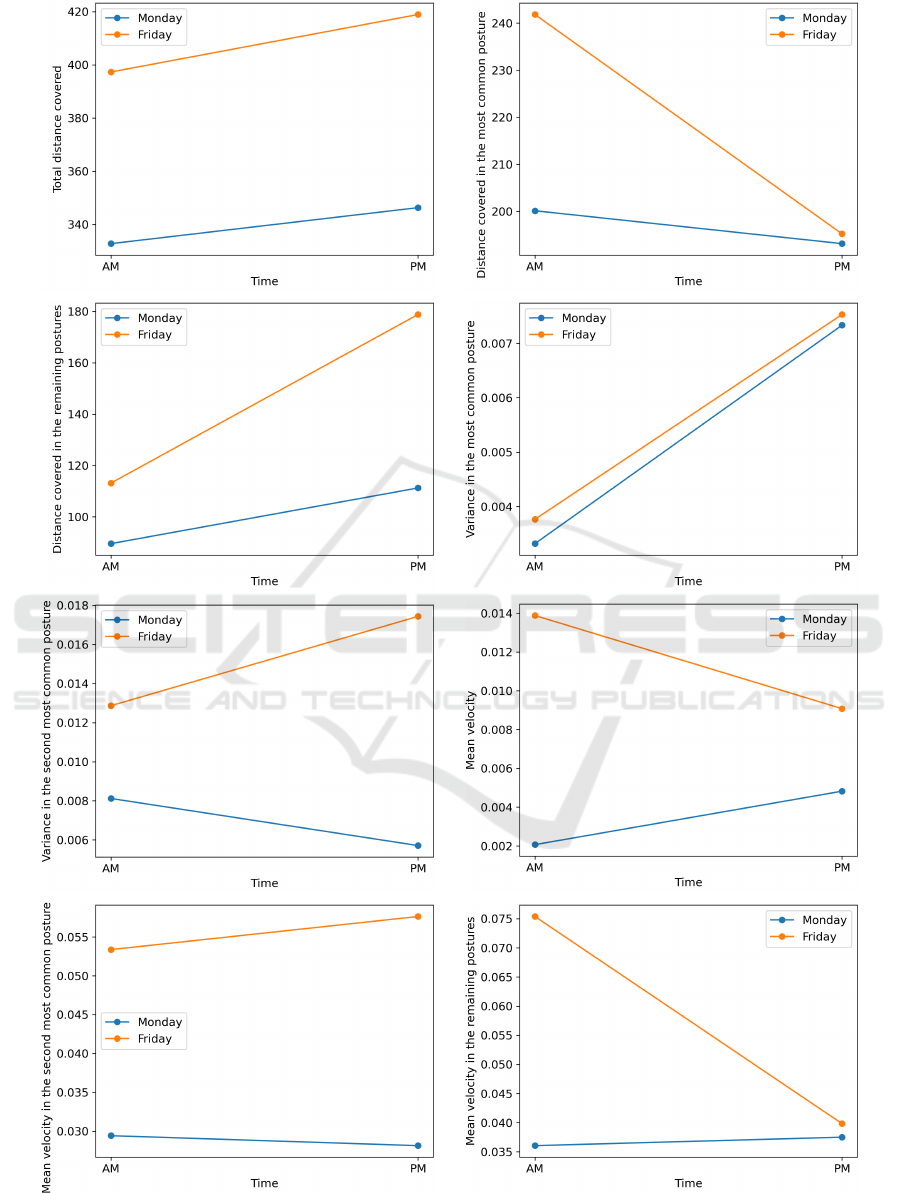
Figure 4: Evolution of the variables’ mean values throughout the day and throughout the week (cont.).
BIOSIGNALS 2023 - 16th International Conference on Bio-inspired Systems and Signal Processing
278

6 DISCUSSION
The current investigation evaluated the postural vari-
ability of public administration workers in a seated
posture, through variables extracted from the smart-
phone’s rotation vector sensor, which was placed on
the subjects’ chest. As the acquisitions were carried
out during a working week for each participant, it was
possible to study the evolution of postural changes
throughout the day and week.
Regarding the different periods of the day (morn-
ing and afternoon), shown in Table 1, 6 out of the
21 variables present significant differences between
the two time periods. These include the number of
changes in posture, number of different postures, and
time spent in the most common posture. Taking into
account Figure 4, it can be seen that the number of
changes in posture and number of different postures
increase from the morning to the afternoon, while
the time spent in the most common posture decreases
from the morning to the afternoon. These results are
in accordance with the literature, which demonstrates
a need to change posture throughout the working day
(Søndergaard et al., 2010; Jorgensen et al., 2012;
Son, 2017; Forsman et al., 2007). This is due to the
fact that long periods of sitting lead to increased dis-
comfort, which makes people move more and change
their posture (Søndergaard et al., 2010). This means
that postural variability (changes) tends to increase
throughout the day, as a strategy to resist accumulated
tiredness and discomfort.
Concerning different days of the week (Monday
and Friday), Table 1 shows that 10 out of the 21 vari-
ables present significant differences between the first
and fifth days. These, in addition to including the
number of changes in posture and number of differ-
ent postures, also include some variables related to
distance (total distance covered, distance covered in
the most common posture, and distance covered in the
remaining postures). Figure 4 shows that all these 5
mentioned variables present an increase from Mon-
day to Friday. This is because the subjects also accu-
mulate fatigue throughout the week, increasing their
general movement and postural variability. This ac-
cumulation of tiredness is more noticeable throughout
the week than throughout the day, as evidenced by the
number of variables that show significant differences.
Finally, Table 1 also shows that interaction be-
tween the independent variables Time and Day was
not statistically significant for 20 out of 21 postural
variables. These results demonstrate that the relation-
ship between time of the day and each of the postural
variables is not influenced by the day of the week, and
also that the relationship between day of the week and
each of the postural variables is not influenced by the
time of the day. This reinforces the validity of the
measurements performed.
7 CONCLUSION
In this work, we analysed the postural variability of
office workers through inertial smartphone data col-
lected in real context. For this purpose, we performed
a 40-subject study with public administration workers
performing office work. From the collected data, 21
variables characterising postural changes while sitting
were extracted.
The postural variables were statistically analysed
to understand their evolution during a work day and
a week. Some of the variables presented statisti-
cally significant differences between the morning and
the afternoon, but the first and fifth days presented
more variables with significant differences. These
results evidence the accumulated fatigue throughout
the day and the week. Regarding interaction between
the independent variables, only one postural variable
presented interaction between the variables Time and
Day.
The results obtained can be used as a means to
help assign a degree of ergonomic occupational risk
to each subject, which can be employed to build a tool
that automatically assesses the occupational risk of a
worker. This risk may then be used to make recom-
mendations to office workers, such as short standing
breaks or changes in posture.
In the future, to ensure the validity of the analy-
sis performed, it is important to extend the study to
more subjects, and to collect data over more working
days. Additionally, the set of participants should in-
clude more diverse age groups, and potentially differ-
ent working populations, including workers who do
not work in public administration. Furthermore, pos-
tural variables that encompass time series variability
in postural sway using nonlinear analysis should be
considered.
ACKNOWLEDGEMENTS
This work was partly supported by Science and Tech-
nology Foundation (FCT), under the project PRE-
VOCCUPAI (DSAIPA/AI/0105/2019). The authors
declare that there are no conflicts of interest.
Analysis of Postural Variability of Office Workers Using Inertial Sensors
279

REFERENCES
Alsubaie, A. M., Mazaheri, M., Martinez-Valdes, E., and
Falla, D. (2021). Is movement variability altered in
people with chronic non-specific low back pain: a pro-
tocol for a systematic review. BMJ Open, 11(5).
Arippa, F., Nguyen, A., Pau, M., and Harris-Adamson, C.
(2022). Postural strategies among office workers dur-
ing a prolonged sitting bout. Applied Ergonomics,
102:103723.
Biosignals LIBPhys-UNL (2020). Biosignals - prevoccu-
pai. http://biosi.gnals.org/projects pages/prevocupai/
prevocupai.html. Accessed: 2022-10-20.
Bontrup, C., Taylor, W. R., Fliesser, M., Visscher, R.,
Green, T., Wippert, P.-M., and Zemp, R. (2019). Low
back pain and its relationship with sitting behaviour
among sedentary office workers. Applied Ergonomics,
81:102894.
Carnide, F., Veloso, A., Gamboa, H., Caldeira, S., and
Fragoso, I. (2006). Interaction of biomechanical and
morphological factors on shoulder workload in indus-
trial paint work. Clinical Biomechanics, 21(Suppl.
1):S33–S38.
Chen, Y.-L., Chan, Y.-C., and Zhang, L.-P. (2021). Pos-
tural variabilities associated with the most comfort-
able sitting postures: A preliminary study. Health-
care, 9(12):1685.
Forsman, P., Haeggstr
¨
om, E., Wallin, A., Toppila, E., and
Pyykk
¨
o, I. (2007). Daytime changes in postural stabil-
ity and repeatability of posturographic measurements.
Journal of occupational and environmental medicine,
49(6):591–596.
Goldman, R. (2011). Understanding quaternions. Graphi-
cal Models, 73(2):21–49.
Hulshof, C. T., Pega, F., Neupane, S., van der Molen, H. F.,
Colosio, C., Daams, J. G., Descatha, A., Kc, P., Kuijer,
P. P., Mandic-Rajcevic, S., Masci, F., Morgan, R. L.,
Nyg
˚
ard, C.-H., Oakman, J., Proper, K. I., Solovieva,
S., and Frings-Dresen, M. H. (2021). The prevalence
of occupational exposure to ergonomic risk factors: A
systematic review and meta-analysis from the who/ilo
joint estimates of the work-related burden of disease
and injury. Environment International, 146:106157.
Jorgensen, M., Rathleff, M., Laessoe, U., Caserotti, P.,
Nielsen, O., and Aagaard, P. (2012). Time-of-day in-
fluences postural balance in older adults. Gait & Pos-
ture, 35(4):653–657.
Jun, D., Johnston, V., McPhail, S. M., and O’Leary, S.
(2019). Are measures of postural behavior using mo-
tion sensors in seated office workers reliable? Human
Factors, 61(7):1141–1161.
Kelson, D. M., Mathiassen, S. E., and Srinivasan, D. (2019).
Trapezius muscle activity variation during computer
work performed by individuals with and without neck-
shoulder pain. Applied Ergonomics, 81:102908.
Lenzi, S. E., Standoli, C. E., Andreoni, G., Perego, P.,
and Lopomo, N. F. (2018). Comparison among stan-
dard method, dedicated toolbox and kinematic-based
approach in assessing risk of developing upper limb
musculoskeletal disorders. In Advances in Human
Factors in Wearable Technologies and Game Design,
pages 135–145. Springer International Publishing.
Madeleine, P., Marandi, R. Z., Norheim, K. L., Andersen,
J. B., and Samani, A. (2021). Sitting dynamics dur-
ing computer work are age-dependent. Applied Er-
gonomics, 93:103391.
Mingels, S., Dankaerts, W., van Etten, L., Bruckers, L., and
Granitzer, M. (2021). Lower spinal postural variabil-
ity during laptop-work in subjects with cervicogenic
headache compared to healthy controls. Scientific re-
ports, 11(1):1–11.
Paterno, M. V., Schmitt, L. C., Ford, K. R., Rauh, M. J., and
Hewett, T. E. (2013). Altered postural sway persists
after anterior cruciate ligament reconstruction and re-
turn to sport. Gait & Posture, 38(1):136–140.
Perista, H., Cardoso, A., Nunes, J., Carrilho, P., and Quin-
tal, E. (2016). Inqu
´
erito
`
as condic¸
˜
oes de trabalho em
portugal continental: Trabalhadores/as.
Ryan, C. G., Dall, P. M., Granat, M. H., and Grant, P. M.
(2011). Sitting patterns at work: objective measure-
ment of adherence to current recommendations. Er-
gonomics, 54(6):531–538.
Samani, A., Holtermann, A., Søgaard, K., and Madeleine, P.
(2010). Active biofeedback changes the spatial distri-
bution of upper trapezius muscle activity during com-
puter work. European journal of applied physiology,
110(2):415–423.
Silva, S., Cepeda, C., Rodrigues, J., Probst, P., and Gam-
boa, H. (2022). Assessing occupational health with
a cross-platform application based on self-reports and
biosignals. In Proceedings of the 15th International
Joint Conference on Biomedical Engineering Systems
and Technologies - HEALTHINF, pages 549–556.
SciTePress.
Soames, R. W. and Atha, J. (1982). The spectral character-
istics of postural sway behaviour. European Journal
of Applied Physiology and Occupational Physiology,
49:169–177.
Son, S. M. (2017). The circadian effects on postural stabil-
ity in young adults. The Journal of Korean Physical
Therapy, 29(3):142–144.
Srinivasan, D. and Mathiassen, S. E. (2012). Motor vari-
ability - an important issue in occupational life. Work,
41(Suppl. 1):2527–2534.
Søndergaard, K. H., Olesen, C. G., Søndergaard, E. K.,
de Zee, M., and Madeleine, P. (2010). The variabil-
ity and complexity of sitting postural control are as-
sociated with discomfort. Journal of Biomechanics,
43(10):1997–2001.
World Health Organization (2017). Protecting workers’
health. https://www.who.int/news-room/fact-sheets/
detail/protecting-workers’-health. Accessed: 2022-
10-20.
BIOSIGNALS 2023 - 16th International Conference on Bio-inspired Systems and Signal Processing
280
