
Multimodal Stress Classification Based on Biosignals Extracted from
Smart Devices and Electromyography
Maria Justino, Phillip Probst
a
, Daniel Zagalo
b
, C
´
atia Cepeda
c
and Hugo Gamboa
d
LIBPhys (Laboratory for Instrumentation, Biomedical Engineering and Radiation Physics),
Faculdade de Ciencias e Tecnologia, Universidade Nova de Lisboa, Caparica, Portugal
Keywords:
Stress Detection, Biosignals, Occupational Health, Machine Learning, Multimodal Input.
Abstract:
Work-Related Stress is the second most impactful occupational health problem in Europe, behind muscu-
loskeletal diseases. When mental health is adequately handled, a worker’s well-being, performance, and
productivity can be considerably improved. This paper presents machine learning models to classify mental
stress experienced by office workers using physiological signals including heart rate, acquired using a smart-
watch; respiration, derived from a smartphone’s acc placed on the chest; and trapezius electromyography,
using proprietary electromyography sensors. Two interactive protocols were implemented to collect data from
12 individuals. Time features were extracted from heart rate and electromyography signals, with frequency
features also being extracted from the latter. Statistical and temporal features were extracted from the derived
respiration signal. Different input modalities were tested for the machine learning models: one for each phys-
iological signal and a multimodal one, combining all of them. Three algorithms: Support Vector Machine,
Random Forest, and K-Nearest-Neighbor were employed for mental stress classification. Random Forest ob-
tained the best results (67.7%) for the heart rate model whereas K-Nearest-Neighbor attained higher accuracies
for the respiration (89.1%) and electromyography (95.4%) models. Both algorithms achieved 100% accuracy
for the multimodal model. A possible future approach would be to validate these models in real time.
1 INTRODUCTION
Work-Related Stress (WRS) disorders are becoming
more prevalent among working populations being the
second most severe health issue related to work in
Europe, after musculoskeletal diseases (Can et al.,
2019). According to a recently published survey
by the European Agency for Safety and Health at
Work (Curtarelli, 2022), 46% of workers deal with
increased levels of stress as a result of severe time
pressure or overload. Office workers are especially
exposed to stress caused by an increase in the amount
of demanding knowledge, expected high productiv-
ity, and ongoing technological developments (Bol-
liger et al., 2022).
Stress can be defined as an individual’s response
(psychological, physiological, and behavioral) to sur-
rounding stimuli, such as environmental conditions or
physical exertion (Salai et al., 2016; Alberdi et al.,
a
https://orcid.org/0000-0003-3239-9813
b
https://orcid.org/0000-0003-4878-6631
c
https://orcid.org/0000-0002-2998-976X
d
https://orcid.org/0000-0002-4022-7424
2016). Constant exposure to stress can deeply im-
pact a human’s physical and emotional health leading
to symptoms such as headaches, cardiovascular dis-
orders, asthma, diabetes, sleep deprivation, burnout,
and cancer (Salai et al., 2016). In the long term, other
conditions may arise from a psychological standpoint,
such as depression and anxiety. This can eventually
lead to difficulties regarding personal, professional,
family, social and economic affairs (Goncalves et al.,
2018). When an individual is exposed to stress, clear
physiological responses, including changes in electro-
dermal activity (EDA), heart rate (HR), muscular ten-
sion, blood volume pressure (BVP), and respiration
(RESP), can be observed (Choi et al., 2011). This un-
derlying multimodal nature of stress suggests that in-
corporating many modalities for stress classification
can result in more accurate prediction models.
The usage of smart devices such as smartphones,
smartwatches, fitness trackers, etc. has significantly
increased over the past years. Most of these de-
vices offer a variety of sensors, such as accelerom-
eters (ACC), gyroscopes, magnetometers, step detec-
tors, and HR sensors that can be used to either directly
Justino, M., Probst, P., Zagalo, D., Cepeda, C. and Gamboa, H.
Multimodal Stress Classification Based on Biosignals Extracted from Smart Devices and Electromyography.
DOI: 10.5220/0011687200003414
In Proceedings of the 16th International Joint Conference on Biomedical Engineering Systems and Technologies (BIOSTEC 2023) - Volume 4: BIOSIGNALS, pages 265-272
ISBN: 978-989-758-631-6; ISSN: 2184-4305
Copyright
c
2023 by SCITEPRESS – Science and Technology Publications, Lda. Under CC license (CC BY-NC-ND 4.0)
265

measure or infer the aforementioned physiological re-
sponses. Smart devices can be viewed as promising
data collection tools given their widespread usage and
sensor capabilities. They are non-invasive and unob-
trusive, which significantly affects how accepted and
comfortable biomedical measurements can be done.
Implementing machine learning (ML) models based
on data collected from smart devices ensures that
these models can be potentially deployed on equip-
ment that workers use in their daily lives.
This paper presents stress detection models for
office workers using sensor-based measurements of
physiological signals from different modalities such
as HR, RESP, and electromyography (EMG). HR and
RESP were extracted from a smartwatch and a smart-
phone, respectively. EMG signals were acquired us-
ing proprietary EMG sensors. The signals were col-
lected from 12 participants, during two interactive
protocols. One protocol aimed at inducing stress
while the other focused on eliciting non-stressed con-
ditions. The signals were pre-processed to extract sig-
nificant features to be used for classification models
that were trained in a supervised way. ML algorithms
including Support Vector Machine (SVM), Random
Forest (RF), and K-Nearest-Neighbor (KNN) were
employed.
This work is part of the PrevOccupAI project
(Biosignals LIBPhys-UNL, 2020), which has the sup-
port of the Portuguese Autoridade Tribut
´
aria and
Direc¸
˜
ao Geral da Sa
´
ude. The project aims to prevent
occupational diseases in the office context, through
the identification of risk factors to promote occupa-
tional health.
2 RELATED WORK
The advent of smart devices has sparked a plethora of
research that relies on the extraction of useful biosig-
nals and features from these devices, for different
classification tasks. In this section, a look will be
taken at selected studies that used information re-
trieved from non-invasive sensors and smart devices
to develop multimodal ML models for stress classifi-
cation.
In 2011 Choi et al. (Choi et al., 2011) devel-
oped a minimally invasive wearable sensor platform
allowing long-term ambulatory monitoring of men-
tal stress. Their system included HR, EMG, EDA,
and a pressure-based respiration sensor and was used
while exposing subjects to mental stress and relax-
ation conditions. After data collection, features were
extracted from the signals to train a logistic regres-
sion model to predict the two conditions. In the same
year, Wijsman and colleagues (Wijsman et al., 2011)
used EMG collected from the trapezius, RESP, EDA,
and ECG to identify mental stress. They distinguished
between stress and non-stress conditions using differ-
ent classifiers including KNN. In 2013, some of the
same authors (Wijsman et al., 2013b) investigated if
the trapezoids were suitable muscles for stress detec-
tion and concluded that they were (i.e., the EMG ex-
hibited greater amplitudes and fewer gaps - periods
of relaxation - during stress compared to a resting
state). Later on that year, the same authors (Wijs-
man et al., 2013a) used HR, RESP, Galvanic Skin Re-
sponse (GSR), and EMG of the upper trapezius mus-
cles to distinguish between states of stress and rest in
working contexts. They implemented stress tests that
were aimed to simulate office-like circumstances. All
studies used the arithmetic ”Norinder Test” on their
stress-inducing protocols. Finally, Pourmohammadi
and Maleki (Pourmohammadi and Maleki, 2020) con-
ducted research to compare the efficiency of the EMG
signal with the ECG signal in detecting mental stress.
According to their findings, EMG and ECG signals
can accurately diagnose stress levels. They demon-
strated that a classification based on the EMG signal
outperformed the ECG signal in the stress detection
field.
With regards to signal acquisition from smart
wearables, Ciabattoni et al. (Ciabattoni et al., 2017)
used a commercially available smartwatch to acquire
EDA, RR-interval, and skin temperature (ST). Sub-
jects were exposed to a 10-minute stress-inducing
logic test. They extracted 27 features after pre-
processing the data. The correlation between the ex-
tracted features and the reported stress was investi-
gated by calculating the mutual information. The 10
features with the highest correlation were then used
to train a KNN classifier (one neighbor) to predict
whether the subject was stressed or not. Siirtola and
colleagues (Siirtola, 2019) aimed to determine if it
was possible to properly identify stress using ACC,
BVP, EDA, HR, heart rate variability (HRV), and ST
signals extracted from a commercial smartwatch. Dif-
ferent combinations of these signals were tested and
the leading outcome was obtained with a combina-
tion of ST, BVP, and HR using Linear Discriminant
Analysis (LDA). Finally, Bobade et al. (Bobade and
Vani, 2020) sought to detect an individual’s stress
level by employing a multimodal dataset acquired
during stressful conditions using wearable physiolog-
ical and motion sensors. Using a chest-worn device
they collected three-axis ACC, ECG, BVP, ST, RESP,
EMG, and EDA. They performed a three-class and a
two-class classification and were able to obtain their
higher classification for both combinations using an
BIOSIGNALS 2023 - 16th International Conference on Bio-inspired Systems and Signal Processing
266

SVM algorithm.
The presented research focused on using either
smartwatches, wearable sensors, or a combination
of these. While smartwatches are devices that are
widely used, most other wearables are highly spe-
cialized equipment that can be associated with higher
costs. This work explored an acquisition system that
relies mostly on smart devices widely utilized by ev-
eryday workers: smartwatches and smartphones. Due
to the work of Wijsman et. al and Pourmohammadi
et. al showing the high significance of the EMG,
this modality was included as well. Unimodal models
for each biosignal were developed as well as a multi-
modal approach, to determine the classification capa-
bilities between these.
3 METHODS
3.1 Data
For the development of the ML models, data were
acquired on three different occasions. First, data
were collected from a 22-year-old female student
to develop an algorithm to extract respiration rates
(RespR) from a smartphone’s ACC. For the second
and third acquisitions, data were collected from 12
healthy volunteers (six female and six male) aged on
average 25.79 ± 7.19 years. Half of the participants
were students while the other half were office work-
ers. Before participating in the study, subjects were
informed they were not allowed to take drugs or med-
ications on a daily basis and asked for their informed
consent.
For the first data collection, a smartphone (Xi-
aomi, Redmi Note 9), an inductive respiration sen-
sor (RIP, PLUX Wireless Biosignals), and an ac-
celerometer (ACC, PLUX Wireless Biosignals) were
used, while for the second and third acquisitions
the same smartphone, a smartwatch (OPPO, OPPO
Watch 41 mm), and two EMG sensors (muscleBAN,
PLUX Wireless Biosignals) were utilized. The mus-
cleBAN is a wearable sensor unit that in addition to
the EMG also contains an ACC and a magnetometer.
With regards to the smartphone, its ACC was
used, which is restricted by the Android system to a
sampling rate of 100 Hz. The smartwatch was utilized
to acquire HR (1 Hz) and ACC (100 Hz) for synchro-
nization purposes. Given the smartwatch’s limited
battery capacity, an acquisition scheme was imple-
mented in which the HR sensor acquired data for 60
seconds every three minutes. The RIP, PLUX ACC,
and muscleBAN sensors were set to a sampling rate
of 1000 Hz. For all acquisitions, the cross-platform
application described in (Silva et al., 2022) was em-
ployed. The application was extended to permit data
collection from the RIP and PLUX ACC sensors.
3.2 ACC-Derived Respiration Rate
Using the smartphone and the RIP sensor, an algo-
rithm was designed to derive the RespR from the
smartphone’s ACC. The RespR extracted through the
developed algorithm was later used as input for the
stress classification models.
3.2.1 Experimental Setup and Protocol
The smartphone was placed on the subject’s chest us-
ing a harness, as shown in Figure 1a. The RIP sensor
was placed just below the phone, at the sternum, to
ensure that both sensors were recording RESP at ap-
proximately the same position. The PLUX ACC sen-
sor was attached to the back of the phone, using an
adhesive, ensuring that the coordinate systems of both
the phone’s ACC and the PLUX ACC were aligned.
Both PLUX sensors were plugged into an 8-channel
hub (PLUX Wireless Biosignals) that synchronously
collects data from the sensors and wirelessly transmits
the data to the smartphone component of the cross-
platform application.
Data acquisition was performed for 40 minutes.
In the beginning, the subject performed a jumping
motion that was later used to synchronize the sig-
nals of all devices. During the acquisition, three dis-
tinct breathing patterns were performed: conscious
slow breathing, conscious fast breathing, and uncon-
scious breathing while performing a mildly stressful
task. Each breathing task was executed for roughly
10 minutes with three minutes of baseline in-between
tasks. During slow breathing, the subject had her
eyes closed and was instructed to consciously keep
a steady breathing rhythm. When executing the fast
breathing task, the subject repeated three one-minute
fast breathing cycles with two minutes of relaxation
between cycles. For the final task, the subject per-
formed a high-difficulty level arithmetic test while her
breathing cycles were recorded.
3.2.2 Algorithm Development and Evaluation
The obtained signals from the sensors were first syn-
chronized by cross-correlation using the jumping mo-
tion clearly visible on the devices’ ACCs. Then, the
signal portions corresponding to the breathing tasks
were extracted. This was followed by applying a four-
order low-pass butter-worth filter with a cutoff fre-
quency of 0.5 Hz. All three axes of the smartphone’s
Multimodal Stress Classification Based on Biosignals Extracted from Smart Devices and Electromyography
267

(a) Smartphone. (b) Smartwatch. (c) MuscleBANs.
Figure 1: Equipment placement.
ACC were combined by
ACC
total
= ACC
2
x
+ ACC
2
y
+ ACC
2
z
. (1)
It was experimentally determined that the combi-
nation of the three axes produced better results than
using single axes or any pair-wise combination of
these. Finally, the second intrinsic mode function
(IMF-2) was extracted using empirical mode decom-
position (Zeiler et al., 2010).
The respiration detection algorithm follows a
peak-valley detection scheme, as the RESP signal
manifests itself as a quasi-cyclic waveform in the
ACC signal. First, the signal is divided into 60-second
windows (W
s
). In W
s
, the algorithm starts by finding
the first peak/valley. When this peak/valley is found,
a noise threshold is applied to disregard minor lo-
cal maxima/minima that might be caused by smaller
movements. The threshold is applied by placing the
current value into the center of a window (W
n
) of 5
seconds (empirically determined). The maximum and
minimum are determined within W
n
and half the dis-
tance between them is set as the current noise thresh-
old. All local maxima and minima that are below that
threshold are not regarded as peaks/valleys that result
from breathing. When the end of W
s
is reached, the
RespR, in breaths per minute (BPM) is calculated by
RespR =
f
s
d
avg
× 60 , (2)
where d
avg
is the average number of samples be-
tween two peaks and f
s
is the sampling rate. To eval-
uate the algorithm, the mean of the cross-correlation
between the pre-processed ACC and the RIP was cal-
culated. It was 0.57, 0.90, and 0.50 for slow breath-
ing, fast breathing, and mild-stress breathing, respec-
tively. The correlation values between both signals
show that the smartphone’s ACC can be used to ex-
tract the RespR. Furthermore, the error rate (ER) was
calculated by
ER =
# ACC false & non-detected peaks
# RIP peaks
. (3)
It was 0.375, 0.11, and 0.42 for the above periods,
respectively.
3.3 Stress Classification
Data were acquired using two protocols: one aimed
at inducing stress, and the other to elicit non-stressed
conditions. The studies were carried out in a quiet
space. Participants were asked to sit down in front of
a table on which a laptop was placed that displayed
the tasks to execute. The interaction was done solely
through the laptop’s trackpad.
3.3.1 Experimental Setup and Protocols
The smartphone was harnessed to the subject’s chest,
the smartwatch was placed on the wrist of the non-
dominant hand, and the two muscleBANs were posi-
tioned according to the recommendations stated in the
SENIAM project (Hermens et al., 2000), on the left
and right trapezius as illustrated in Figure 1. Prior to
placing the two muscleBANs, the subject’s skin was
cleansed with alcohol. The acquisitions took approx-
imately 10 minutes each and also began with a jump-
ing motion for device synchronization. The following
protocols were implemented in HTML, JavaScript,
and the CSS framework Bootstrap.
For the stress-inducing protocol, one cognitive
and one emotional task were performed. For these,
the ”Norinder Test”(Wijsman et al., 2013b) and the
”Sing a Song Test”(Brouwer and Hogervorst, 2014)
were used, respectively. The ”Norinder Test” is an
arithmetic test that has to be performed under time
constraints. The test consisted of 27 calculations that
had to be completed within a time frame of 2:30 min.
For each calculation, participants had a maximum
time of 10 seconds with four possible answer options.
If the wrong one was chosen, a loud buzzing sound
was played and a red screen was presented block-
ing the page for 3 seconds. To further increase stress
levels during calculations, visual timers were imple-
mented that changed their color from green to red
BIOSIGNALS 2023 - 16th International Conference on Bio-inspired Systems and Signal Processing
268
depending on the remaining time. When the timer
reached the five-second mark, it turned yellow and an
additional ticking sound was played. For the ”Sing
a Song Test”, participants were instructed to remain
seated in front of the computer monitor and silently
read 10 messages that would appear on the screen.
It was indicated that one of the messages could con-
tain a hidden task that had to be carried out. This test
also included a 10-second timer, with a colored circle
gradually changing from green to red, and a ticking
sound when the timer reached the five-second mark.
The first nine sentences were emotionally neutral, and
the tenth contained the hidden task, saying: “HID-
DEN TASK: Think of a song from your childhood.
When the clock stops, sing the song out loud.”.
The second protocol was designed to elicit non-
stressed conditions, so there were no time constraints.
It was created with a neutral design and implemented
in a monochromatic gray-scale (Um et al., 2012). Ad-
ditionally, low-volume relaxing music was played. To
decrease any stress levels the subjects might be ex-
periencing before the study, the protocol started with
a breathing exercise. The 4-7-8 breathing technique
was employed as it has been shown that it is an ef-
fective exercise for self-regulating stress (Lin et al.,
2020). This was then followed by two tasks. The
first consisted of observing 12 images of either natu-
ral landscapes or fractal images in shades of green and
blue. These were chosen due to their calming effects
(Kurt and Osueke, 2014). The second part of the pro-
tocol was inspired by (Um et al., 2012). Subjects were
presented with 12 neutral statements that consisted of
facts, that compel the reader to verify whether they
are true or not. This procedure results in unconscious
cognitive thinking without arousing strong emotions.
3.3.2 Pre-Processing and Feature Extraction
The Python programming language was utilized to
process and analyze the physiological signals as well
as develop the ML models. For pre-processing and
feature extraction, only data acquired while subjects
were performing tasks were considered. The retrieved
signals from the three device types were synchronized
with a cross-correlation function using the jumping
motion captured by the ACCs built into each device.
Regarding the HR, data were re-sampled to 5 Hz
using cubic interpolation for the periods in which the
smartwatch was recording. The signal was segmented
using an eight-second (empirically determined) slid-
ing window. Time features were extracted identically
to those found in Boonnithi et al. article (Boonnithi
and Phongsuphap, 2011).
For the smartphone’s ACC, the same pre-
processing steps were applied as described in section
3.2.2. From 60-second (empirically determined) slid-
ing windows, features were extracted including the
ones mentioned in Table 1.
Concerning the EMG signal, only features from
the left trapezius were extracted. All participants were
right-handed and they used the computer’s trackpad
more frequently during the stress protocol. Hence, in-
formation coming from this trapezius was less prone
to be adjusted to the protocols. Several features were
extracted from this signal at different pre-processing
steps in 60-second (empirically determined) sliding
windows. The signal was filtered using a fourth-order
band-pass butter-worth filter with 30Hz and 310Hz
cutoff frequencies. Then, the features shown in Ta-
ble 1 up to the total power were extracted. Subse-
quently, the signal was rectified and normalized us-
ing a maximum norm scheme, and features from the
maximum value to standard deviation in Table 1 were
extracted. In the final phase, a fourth-order low-pass
butter-worth filter with a cutoff frequency of 2 Hz was
utilized to make an envelope allowing for clear de-
tection of muscular activity periods from the signal.
From this, the remaining features shown in Table 1
were extracted.
To create the input vector for the multimodal
model, only periods in which all signals were simulta-
neously being acquired were considered as illustrated
in Figure 2. It was ensured that the end of each win-
dow was aligned in time. All windows were shifted by
4 seconds until the end of each HR data was reached.
This resulted in a total of 1 hour of acquisition infor-
mation from all subjects.
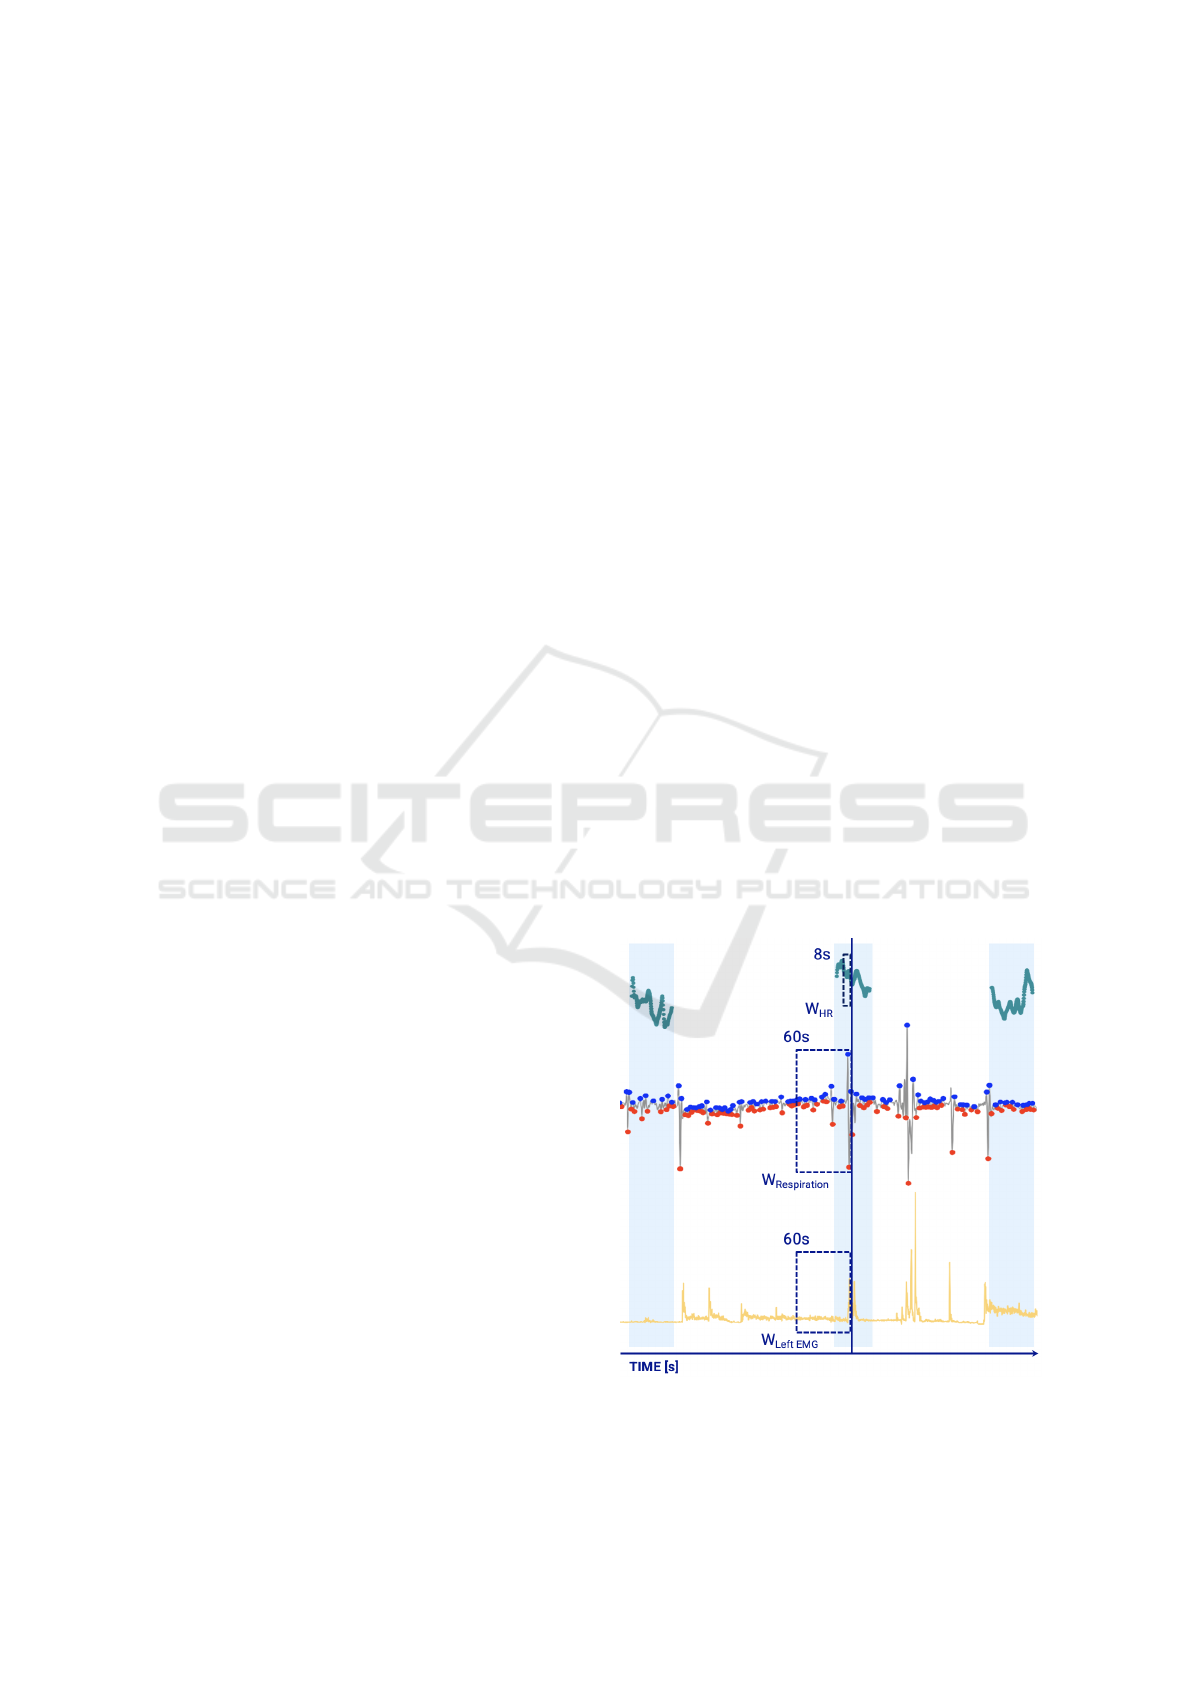
Figure 2: Multimodal Windowing Scheme.
Multimodal Stress Classification Based on Biosignals Extracted from Smart Devices and Electromyography
269

3.4 Machine Learning Models
SVM, RF, and KNN were employed as classifiers.
Data extracted from the stress-inducing protocol
was labeled as ’Stressed’ (165 instances) whereas
the one retrieved from the protocol inducing non-
stressed conditions (180 instances) was labeled as
’Not Stressed’. The labeled dataset was then ran-
domly separated into 60% training and 40% testing
in a stratified way, meaning that each participant’s
data could be part of either or both sets. Since lin-
ear models (like the employed SVM) produce distinct
outcomes depending on whether data are normalized
or not, both training and testing sets were normal-
ized with a min-max normalization. Each model was
trained using a 5-fold cross-validation. Metrics in-
cluding recall, specificity, precision, negative predic-
tivity, and accuracy were used to evaluate all models.
The models were developed using the scikit-learn
library (Pedregosa et al., 2011). Hyperparameters for
each algorithm were optimized using GridSearch. A
RepeatedStratifiedKFold was used with 5 folds and
15 iterations, as the cross-validation splitting strategy.
The SVM algorithm was setup with a linear kernel
and the cost parameter (C) was set to 10. The RF used
50 estimators, and a maximum depth of 5. For the
KNN algorithm a manhattan distance with 5 neigh-
bors was chosen. With regards to all other hyperpa-
rameters, their default values were set.
For feature selection, first correlated features
were removed using the TSFEL library (Fraunhofer
AICOS, 2021). Then Recursive Feature Elimination
(RFE) (Pedregosa et al., 2011) was applied. The se-
lected features for each model are displayed in Ta-
ble 1. The KNN algorithm does not provide feature
weights or coefficient attributes. Hence the RFE func-
tion couldn’t be applied to it. However, because fea-
ture selection also has an impact on this classifier’s
performance, the features that obtained the best re-
sults for the SVM and RF were used in KNN as well.
4 RESULTS AND DISCUSSION
The results for each model are presented in Table 2.
Regarding each specific model, the accuracies ob-
tained by the three classifiers were lower for the HR
model. A possible justification would be that this
model had access to a much smaller data set compared
to the others and used the fewest features to perform
stress classification. Both RESP and left EMG mod-
els attained high accuracies. Considering the mul-
timodal model, only data from periods in which all
sensors were acquiring were used. Thus, the amount
Table 1: Selected features for all models.
Biosignal Features Formula
HR
mRR
1.a,b,c; 4.b,c
∑
N
i=1
(RR
i
)
N
AE
1.a,b,c; 4.a,b,c
q
∑
N
i=1
(RR
i
−mRR)
2
N−1
CVRR
1.a,b,c; 4.a
SDRR×100
mRR
RESP
Nr. Peaks
2.a,b,c; 4.a,b,c
Count(peaks)
RespR
2.a,b,c; 4.a,b,c
f
s
d
avg
× 60
MedAD
2.a,b,c; 4.a,b,c
∑
N
i=1
|x
ACC
i
−med(x
ACC
)|
N
Std
2.a,b,c; 4.a,b,c
q
∑
N
i=1
(x
ACC
i
−x
ACC
)
2
N−1
Variance
2.a,b,c; 4.a,b,c
∑
N
i=1
(x
ACC
i
−x
ACC
)
2
N−1
AE
2.a,b,c; 4.a,b,c
|
∑
N
i=1
x
2
ACC
i
|
EMG
Mean Freq.
3.a,b,c; 4.a,b,c
∑
N
i=1
f
EMG
i
N
Median Freq.
3.a,b,c; 4.a,b,c
med( f
EMG
i
)
Max Freq.
3.a; 4.a
max
N
i=1
f
EMG
i
Nr. ZC
3.a,b,c; 4.a,b,c
{x
i
> 0and x
i+1
< 0}
or {x
i
< 0 andx
i+1
> 0}
and |x
i
− x
i+1
| ≥ ε
Total Power
3.a,b,c; 4.b,c
R
f
max
0
P
x
df
Max
3.a,b,c; 4.a,b,c
max
N
i=1
x
EMG
i
Min
3.b; 4.a,b,c
min
N
i=1
x
EMG
i
Mean
3.a,b,c; 4.a,b,c
∑
N
i=1
x
EMG
i
N
Std
3.a,b,c; 4.b,c
q
∑
N
i=1
(x
EMG
i
−x
EMG
)
2
N−1
Nr. Muscular
Activations
3.b,c; 4.a,b,c
Count(x
MA
)
Max Duration
3.a,b,c; 4.a,b,c
max
N
i=1
x
MA.Duration
i
Mean Duration
3.a,b,c; 4.a,b,c
∑
N
i=1
x
MA.Duration
i
N
Std Duration
3.a,c; 4.a,b
q
∑
N
i=1
(x
MA.Duration
i
−x
EMG
)
2
N−1
RMSA
3.a,b,c; 4.a,b,c
q
1
N
∑
N
i=1
x
2
MA
1 - HR 2 - Resp 3 - Left EMG 4 - Multimodal
a - SVM b - RF c - KNN
of information was significantly less than that of the
remaining models, the three of which did not obtain
BIOSIGNALS 2023 - 16th International Conference on Bio-inspired Systems and Signal Processing
270

Table 2: Models obtained accuracy values.
HR Resp
Left
EMG
Multimodal
SVM 57.5% 81.5% 86.0% 96.9%
RF 67.8% 87.6% 94.9% 100%
KNN 62.3% 89.1% 93.3% 100%
results as high as this one. It can be speculated that,
even with less data, a model that looks at multiple
modalities to recognize a stressful situation may per-
form better than unimodal models because it accesses
different physiological responses.
The SVM algorithm proved to consistently have
the lowest performance. Since the other two tech-
niques are non-linear, it can be deduced that adopting
linearity for the created models may not be the best
option. Both RF and KNN were well suited to classi-
fying stress for the selected biosignals with the chosen
protocols. Since participants were given clear instruc-
tions on how to wear all the equipment and they were
focused on completing the protocols, the obtained ac-
curacies could decrease in real-time detection. There
are no limitations on movement in daily life and peo-
ple usually perform many tasks at once, which makes
detection more complex. Recording these signals in
an uncontrolled environment can be challenging due
to a variety of factors, that affect physiology, other
than stress. Real-time stress detection performance
could deteriorate as a result of these challenges. One
possible solution to circumvent them would be to add
more pre-processing steps to the acquired signals and
attempt to retrieve them in conditions as similar as
possible to those experienced by the worker.
Referring to prior studies (Table 3) and comparing
the accuracy of various stress detection approaches,
the selected biosignals, and processing techniques
were found to be very efficient, attaining higher accu-
racies when compared to those obtained in almost all
of the mentioned studies. This model, as well as the
ones developed in these studies, are generic, mean-
ing that they can be used to analyze data from any
individual. Some research (Lawanont et al., 2018;
Shi et al., 2010; Akmandor and Jha, 2017) built per-
sonalized models, consistently outperforming gener-
alized models in assessments. Considering this, the
accuracy rates obtained with the created generalized
models are highly promising. Furthermore, related
studies did not examine in detail both cognitive and
emotional stress. Studying these two ”types” of stress
and/or how they behave separately/together can be
significant because these are the two most common
types of stress in office workers (Choi et al., 2011).
Table 3: Comparison of obtained accuracy with ones ob-
tained by related work studies.
Study Biosignals Accuracy
Wijsman
et al.
HR, RESP,
EMG, GSR
GEE: 74.5%
Wijsman
et al.
ECG, RESP,
EMG, SC
LBN, QBN, KNN,
FLSL: ≈80.0%
Choi et al.
HR, EMG,
EDA
LR: 81.0%
Ciabattoni
et al.
HR, GSR, ST
KNN: 84.5%
Siirtola
et al.
HR, BVP, ST
SVM: 87.4%
Bobade
et al.
ACC, ECG
EMG, EDA
ST,
SVM: 93.2%
Pourmoha-
mmadi et al.
ECG, EMG
SVM: 100%
This study
HR, RESP,
EMG
SVM: 96.9%
RF, KNN: 100%
5 CONCLUSION
For this paper, stress detection models were created
using three ML algorithms to analyze WRS. To ac-
complish this, an algorithm capable of accurately es-
timating an individual’s RespR was developed. Two
studies were conducted to collect biosignals. Then,
features were firstly extracted and secondly selected
to train a multimodal model that achieved accuracies
of 96,9% with the SVM algorithm, and 100% with
both RF and KNN algorithms.
The proposed multimodal model helps to identify
sensitive information about a person. Although mea-
suring office workers’ stress levels can be beneficial
to both users and companies, data management must
be done with great caution. Knowing from which spe-
cific individual the retrieved data belongs, according
to the General Data Protection Regulation (GDPR)
can potentially lead to improper use of this informa-
tion. To overcome this ethical issue, it is necessary to
ensure that personal data cannot be traced back.
ACKNOWLEDGEMENTS
This work was partly supported by Science and Tech-
nology Foundation (FCT), under the project PRE-
VOCUPAI (DSAIPA/AI/0105/2019). The authors
have no conflicts of interest to report.
Multimodal Stress Classification Based on Biosignals Extracted from Smart Devices and Electromyography
271

REFERENCES
Akmandor, A. O. and Jha, N. K. (2017). Keep the stress
away with soda: Stress detection and alleviation sys-
tem. IEEE Transactions on Multi-Scale Computing
Systems, 3(4):269–282.
Alberdi, A., Aztiria, A., and Basarab, A. (2016). Towards
an automatic early stress recognition system for office
environments based on multimodal measurements: A
review. Journal of biomedical informatics, 59:49–75.
Biosignals LIBPhys-UNL (2020). Biosignals - prevoccu-
pai. http://biosi.gnals.org/projects pages/prevocupai/
prevocupai.html. Accessed: 2022-10-20.
Bobade, P. and Vani, M. (2020). Stress detection with ma-
chine learning and deep learning using multimodal
physiological data. In 2020 Second International Con-
ference on Inventive Research in Computing Applica-
tions (ICIRCA), pages 51–57. IEEE.
Bolliger, L., Lukan, J., Colman, E., Boersma, L., Lu
ˇ
strek,
M., De Bacquer, D., and Clays, E. (2022). Sources
of occupational stress among office workers—a focus
group study. International Journal of Environmental
Research and Public Health, 19(3):1075.
Boonnithi, S. and Phongsuphap, S. (2011). Comparison of
heart rate variability measures for mental stress detec-
tion. In 2011 Computing in Cardiology, pages 85–88.
IEEE.
Brouwer, A.-M. and Hogervorst, M. A. (2014). A new
paradigm to induce mental stress: the sing-a-song
stress test (ssst). Frontiers in neuroscience, 8:224.
Can, Y. S., Arnrich, B., and Ersoy, C. (2019). Stress de-
tection in daily life scenarios using smart phones and
wearable sensors: A survey. volume 92. Academic
Press Inc.
Choi, J., Ahmed, B., and Gutierrez-Osuna, R. (2011). De-
velopment and evaluation of an ambulatory stress
monitor based on wearable sensors. IEEE trans-
actions on information technology in biomedicine,
16(2):279–286.
Ciabattoni, L., Ferracuti, F., Longhi, S., Pepa, L., Romeo,
L., and Verdini, F. (2017). Real-time mental stress de-
tection based on smartwatch. pages 110–111. Institute
of Electrical and Electronics Engineers Inc.
Curtarelli, M. (2022). Osh pulse - occupational safety and
health in post-pandemic worplaces.
Fraunhofer AICOS (2021). tsfel.utils package.
https://tsfel.readthedocs.io/en/latest/descriptions/
modules/tsfel.utils.html. Accessed: 2022-12-19.
Goncalves, F., Carneiro, D., P
ˆ
ego, J., and Novais, P. (2018).
X3s: A multi-modal approach to monitor and assess
stress through human-computer interaction. Com-
puter Science and Information Systems, 15:683–703.
Hermens, H. J., Freriks, B., Disselhorst-Klug, C., and Rau,
G. (2000). Development of recommendations for
semg sensors and sensor placement procedures. Jour-
nal of electromyography and Kinesiology, 10(5):361–
374.
Kurt, S. and Osueke, K. K. (2014). The effects of
color on the moods of college students. sage Open,
4(1):2158244014525423.
Lawanont, W., Mongkolnam, P., Nukoolkit, C., and Inoue,
M. (2018). Daily stress recognition system using ac-
tivity tracker and smartphone based on physical ac-
tivity and heart rate data. In International confer-
ence on intelligent decision technologies, pages 11–
21. Springer.
Lin, Z., Kunze, K., Ueki, A., and Inakage, M. (2020).
Aromacue-a scent toolkit to cope with stress using the
4-7-8 breathing method. In Proceedings of the Four-
teenth International Conference on Tangible, Embed-
ded, and Embodied Interaction, pages 265–272.
Pedregosa, F., Varoquaux, G., Gramfort, A., Michel, V.,
Thirion, B., Grisel, O., Blondel, M., Prettenhofer, P.,
Weiss, R., Dubourg, V., et al. (2011). Scikit-learn:
Machine learning in python. the Journal of machine
Learning research, 12:2825–2830.
Pourmohammadi, S. and Maleki, A. (2020). Stress de-
tection using ecg and emg signals: A comprehen-
sive study. Computer methods and programs in
biomedicine, 193:105482.
Salai, M., Vass
´
anyi, I., and K
´
osa, I. (2016). Stress detection
using low cost heart rate sensors. Journal of health-
care engineering, 2016.
Shi, Y., Nguyen, M. H., Blitz, P., French, B., Fisk, S., De la
Torre, F., Smailagic, A., Siewiorek, D. P., al’Absi, M.,
Ertin, E., et al. (2010). Personalized stress detection
from physiological measurements. In International
symposium on quality of life technology, pages 28–29.
Siirtola, P. (2019). Continuous stress detection using the
sensors of commercial smartwatch. pages 1198–1201.
Association for Computing Machinery, Inc.
Silva, S., Cepeda, C., Rodrigues, J., Probst, P., and Gam-
boa, H. (2022). Assessing occupational health with
a cross-platform application based on self-reports and
biosignals. In HEALTHINF, pages 549–556.
Um, E., Plass, J. L., Hayward, E. O., Homer, B. D., et al.
(2012). Emotional design in multimedia learning.
Journal of educational psychology, 104(2):485.
Wijsman, J., Grundlehner, B., Liu, H., Hermens, H., and
Penders, J. (2011). Towards mental stress detection
using wearable physiological sensors. In 2011 An-
nual International Conference of the IEEE Engineer-
ing in Medicine and Biology Society, pages 1798–
1801. IEEE.
Wijsman, J., Grundlehner, B., Liu, H., Penders, J., and
Hermens, H. (2013a). Wearable physiological sen-
sors reflect mental stress state in office-like situations.
In 2013 humaine association conference on affective
computing and intelligent interaction, pages 600–605.
IEEE.
Wijsman, J., Grundlehner, B., Penders, J., and Hermens, H.
(2013b). Trapezius muscle emg as predictor of men-
tal stress. ACM transactions on embedded computing
systems (TECS), 12(4):1–20.
Zeiler, A., Faltermeier, R., Keck, I. R., Tom
´
e, A. M., Pun-
tonet, C. G., and Lang, E. W. (2010). Empirical mode
decomposition-an introduction. In The 2010 interna-
tional joint conference on neural networks (IJCNN),
pages 1–8. IEEE.
BIOSIGNALS 2023 - 16th International Conference on Bio-inspired Systems and Signal Processing
272
