
When Simple Statistical Algorithms Outperform Deep Learning: A Case
of Keystroke Dynamics
Ahmed Anu Wahab
a
and Daqing Hou
b
Electrical and Computer Engineering, Clarkson University, Potsdam, NY, USA 13699-5720, U.S.A.
Keywords:
Behavioral Biometrics, Keystroke Dynamics, Statistical Algorithms, Deep Neural Network, Siamese Network.
Abstract:
Keystroke dynamics has gained relevance over the years for its potential in solving practical problems like
online fraud and account takeovers. Statistical algorithms such as distance measures have long been a com-
mon choice for keystroke authentication due to their simplicity and ease of implementation. However, deep
learning has recently started to gain popularity due to their ability to achieve better performance. When should
statistical algorithms be preferred over deep learning and vice-versa? To answer this question, we set up ex-
periments to evaluate two state-of-the-art statistical algorithms: Scaled Manhattan and the Instance-based Tail
Area Density (ITAD) metric, with a state-of-the-art deep learning model called TypeNet, on three datasets (one
small and two large). Our results show that on the small dataset, statistical algorithms significantly outperform
the deep learning approach (Equal Error Rate (EER) of 4.3% for Scaled Manhattan / 1.3% for ITAD versus
19.18% for TypeNet). However, on the two large datasets, the deep learning approach performs better (22.9%
& 28.07% for Scaled Manhattan / 12.25% & 20.74% for ITAD versus 0.93% & 6.77% for TypeNet).
1 INTRODUCTION
Keystroke dynamics is the analysis of an individual’s
typing rhythm, which can be used for authentication.
It uses the extracted timing features such as latency
between key presses to identify typing patterns. It
is passive, non-intrusive, requires no additional hard-
ware, and runs in the background frictionlessly, ren-
dering it a promising solution to growing problems
related to online fraud, identity theft and account
takeovers. Keystroke dynamics can be categorized by
length (short or long), typing behavior (constrained or
unconstrained), and content (fixed-text or free-text).
Fixed-text is when the content typed is fixed and re-
mains unchanged, such as passwords. Free-text refers
to the case when the user is allowed to type freely
without restriction, such as writing an article on a
topic of the writer’s choice. However, the typed con-
tent can also sit between fixed- and free-text, hence
termed semi-fixed-text (Wahab et al., 2021).
Keystroke dynamics often make use of statisti-
cal algorithms such as distance/similarity measures,
cluster analysis, and probabilistic measures (Teh
et al., 2013). We consider such statistical algorithms
“simple” because the distance/similarity measures
a
https://orcid.org/0000-0003-4677-5269
b
https://orcid.org/0000-0001-8401-7157
on which they make decisions, are calculated using
statistics such as mean, variance, and percentiles. Un-
til recently, statistical algorithms have been the state-
of-the-art in keystroke dynamics. However, since
2020, TypeNet, a deep learning approach, has become
the new state-of-the-art (Acien et al., 2021). The
TypeNet network acts as a feature extractor to pro-
duce embeddings, which are then fed into a Euclidean
distance scoring scheme for authentication. The net-
work is a Siamese Neural Network, or SNN (Bromley
et al., 1993) consisting of two or more identical sub-
networks.
TypeNet has been shown to deliver supe-
rior performance based on the free-text Aalto
datasets (Dhakal et al., 2018), (Palin et al., 2019).
Will deep learning mark the end of statistical algo-
rithms? To gain insights into this question, we eval-
uated TypeNet against two state-of-the-art statistical
algorithms (ITAD (Ayotte et al., 2020) and Scaled
Manhattan Distance) on three datasets (Aalto desktop,
Aalto mobile, and the CU mobile touch). For the deep
learning approach, we first successfully replicated the
TypeNet architecture; using the same procedure and
hyper-parameters as described in (Acien et al., 2021),
our replicated TypeNet was able to achieve similar
performance on the Aalto datasets. We then trained
and tested the same TypeNet architecture with a dif-
ferent dataset (CU mobile touch). For the statistical
Wahab, A. and Hou, D.
When Simple Statistical Algorithms Outperform Deep Learning: A Case of Keystroke Dynamics.
DOI: 10.5220/0011684100003411
In Proceedings of the 12th International Conference on Pattern Recognition Applications and Methods (ICPRAM 2023), pages 363-370
ISBN: 978-989-758-626-2; ISSN: 2184-4313
Copyright
c
2023 by SCITEPRESS – Science and Technology Publications, Lda. Under CC license (CC BY-NC-ND 4.0)
363

approach, we implemented two state-of-the-art sta-
tistical algorithms (ITAD and Scaled Manhattan Dis-
tance) on all three datasets. Our results show that the
deep learning approach (TypeNet) is suitable for large
datasets, but performs poorly on a small dataset. In
contrast, the two simple statistical algorithms signif-
icantly outperform the deep learning approach on a
small dataset, but poorly on the two large datasets.
The paper is organized as follows. Section 2 sur-
veys related work. Sections 3, 4, and 5 describe the
three datasets used, the statistical and deep learning
algorithms, and the experimental procedures and re-
sults, respectively. Section 6 concludes the paper.
2 RELATED WORK
Common features used in keystroke dynamics are the
timing information such as monographs, digraphs,
trigraphs and N-graphs (Wahab et al., 2021), (Ay-
otte et al., 2020), (Gunetti and Picardi, 2005), (Kil-
lourhy and Maxion, 2009). On a publicly available
fixed-text dataset (CMU dataset) collected from 51
subjects where each subject typed the same pass-
word “.tie5Roanl” 400 times in a total of 8 sessions,
Killourhy and Maxion applied 14 verification algo-
rithms and reported Scaled-Manhattan (9.6%), Maha-
lanobis (10%) and Outlier Count (10.2%) as the top-
3 best performing algorithms (Killourhy and Max-
ion, 2009). Zhong et al. used a new distance met-
ric and modified the Nearest Neighbor with outlier
removal and achieved an Equal Error Rate (EER) of
8.4% on the CMU dataset (Zhong et al., 2012). In
order to drive down error rates, fusion techniques,
such as weighted score-level fusion, have also been
explored (Wahab et al., 2021). On a free-text dataset
(Clarkson II), Murphy et al. applied an algorithm
developed by Gunetti and Picardi and obtained 10%
EER with 10 genuine samples consisting of 1,000
keystrokes each (Murphy et al., 2017). Ayotte et al.
used 6 statistical algorithms on the same free-text
dataset and achieved 7.8% EER with a test sample
size of 200 DD digraphs and a profile of 10,000 DD
digraphs (Ayotte et al., 2020).
More recently, the deep learning approach has
yielded competitive results for keystroke dynamics,
especially on large-scale datasets. Deng and Zhong
created a new probabilistic generative model (Deep
Belief Nets), which was trained as a binary classifier
on the CMU dataset with 200 genuine user samples,
and tested with the remaining 200 genuine samples
and a randomly generated 250 impostor samples. The
model achieved an EER of 3.5% (Deng and Zhong,
2013). Maheshwary et al. produced a slightly im-
proved performance of 3% EER on the same dataset
with their feed-forward neural network model called
Deep Secure (Maheshwary et al., 2017).
Acien et al. (Acien et al., 2021) created a
deep learning architecture called TypeNet, using the
siamese neural network (SNN) and trained using the
Aalto desktop (Dhakal et al., 2018) and mobile (Palin
et al., 2019) datasets. Authors used three loss func-
tions: Softmax loss, Contrastive loss and Triplet loss.
The Triplet loss was reported to be the best, achiev-
ing EERs of 2.2% and 9.2% for desktop and mobile
datasets respectively, with 5 gallery samples of 50
keystrokes each. They also tested the models trained
with the Aalto datasets against a couple of third-
party smaller datasets (without retraining), but which
yielded poor performance. The poor performance is
probably due to the fact that the nature / settings of the
tested datasets are different from one used for training
the TypeNet model. In contrast, we trained and tested
the algorithms on the same datasets.
3 DATASETS
This study makes use of three keystroke datasets -
two large, free-text datasets (the Aalto Desktop and
Mobile datasets), and a semi-fixed text dataset from
mobile phones (CU mobile touch dataset), which is
created by our lab.
3.1 The Aalto Desktop and Mobile
Datasets
The Aalto university desktop (Dhakal et al., 2018) and
mobile (Palin et al., 2019) datasets are two large-scale
datasets collected using an online typing test on desk-
top computers and mobile devices. The Aalto desk-
top dataset consists of 168,000 participants, each tran-
scribing 15 English sentences randomly drawn from a
set of 1,525 examples with a maximum of 70 charac-
ters per sentence. The Aalto mobile dataset followed
the same procedure as the Aalto desktop dataset but
on mobile devices, and with 37,370 participants.
3.2 The CU Mobile Touch Dataset
The Clarkson University (CU) mobile touch is a small
but unique dataset consisting of a total of 327,000
keystrokes, collected from 39 subjects on a touch-
screen mobile device. Data was collected in a lab-
oratory setting and each subject visited twice. In
the first visit, each subject filled an enrollment form,
using his/her information, ten times. In the second
ICPRAM 2023 - 12th International Conference on Pattern Recognition Applications and Methods
364
Table 1: Number of genuine and impostor samples per sub-
ject in the CU mobile touch dataset.
# subjects # genuine
24 15
8 10
5 14
1 16
1 13
# subjects # imposter
13 8
13 10
7 6
1 2
1 4
1 5
visit, each subject completed the same form five more
times, making a total of 15 genuine samples, after
which two other subjects’ information and credentials
were shared with the subject to fill the form with, each
twice. This was used as impostor attack samples.
The enrollment form consists of: Full name, Ad-
dress, City, Zip, Phone, Email, Declaration, and Pass-
word. The declaration affirms the truthfulness of the
user input. Subjects were prevented from using the
copy and paste features. 36 subjects were attacked
and only 31 of 39 subjects visited twice and com-
pleted more than 10 genuine samples as shown in Ta-
ble 1.
The uniqueness of this dataset comes from the fact
that impostors have typed the exact same content as
the genuine users. However, each subject’s data (per-
sonal information) is both different from others and
fairly long. Therefore the CU mobile touch dataset
is neither fixed- nor free-text but sits between both,
and can be called “semi-fixed-text”. In this work, we
will be exploring two cases for this dataset: same con-
tent and different content. When considering the same
content, only data from impostors who typed the same
content as the genuine subject are used as the impos-
tor data. For different content, data from other sub-
jects who typed different content from the genuine
user are used as impostor data.
4 METHODS
In this section, we describe our data preprocessing
procedure and features, and the two authentication ap-
proaches (statistical algorithms and deep learning).
4.1 Data Preprocessing and Features
The datasets were preprocessed leveraging the
strength of each authentication approach. For the
statistical algorithms, we extracted 5 timing-features
(monographs and digraphs) from each of the datasets.
These features are M, UD, DD, UU, DU, where M is
the duration between the press and release of a sin-
gle (same) key; U and D represent UP (release) and
DOWN (press). Hence, UD is the time interval be-
tween the release of a key and the press of the next
key. Most of these extracted timing-features have val-
ues ranging between 0 and 1. In keystrokes, the keys
typed are also distinguishable features, so two addi-
tional features, Key1 and Key2 which are the two keys
that generated the digraph duration, were added to the
timing-features. Overall, 7 features were extracted for
the statistical algorithms.
For the deep learning approach, we created 5 fea-
tures as described in (Acien et al., 2021). These fea-
tures are M, UD, DD, UU and ID. The ID is the ASCII
value of key pressed/released divided by 255, which
forces the values to range between 0 and 1.
4.2 Statistical Algorithms
Statistical algorithms rely on mathematical represen-
tations of the input data. They have gained popularity
in keystroke dynamics (Killourhy and Maxion, 2009),
(Ayotte et al., 2020), (Wahab et al., 2021) because of
their simplicity and ease of implementation.
We have used two state-of-the-art statistical al-
gorithms - the scaled Manhattan distance and the
Instance-based similarity metric called tail area den-
sity (ITAD). These algorithms are used for computing
distances / similarity scores.
D =
1
N
N
∑
i=1
∥µ
g
i
− x
i
∥
σ
g
i
(1)
S
i
=
CDF
gi
(x
i
), if x
i
≤ M
gi
1 −CDF
gi
(x
i
), if x
i
> M
gi
(2)
Similarity Score =
1
N
N
∑
i=1
S
i
(3)
4.2.1 Scaled Manhattan Distance
The scaled Manhattan distance is derived by dividing
the Manhattan distance by the standard deviation, a
scaling factor used to standardize the values (Black,
2019). The formula is given in Equation 1, where N
is the number of shared graphs between the test sam-
ple and the gallery, x
i
is the individual test graph du-
ration for the i
th
shared graph in the test sample, and
µ
g
i
and σ
g
i
are the mean and standard deviation of the
i
th
graph in the gallery (Killourhy and Maxion, 2009).
Graphs distances are averaged for a fairer comparison
between the gallery and test sample.
4.2.2 Instance-Based Tail Area Density (ITAD)
The ITAD metric (Ayotte et al., 2020) is an instance-
based metric that relies solely on the tail area under
When Simple Statistical Algorithms Outperform Deep Learning: A Case of Keystroke Dynamics
365

the PDF of each keystroke dynamics graph, or the
percentile value of each graph in the sample. The
ITAD metric formula is given in Equation 2, where
CDF
gi
is the empirical cumulative distribution func-
tion of the ith graph in the gallery, M
gi
is the median
of the ith graph in the gallery, x
i
is the individual test
graph duration for the ith graph in the test sample that
was shared with the gallery, and N is the number of
graphs shared between the test sample and the gallery.
The ITAD metric scores for the N graphs are averaged
into a single similarity score as given in Equation 3.
The scaled Manhattan distance is based on the
mean and standard deviation and therefore are sus-
ceptible to outliers (Ayotte et al., 2020). The ITAD
metric, on the other hand, uses the percentile value
which makes it more resistant to outliers, and there-
fore is likely to make better authentication decisions.
4.3 TypeNet Architecture
We replicated the TypeNet architecture (Acien et al.,
2021), which is the state-of-the-art for free-text
keystroke dynamics. The TypeNet architecture, as
shown in Figure 1a, consists of a masking layer; batch
normalization layers; two LSTM layers of 128 units
each (tanh activated), and a dropout layer (0.5) as a
regularization technique to prevent overfitting.
The TypeNet architecture is an SNN. SNN is a
class of neural network architectures that contain two
or more identical sub-networks with identical config-
urations, parameters, and weights. It is used to find
the similarity between inputs by comparing the em-
beddings (output vectors) of the sub-networks. A
major issue with the traditional neural network that
learns to predict multi-classes is that the model needs
to be retrained from scratch when a class is removed
or new classes are added to the data. Also, the tra-
ditional neural network needs a large volume of data
per class to train efficiently. SNN, on the other hand,
learns a similarity function - if the input samples are
similar or different - and as such does not require as
much data as the traditional neural networks. With
this feature, new (unseen) classes of data can be pre-
dicted without the need to retrain the model.
TypeNet evaluated three LSTM loss functions:
Softmax loss, Contrastive loss, and Triplet loss (Acien
et al., 2021) and reported that the Contrastive loss and
Triplet loss yielded the best performance, so our repli-
cated TypeNet used these two loss functions.
In Contrastive loss, pairs of input samples belong-
ing to the same subject are pulled together in the em-
bedding space, while pairs of input from different
subjects are pushed apart. As defined in Equation 4,
the loss is low when pairs of input from the same sub-
ject have embeddings that are similar (closer), and
pairs of input from different subjects have embed-
dings that are different (farther). Two sub-networks
receiving two input samples are required when using
the Contrastive loss (Figure 1b). L
i j
is the true label
for each pair, set to 0 for pairs from the same subject,
and 1 for pairs from different subjects. f(·) is the em-
bedddings (output) from the sub-network. d(x
i
,x
j
)
is the euclidean distance between the model embed-
dings for the inputs x
i
and x
j
. The margin (m) is the
allowable minimum difference between embeddings
of the positive and negative samples.
L
c
= (1 − L
i j
)
d
2
(x
i
,x
j
)
2
+ L
i j
max
2
{0,m − d
2
(x
i
,x
j
)}
2
(4)
d(x
i
,x
j
) = ||f(x
i
) − f(x
j
)|| (5)
As defined in Equation 6, the Triplet loss, intro-
duced in (Schroff et al., 2015), is a loss function that
compares a baseline input (anchor) to both a posi-
tive input and a negative input. The positive sample
is from the same subject as the anchor, whereas the
negative samples from a different subject as the an-
chor. The goal is to minimize the distance between
the anchor and the positive embeddings, while maxi-
mizing the distance between the anchor and the nega-
tive embeddings. The triplet loss function uses three
sub-networks with three inputs (Figure 1c). x
A
, x
P
and x
N
are the input triplets, and m is the margin.
L
t
= max{0, d
2
(x
i
A
,x
i
P
) − d
2
(x
i
A
,x
j
N
) + m} (6)
5 EXPERIMENTAL
PROCEDURES AND RESULTS
This section describes the experimental procedures
and results for both approaches.
5.1 Procedure for Statistical Algorithms
Using the datasets, we randomly sampled 1,000 sub-
jects from the total subjects (168,000 and 37,370 for
the Aalto desktop and mobile datasets respectively).
Each subject had completed 15 sentences and we used
only 70 keystrokes per sentence. The first 10 sen-
tences were used as gallery samples and the remain-
ing 5 were used as the genuine test samples. One ran-
dom sentence (any one of fifteen) was selected from
each of the other subjects, which were used as im-
postor samples. Therefore, there are 5 genuine scores
and 999 impostor scores per user, per feature. These
ICPRAM 2023 - 12th International Conference on Pattern Recognition Applications and Methods
366
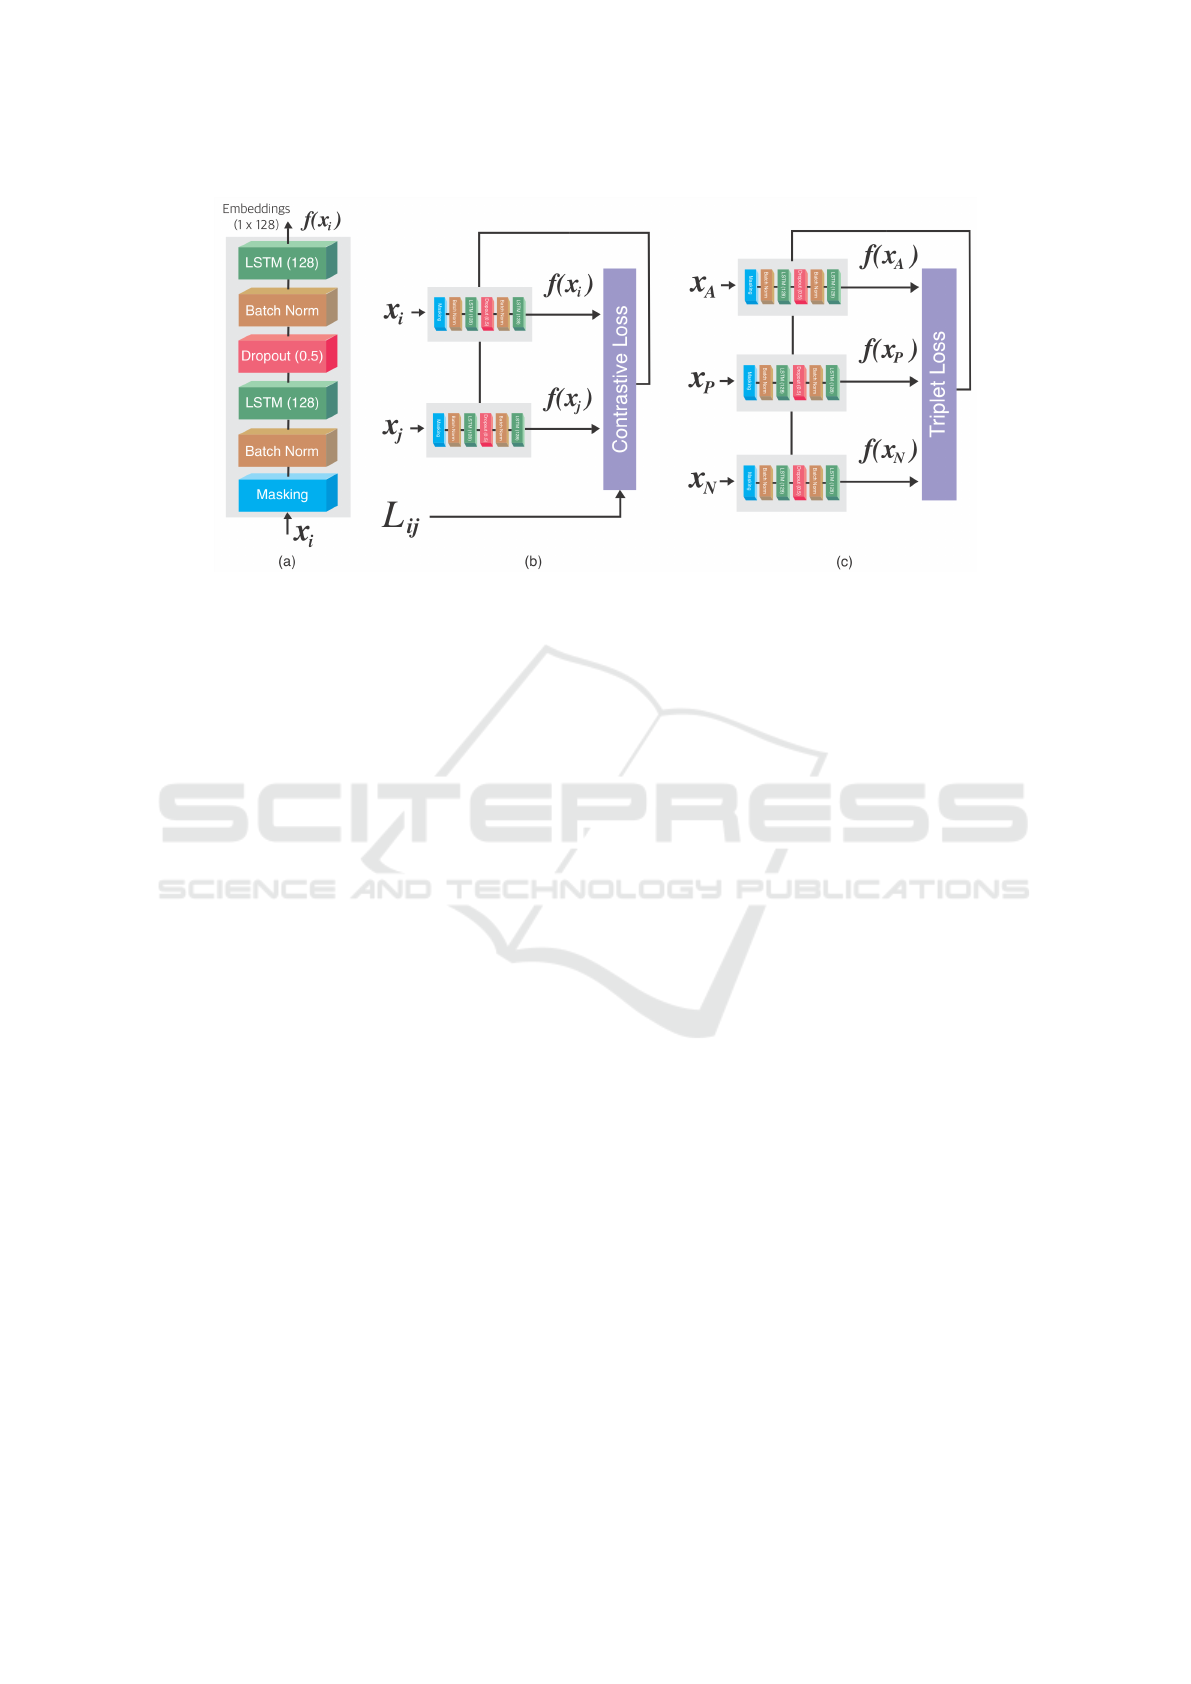
Figure 1: (a) TypeNet architecture for free-text keystroke sequences, where x
i
is a time series input with shape L × 5
(keystrokes × keystroke features) and f(x
i
) is the output (embedding vector with shape 1×128). (b) TypeNet learning ar-
chitecture with Contrastive loss and (c) Triplet loss.
scores are averaged across all features (M, UD, DD,
UU). We computed the EER for each user and re-
ported the average EER across all subjects. For com-
pleteness and fairness in the sampling process, we re-
peated the process ten times.
A similar procedure was followed for the CU mo-
bile dataset, except that the impostors data were pre-
pared differently. There are two cases to the CU mo-
bile dataset. For the “same content” case, data from
impostors who have typed the same content (informa-
tion) as the genuine subject are used as the impostor
samples. 31 subjects completed at least 13 sessions.
Therefore, each subject has up to 5 (at least 3) genuine
scores, but the numbers of impostor samples are rela-
tively small as shown in Table 1, ranging from 2 to 10
per subject. For the “different content” case, the first
10 sessions’ data from all other subjects who typed
different content from the genuine subject are used as
impostor samples. Each subject has up to 5 (at least 3)
genuine samples and 30∗10 = 300 impostor samples.
We used 70 and 150 keystrokes per sample.
5.2 Procedure for Deep Learning
For the Aalto desktop dataset, we replicated the model
as described in (Acien et al., 2021) by training with
68,000 subjects which were randomly selected from
the total (168,000) subjects, while the remaining were
used as test subjects. Recall that the Contrastive loss
takes pairs of input, so we randomly generated pairs
from the train subjects. Each subject had completed
15 sentences, therefore, there are 15∗14/2 = 105 pos-
sible genuine pairs and 15 ∗ (68000 − 1) ∗ 15 = 15.3
million possible impostor pairs per subject. We im-
plemented a batch data generator that randomly gen-
erates 512 sequences of pairs per batch, sequence
length of 70 keystrokes, and each batch contains
equal amount of genuine and impostor pairs - 256 se-
quences each. For the Triplet loss, we implemented a
batch data generator that randomly generates 512 se-
quences of triplets (A, P, N) per batch with sequence
length of 70 keystrokes, where A and P are keystroke
samples from the same subject and N is a keystroke
sample from any of the other subjects. The Aalto mo-
bile dataset experiments follow the same procedure,
except that training was done with 30,000 subjects
and the remaining 7,370 were used as test subjects.
We trained four models in total - the Contrastive
and Triplet loss models for the Aalto desktop and mo-
bile datasets respectively. Each model was trained for
200 epochs, 150 steps per epoch and a batch size of
512 sequences per batch. The model was tuned us-
ing the hyper-parameters given in (Acien et al., 2021),
i.e., Adam optimizer with β
1
= 0.9, β
2
= 0.999 and
ε = 10
−8
, learning rate of 0.05 and a margin of 1.5.
For testing the trained models, 1,000 subjects
were randomly selected from the respective dataset’
test subjects and there was no overlap between the
train and test subjects. For each test subject, we se-
lected a random sentence, each from the other 999
test subjects, as the impostor test sentences. We then
passed the 15 genuine sentences x
i
and the 999 im-
postor sentences x
j
as input to the trained model for
prediction. The first G embeddings from the genuine
embeddings are used as the gallery and the last 5 em-
beddings as the query embeddings. We computed a
pairwise euclidean distance between the gallery and
the query embeddings, and also between the gallery
When Simple Statistical Algorithms Outperform Deep Learning: A Case of Keystroke Dynamics
367

and the impostor embeddings. The test scores are the
column-wise average of the pairwise distances. We
calculated the EER using these scores and have used
G = 1,2,5,7, 10.
For the CU mobile dataset, We have only trained
models with the Triplet loss because it was reported
to give the best performance. For completeness and
fairness in selection, we performed 10-fold cross val-
idation for both cases. For the “same content” case,
we randomly selected 30 out of the 36 subjects that
had impostor data for training, and the remaining 6
for testing. We created a data generator to gener-
ate sequences of triplets (A, P, N) per batch with se-
quence length of L keystrokes, where L = {70 and
150}, and N is a keystroke sample from other subjects
who typed the same content as the genuine subject.
Because CU mobile touch is a much more smaller
dataset, we trained the model for 100 epochs; 100
steps per epoch; and a batch size of 128 sequences.
For hyper-parameter tuning, we tried different com-
binations and the best results were achieved using
the Adam optimizer with β
1
= 0.9, β
2
= 0.999 and
ε = 10
−8
, learning rate of 3e
−5
and margin of 1.5.
To test this model, we followed similar testing
procedure as described earlier, except that the impos-
tor samples per subject K is in the range 2 <= K <=
10 (see Table 1), and we have set G = 10. For the “dif-
ferent content” case, in order to utilize all 39 subjects
in the dataset, we randomly selected 6 subjects who
had 13 or more samples as test subjects, while using
the remaining 33 subjects for training. Our careful
choice of test subjects is to ensure that there will be
at least 3 genuine scores after 10 samples are used as
gallery samples. We created a data generator to gen-
erate sequences of triplets (A, P, N) per batch with se-
quence length of L keystrokes, where N is a keystroke
sample from other subjects who typed different con-
tent from the genuine subject. We created a model
similar to the “same content” above.
To test this model trained for the “different con-
tent” case, for each subject, we selected the first 10
samples, each from the other 5 test subjects, as the
impostor test samples (5 ∗ 10 = 50). We then passed
R genuine samples x
i
and the 50 impostor samples x
j
as input to the trained model for prediction, where R is
number of genuine samples per user and in the range
13 <= R <= 15. Every other procedure remains as
described in earlier testing procedure, and G = 10.
5.3 Results for Statistical Algorithms
Starting with the Aalto datasets results (Table 2), we
observed that the ITAD metric performed the best for
both Desktop and Mobile datasets. This is consistent
Table 2: Results of running statistical algorithms (% EER)
on the Aalto Desktop and Mobile datsets with 1,000 test
users. SM represents Scaled Manhattan. Each sample con-
sists of 70 keystrokes.
Aalto Desktop Aalto Mobile
Run SM ITAD SM ITAD
1 23 12.34 28.7 20
2 23 12.39 28.2 20.7
3 23.4 12.37 27.9 20.9
4 22.1 12.35 27.1 20.8
5 22.9 11.93 28 21.1
6 22.8 11.98 28.6 21.1
7 23.5 12.88 28 20.1
8 22.7 12.04 28.2 21.63
9 22.8 12.08 28.1 20.5
10 22.8 12.23 27.9 20.6
Average 22.9 12.25 28.07 20.74
Table 3: Results of running statistical algorithms (% EER)
on the CU mobile Touch dataset with sequence length of
(L) keystrokes.
Case L Users SM ITAD
Same Content
70 30 5.56 2.56
150 30 4.3 1.3
Different Content
70 31 19.78 9.92
150 31 11.2 4.08
with our expectation as the ITAD metric solely relies
on the tail area under the PDF (Probability Density
Function) which makes it more resistant to outliers
(Ayotte et al., 2020). Furthermore, the Desktop re-
sults (12.25% EER) are significantly better than the
Mobile (20.74% EER), an observation that is consis-
tent with (Acien et al., 2021). Possible explanation to
this, amongst many, is the quality of data captured on
each of the platforms. For example, desktop comput-
ers use physical keyboards which are large enough to
make typing relatively easy compared to Mobile de-
vices which uses virtual keyboards with small layout.
The CU dataset results are quite more interesting
based on the two cases involved. As shown in Table
3, the best performance of 1.3% EER was recorded
for the “same content” case. In this case, impos-
tors typed the same content with the genuine sub-
ject. Therefore, there would be many more shared
graphs between the profile and query samples, unlike
the “different content” case where impostors typed
different content from the genuine subject. Also, we
see familiarity with content as a benefit to the “same
content” case. That is, genuine subjects are likely to
be more familiar with typing their personal informa-
tion than an impostor would, making authentication
decision a lot easier than the “different content” case.
ICPRAM 2023 - 12th International Conference on Pattern Recognition Applications and Methods
368

Table 4: Results of running TypeNet (deep learning) (% EER) on the Aalto Desktop and Mobile datsets using Contrastive and
Triplet loss. EER is from a single run with a configuration of G enrollment embeddings. Sequence length is 70 keystrokes.
Enrollment Embeddings G
Loss 1 2 5 7 10
Desktop
Contrastive 9.28 7.95 6.5 6.2 5
Triplet 3.8 2.17 1.2 1.18 0.93
Mobile
Contrastive 14.5 14 12 11.2 11
Triplet 11.2 9.4 7.78 7 6.77
Table 5: Results of running TypeNet (deep learning) (% EER) on the CU mobile dataset (Triplet loss). Sequence length = 70.
Run (Enrollment Embeddings G=10)
Case L 1 2 3 4 5 6 7 8 9 10 AVG
Same Content
70 21.62 27.71 17.5 17.64 20.04 22 22.81 14.38 16 19.45 19.92
150 19.5 24.34 15.83 18.5 10.66 20.5 21.87 16.8 15.63 28.13 19.18
Different Content
70 28 13.33 11.17 17.06 27.53 10.5 6 17 4.56 15.78 15.09
150 23.33 7.72 10.22 16.39 28.53 9.72 4.5 18 13.72 11 14.31
5.4 Results for Deep Learning
We replicate the TypeNet architecture by using it on
the Aalto Desktop and Mobile datasets and compar-
ing our results with what was reported in the original
work (Acien et al., 2021). The results shown in Table
4 strengthened our confidence that we have accurately
replicated the TypeNet architecture, which therefore
validates the results obtained when the same architec-
ture is used on a different dataset. We obtained the
best results of 0.93% and 6.77% EERs for the Desk-
top and Mobile datasets respectively.
Our results with Triplet loss are all slightly better
than those reported in the original work, and results
with the Contrastive loss are very close too.
Table 5 shows the results for the CU mobile
touch dataset. The “different content” average EER
(14.83%) are better than the “same content” average
EER (19.18%). Although contrary to what was ob-
served in the statistical algorithms results, this fol-
lows our hypothesis that deep learning models per-
form better with larger datasets. Unlike statistical al-
gorithms that uses mean, variance or percentile, deep
learning models (SNN to be specific) learn from the
observed data until it is able to accurately classify
pairs of data either belonging to the same or different
subjects. This makes the deep learning model favors
high volume of data (especially with more subjects)
instead of small volume of data with higher number
of shared graphs. During training, there are more im-
postor samples in the “different content” case (32 ∗K
impostor samples per subject, where K is the number
of samples from each of the other subjects, and ranges
from 10 to 15) than the “same content” (impostor
samples ranges from 2 to 10 per subject), which in-
creases the number of triplets that can be generated
during training and improves performance.
5.5 Comparing Statistical and Deep
Learning Algorithms
The overall aim of this work is to compare the perfor-
mance of these two authentication approaches, their
respective strengths and when each is preferred. As
shown in Table 2 and Table 4, the statistical algo-
rithms perform poorly on high volume of data and
subjects as in the Aalto Desktop and Mobile datasets.
We believe that this could be attributed to the rela-
tively small amount of data used for enrollment per
subject in these datasets, and on the other hand, that
the strength of deep learning models is in the vol-
ume of data available for training (especially the large
number of subjects in this case).
However, collecting a high-volume of labelled
data with many subjects can be a challenge. Un-
til such a large dataset is made available, statisti-
cal algorithms can still be considered as the best au-
thentication approach as shown in our results (Table
3 and Table 5). For the much smaller CU mobile
touch dataset, statistical algorithms significantly out-
perform the deep learning approach in both cases. In
the “same content” case, the simple statistical algo-
rithm ITAD produces 1.3% EER, whereas deep learn-
ing 19.18% EER. In the case of “different content”,
the statistical algorithm ITAD produces 4.08% EER
while deep learning 14.83% EER. We believe that this
difference in performance is due to the “knowledge”
embedded in the statistical algorithms that the deep
learning fails to learn due to lack of sufficient data.
6 CONCLUSION AND FUTURE
WORK
Using keystroke dynamics as a case study, we have
explored the strengths of statistical algorithms and
When Simple Statistical Algorithms Outperform Deep Learning: A Case of Keystroke Dynamics
369

deep learning approaches, and demonstrated that al-
though deep learning can produce superior perfor-
mance when provided with a large volume of data,
statistical algorithms such as ITAD can perform much
better and thus be preferred for small datasets. We ac-
curately replicated TypeNet on the Aalto desktop and
mobile datasets, achieving 0.93% and 6.77% EERs
respectively. Applying statistical algorithms on the
same datasets, we achieved EERs of 12.25% and
20.74% respectively. However, on a much smaller
dataset (the CU mobile), statistical algorithms sig-
nificantly outperform deep learning (4.3% and 1.3%
EERs for Scaled Manhattan and ITAD vs 19.18%
EER for TypeNet). Hence, when working with small
datasets, statistical algorithms remain the state-of-the-
art. Furthermore, the deep learning approach is still a
grey box and additional work is required to further ex-
plain its inner working (i.e., explainable AI), whereas
the statistical algorithms are clear and easy to under-
stand as they are based on statistical concepts, such as
mean, variance, and percentile.
Future work will be directed at quantifying the
size of a small dataset that should not be considered
for deep learning approach. We will also apply both
approaches on other public datasets, e.g., (Murphy
et al., 2017), (Sun et al., 2016). To further improve
performance, we will train the deep learning approach
with “semi-hard triplets” and “hard triplets” (Schroff
et al., 2015), and implement a weighted score fusion
for the ITAD metric. In addition to dataset sizes,
the nature/settings under which the datasets were col-
lected (e.g., typing behavior and/or content typed) can
also have an impact on performance. We plan to fur-
ther study these in future.
ACKNOWLEDGEMENTS
This work was supported by US NSF award TI-
2122746.
REFERENCES
Acien, A., Morales, A., Monaco, J. V., Vera-Rodriguez,
R., and Fierrez, J. (2021). TypeNet: Deep learning
keystroke biometrics. IEEE Transactions on Biomet-
rics, Behavior, and Identity Science.
Ayotte, B., Banavar, M., Hou, D., and Schuckers, S.
(2020). Fast free-text authentication via instance-
based keystroke dynamics. IEEE Transactions on
Biometrics, Behavior, and Identity Science, 2(4):377–
387.
Black, P. E. (2019). Manhattan distance. Available online
at: https://www.nist.gov/dads/HTML/ manhattanDis-
tance.html. Last Accessed: 2019-06-15.
Bromley, J., Guyon, I., LeCun, Y., S
¨
ackinger, E., and Shah,
R. (1993). Signature verification using a” siamese”
time delay neural network. Advances in neural infor-
mation processing systems, 6.
Deng, Y. and Zhong, Y. (2013). Keystroke dynamics user
authentication based on gaussian mixture model and
deep belief nets. International Scholarly Research No-
tices, 2013.
Dhakal, V., Feit, A. M., Kristensson, P. O., and Oulasvirta,
A. (2018). Observations on typing from 136 million
keystrokes. In Proceedings of the 2018 CHI Confer-
ence on Human Factors in Computing Systems, pages
1–12.
Gunetti, D. and Picardi, C. (2005). Keystroke analysis of
free text. ACM Transactions on Information and Sys-
tem Security (TISSEC), 8(3):312–347.
Killourhy, K. S. and Maxion, R. A. (2009). Comparing
anomaly-detection algorithms for keystroke dynam-
ics. In 2009 IEEE/IFIP International Conference
on Dependable Systems & Networks, pages 125–134.
IEEE.
Maheshwary, S., Ganguly, S., and Pudi, V. (2017). Deep
secure: A fast and simple neural network based ap-
proach for user authentication and identification via
keystroke dynamics. In IWAISe: First International
Workshop on Artificial Intelligence in Security, vol-
ume 59.
Murphy, C., Huang, J., Hou, D., and Schuckers, S. (2017).
Shared dataset on natural human-computer interaction
to support continuous authentication research. In 2017
IEEE International Joint Conference on Biometrics
(IJCB), pages 525–530. IEEE.
Palin, K., Feit, A. M., Kim, S., Kristensson, P. O., and
Oulasvirta, A. (2019). How do people type on mobile
devices? observations from a study with 37,000 vol-
unteers. In Proceedings of the 21st International Con-
ference on Human-Computer Interaction with Mobile
Devices and Services, pages 1–12.
Schroff, F., Kalenichenko, D., and Philbin, J. (2015).
Facenet: A unified embedding for face recognition
and clustering. In Proceedings of the IEEE conference
on computer vision and pattern recognition, pages
815–823.
Sun, Y., Ceker, H., and Upadhyaya, S. (2016). Shared
keystroke dataset for continuous authentication. In
2016 IEEE International Workshop on Information
Forensics and Security (WIFS), pages 1–6. IEEE.
Teh, P. S., Teoh, A. B. J., and Yue, S. (2013). A survey of
keystroke dynamics biometrics. The Scientific World
Journal, 2013.
Wahab, A. A., Hou, D., Schuckers, S., and Barbir, A.
(2021). Utilizing keystroke dynamics as additional
security measure to protect account recovery mech-
anism. In ICISSP, pages 33–42.
Zhong, Y., Deng, Y., and Jain, A. K. (2012). Keystroke
dynamics for user authentication. In 2012 IEEE com-
puter society conference on computer vision and pat-
tern recognition workshops, pages 117–123. IEEE.
ICPRAM 2023 - 12th International Conference on Pattern Recognition Applications and Methods
370
