
Fast and Reliable Template Matching Based on Effective Pixel Selection
Using Color and Intensity Information
Rina Tagami, Hiroki Kobayashi, Shuichi Akizuki and Manabu Hashimoto
Graduate School of Engineering, Chukyo University, Nagoya, Japan
Keywords:
Template Matching, Pixel Selection, Hue Value, Genetic Algorithm, Object Detection.
Abstract:
We propose a fast and reliable method for object detection using color and intensity information. The prob-
ability of hue and pixel values (gray level intensity values) in two-pixel pairs occurring in a template image
is calculated, and only those pixel pairs with extremely low probability are carefully selected for matching.
Since these pixels are highly distinctive, reliable matching is not affected by surrounding disturbances, and
since only a very small number of pixels is used, the matching speed is high. Moreover, the use of the two
measures enables reliable matching regardless of an object’s color. In a real image experiment, we achieved a
recognition rate of 98% and a processing time of 80 msec using only 5% (684 pixels) of the template image.
When only 0.5% (68 pixels) of the template image was used, the recognition rate was 80% and the processing
time was 5.9 msec.
1 INTRODUCTION
In recent years, image processing technology and
robot vision systems have become increasingly pop-
ular in various fields in Japan against the backdrop
of a shrinking production workforce and unmanned
production sites due to the effects of the COVID-19
pandemic. However, there are strong constraints on
the computing resources available on real production
lines, and if the method is not understandable to the
user, it is difficult to use. Therefore, keypoint match-
ing (KPM) and template matching (TM), which com-
bine simplicity, practicality, and versatility, are fre-
quently used.
The SIFT(Lowe, 1999) method is one of the well-
known methods for KPM, and its high cost for gener-
ating DoG (Difference-of-Gaussian) images and cal-
culating gradient information has led to improve-
ments for higher speed and accuracy, and various
methods have been proposed. AKAZE(Alcantarilla
and Solutions, 2011) is one of these methods. It is
often used because it is rotation-invariant, robust to
scaling, and fast due to the application of a nonlinear
diffusion filter. However, since features are extracted
each time an image is input, although it is fast, it takes
a certain amount of processing time.
In TM, which is a more basic algorithm than
KPM, typical matching methods include SAD (Sum
of Absolute Differences), SSD (Sum of Squared
Differences), and NCC (Normalized Cross-sectional
Correlation). However, since matching is performed
using all the pixels in the template image, the process
is time-consuming and sensitive to small changes in
illumination and deformation. Therefore, methods to
reduce the number of pixels used, to narrow down the
number of search candidates, or to convert pixels to
features before matching are considered.
In previous research, there is a method(Dubuisson
and Jain, 1994) that uses only edge pixels and calcu-
lates similarity based on the basis of Hausdorff dis-
tance. There is also a method for detecting edges that
change little over time(Xiao and Wei, 2014), and a
method that learns the edges and corners of an object
and uses a segmented set of edges for flexible match-
ing(Yu et al., 2017). Methods(Dubuisson and Jain,
1994)(Xiao and Wei, 2014)(Yu et al., 2017) are fast
because they are edge matching, and methods(Xiao
and Wei, 2014)(Yu et al., 2017) are robust to deforma-
tion and cluttered backgrounds, but can only be used
when the object has sufficient edge information that
can be extracted.
In addition to methods that use edge information,
there is a method called BBS(Dekel et al., 2015) that
measures the similarity of two sets of points by map-
ping the pixel values of a template image and an input
image, and a method called DDIS(Talmi et al., 2017)
that is faster than this method. BBS and DDIS are
based on nearest neighbor search, and there is another
method(Korman et al., 2018) that reduces the number
of nearest neighbor searches and improves robustness
Tagami, R., Kobayashi, H., Akizuki, S. and Hashimoto, M.
Fast and Reliable Template Matching Based on Effective Pixel Selection Using Color and Intensity Information.
DOI: 10.5220/0011683600003417
In Proceedings of the 18th International Joint Conference on Computer Vision, Imaging and Computer Graphics Theory and Applications (VISIGRAPP 2023) - Volume 5: VISAPP, pages
607-614
ISBN: 978-989-758-634-7; ISSN: 2184-4321
Copyright
c
2023 by SCITEPRESS – Science and Technology Publications, Lda. Under CC license (CC BY-NC-ND 4.0)
607
against shielding by using a hashing scheme based on
consensus set maximization. However, practical ap-
plication of this method is difficult because it is not
fast enough to enable real-time processing (less than
100 msec).
There is also a method that strategically reduces
the number of pixels used to achieve high speed. A
method(Korman et al., 2013) uses only pixels that de-
pend on the smoothness of the image, enabling fast
matching that is not affected by the size of the tem-
plate image. A method(Hashimoto et al., 2010) called
CPTM (Co-occurrence of Multiple Pixels in Template
Matching) expresses the frequency of pixel value
(gray level intensity value) pairs occurring as a co-
occurrence histogram and uses only pixels with low
frequency to achieve both high speed and high relia-
bility. A method(Tagami et al., 2022) called CoP-TM
(Color Co-occurrence of Multiple Pixels in Template
Matching), which extends CPTM to color informa-
tion, enables fast and reliable matching for color im-
ages. The practical use of co-occurrence histograms
is attracting attention, such as in the use of this co-
occurrence in similarity calculations(Kat et al., 2018)
and as a filter in CNN(Shevlev and Avidan, 2019).
However, method(Korman et al., 2013) is not very
versatile because of its unreliability in matching high-
frequency images, method(Hashimoto et al., 2010) in
color images, and method(Tagami et al., 2022)(Kat
et al., 2018) in grayscale images. Therefore, we pro-
pose a new method that is fast, reliable, and versatile,
with matching accuracy that does not deteriorate de-
pending on the image used.
Specifically, we merge the ideas of CPTM and
CoP-TM and calculate the probability of occurrence
on the basis of two measures: gray-scale information
(pixel value) and color information (hue value), We
then use only pixels with low probability for match-
ing. The speedup is proportional to the pixel reduc-
tion rate, and the use of pixels with low probabil-
ity of occurrence enables reliable matching because
pixels are not used that are invalid for matching due
to their high frequency of occurrence, such as back-
ground pixels. The advantages of this method are that
it does not require the use of a high-end computer, as
is the case with learning-based methods, and that it
has a short online processing time.
2 CONVENTIONAL METHOD
In this section, we provide an overview of pixel-
selective TM and explain the pixel selection methods
of the CPTM and CoP-TM methods, which are the
basis of the proposed method.
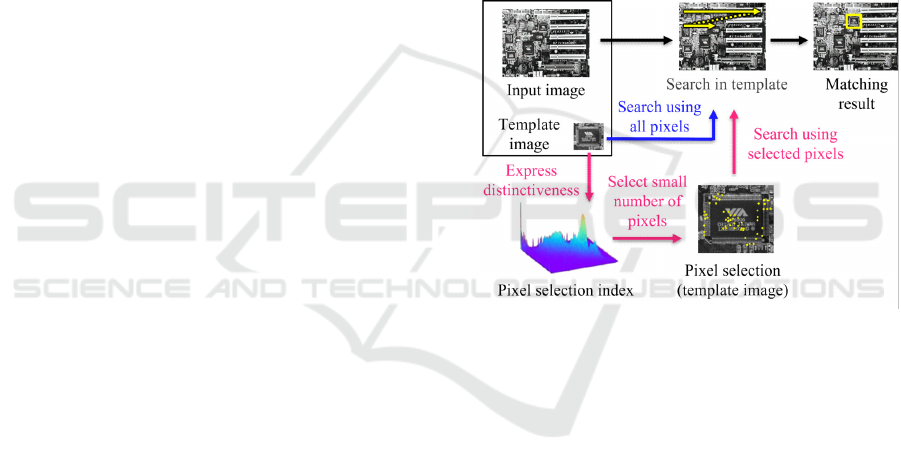
2.1 Overview of Pixel-Selective TM
Method
First, in general TM, the template image containing
the object to be found is successively matched with
the input image by moving the template image onto
the input image to determine the best similarity posi-
tion, as shown in the upper row of Figure 1. In general
methods, all pixels in the template image are used for
matching with the input image. In contrast, the pixel-
selection TM method, as shown in the lower part of
Figure 1, expresses the distinctiveness of each pixel
in the template image as a map representing the fre-
quency of occurrence. Using this map as an index for
pixel selection, only a small number of highly distinc-
tive pixels are pre-selected from the template image
and used for matching with the input image.
Figure 1: Process of selecting pixels.
2.2 CPTM Method (Based on Pixel
Values)
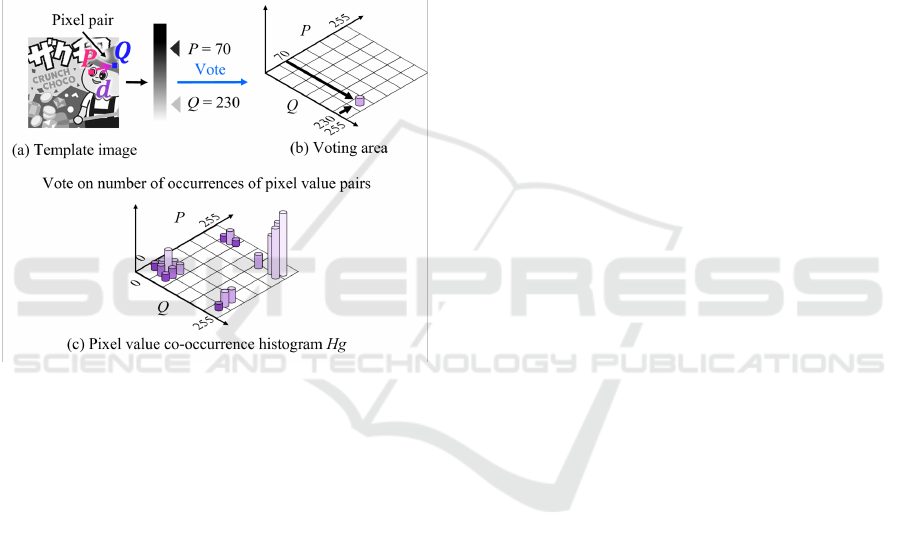
The CPTM method uses a co-occurrence histogram
as a measure of the distinctiveness of pixel pairs. In
this study, we consider only two-point co-occurrences
(pixel pairs) consisting of two pixels (starting pixel P
and ending pixel Q) in a template image. First, the
pixel pairs are fitted to all locations in the template
image as shown in Figure 2 (a), and the number of
occurrences is voted into the two-dimensional matrix
shown in Figure 2 (b), indexed by pixel values p and
q (usually 0 to 255) of P and Q, respectively. In the
case of Figure 2, the pixel value p of the starting pixel
is 70, and the pixel value q of the ending pixel is 230,
which means that a pair is voted on at the coordinate
position (70, 230) in the two-dimensional matrix (Fig-
ure 2 (b)). After all pixel pairs have been voted on, the
pixel value co-occurrence histogram H
g
is completed
as shown in Figure 2 (c). There are multiple pixel
VISAPP 2023 - 18th International Conference on Computer Vision Theory and Applications
608
distance patterns in the pixel arrangement (displace-
ment vector d) of the starting pixel P and the ending
pixel Q. It can be assumed that multiple pixel value
co-occurrence histograms are generated according to
the pixel distance pattern. H
g
(p, q) corresponds to the
frequency distribution of the occurrence of pixel pairs
with starting pixel value p and ending pixel value q
in the template image, and can be treated as a prob-
ability distribution. In other words, it can be judged
that pixel pairs with large distributions are common,
while those with small distributions are highly dis-
tinctive, i.e., distinctive pixel pairs. By selecting only
such pixels and using them when searching in the in-
put image, fast and reliable matching is possible.
Figure 2: Pixel value co-occurrence histogram H
g
.
2.3 CoP-TM Method (Based on Hue
Values)
While the CPTM method introduced in 2.2 used two
pixel values (usually 0-255) as an index to generate
a hue value co-occurrence histogram, the CoP-TM
method uses hue values, which can represent colors
in a single channel, to reduce processing time, and it
generates a hue value co-occurrence histogram H
c
.
To use hue values in the CoP-TM method, the
template RGB image shown in Figure 3 (a) is HSV
converted, and 360 hue values from 0 to 359 are used.
In the case of Figure 3, the starting pixel P is con-
verted to a hue value of 50 because it is yellow, and
the ending pixel Q is converted to a hue value of 320
because it is pink. However, even in the case of a
color image, there are a few pixels that are not reli-
able as color information or cannot be converted to a
hue value, so these pixels are assigned a hypothetical
hue value of 360.
In other words, in terms of data processing, hue
values are expressed in 361 steps from 0 to 360 (when
the quantization number k is 360). In this section,
the distance between pixel pairs, which was omitted
in 2.2, is explained in detail. First, let v
P
= (x
P
, y
P
)
and v
Q
= (x
Q
, y
Q
) be the position vectors of P and Q,
respectively, and d = (k, l) be the displacement vec-
tor of Q from P. Then, the hue value co-occurrence
histogram H
c
(p, q) of a pixel pair consisting of these
two pixels is defined by equations (1), (2), and (3).
The displacement vector d is a vector from the start-
ing pixel P to the ending pixel Q;thus, x
Q
= x
P
+ k and
y
Q
= y
P
+ l. The displacement vector d can have mul-
tiple patterns, and many positional relationships can
be expressed by setting various d. However, due to
processing time and memory requirements, the CoP-
TM method and the CPTM method are limited to two
directions only, horizontal and vertical. The determi-
nation of the distance between two pixels corresponds
to expressing the spatial frequency without changing
the resolution of the image, and we consider five types
of parameters: 1, 2, 4, 8 and 16. That is, d = (+1, 0),
(+2, 0), (+4, 0), (+8, 0), (+16, 0), (0, +1), (0, +2), (0,
+4), (0, +8), (0, +16) for a total of 10 pixel distance
patterns.
H
c
(p, q) =
∑
v
P
,v
Q
∑
∈R
2
δ(v
P
, v
Q
, p, q) (1)
δ =
1 i f { f (v
P
) = p} ∧ { f (v
Q
) = q}
0 otherwise
(2)
where, v
Q
= v
P
+ d (3)
The hue values p and q (usually 0 to 359) of P and
Q, respectively, are used as the vertical and horizon-
tal indices, and the number of occurrences is voted on
for one pair in the two-dimensional matrix shown in
Figure 3 (b). In the example shown in Figure 3 (b),
the starting pixel has a hue value p of 50, and the end-
ing pixel has a hue value q of 320, which means that
the pixel is voted on at the coordinate position (50,
320) in the two-dimensional matrix. After all pixel
pairs have been voted on, a hue value co-occurrence
histogram H
c
is completed, as shown in Figure 3 (c).
The values of H
c
are normalized so that the sum of H
c
equals 1, and the co-occurrence probability P
c
(p, q) is
defined.
3 PROPOSED METHOD
This section describes the proposed method. Basi-
cally, it is an extension of the CPTM and CoP-TM
methods described in the previous section.
Fast and Reliable Template Matching Based on Effective Pixel Selection Using Color and Intensity Information
609
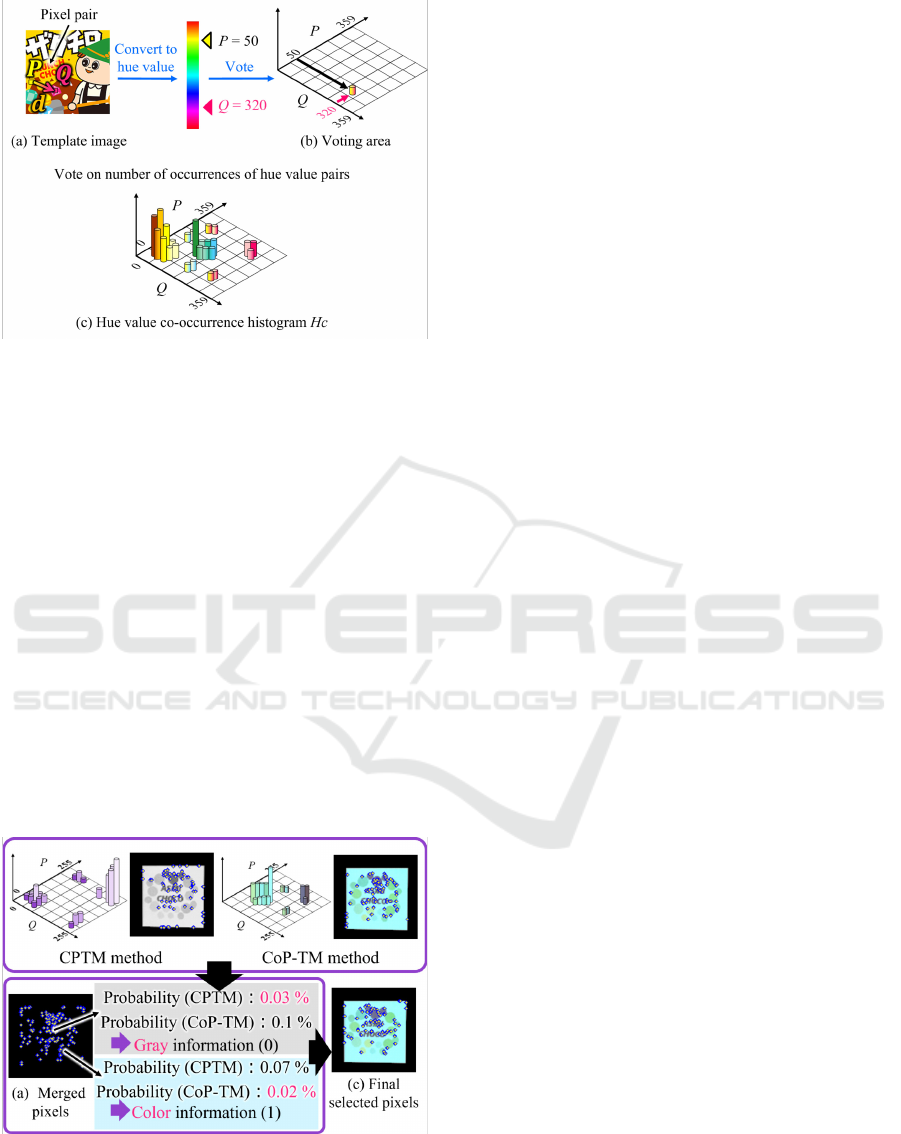
Figure 3: Hue value co-occurrence histogram H
c
.
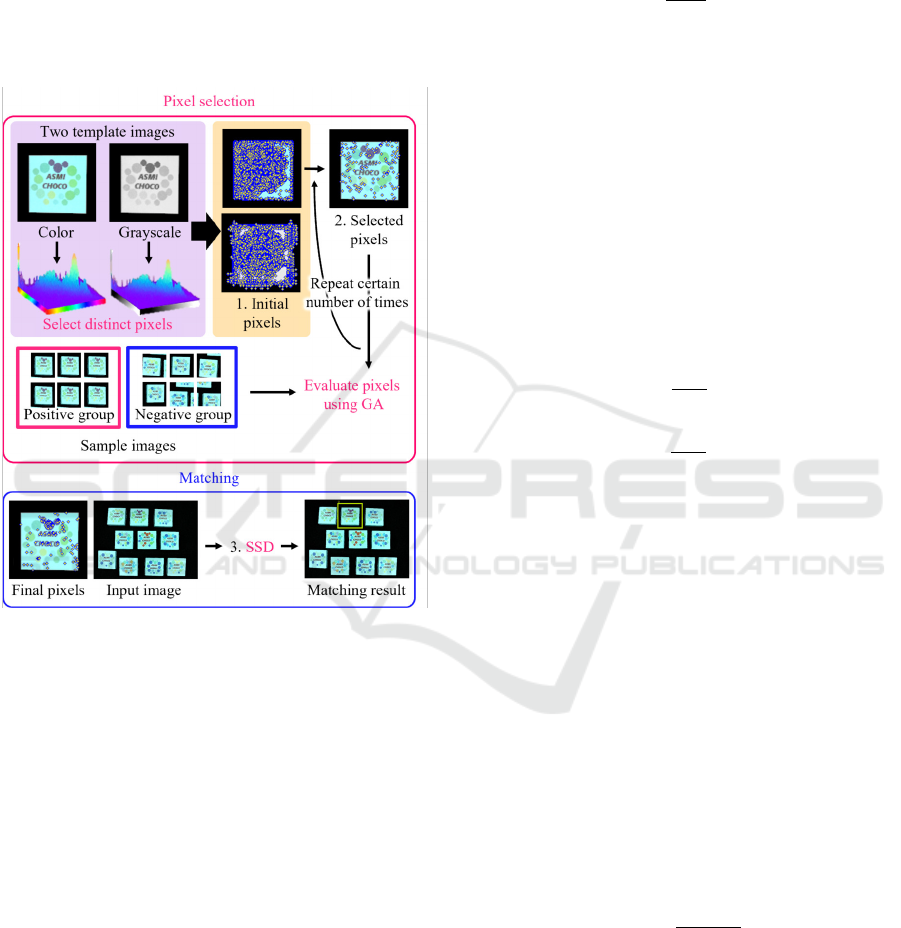
3.1 Pixel Selection
In this section, the pixel selection technique of the
proposed method is explained using Figure 4. First,
as shown in the upper part of Figure 4, an arbitrary
number of pixels is selected using the CPTM and
CoP-TM methods. Next, the pixels selected by the
two methods are mapped as coordinate information
as shown in Figure 4 (a), and the co-occurrence prob-
ability of the CPTM method or that of the CoP-TM
method is compared for each pixel. The information
of the method with the lower co-occurrence probabil-
ity is labeled for the coordinates, and this process is
repeated for an arbitrary number of pixels. In other
words, if the CPTM method has a lower probability
value, it is labeled 0, and if the CoP-TM method has a
lower probability value, it is labeled 1, which is used
in the matching described in 3.2. The final result of
pixel selection is shown in Figure 4 (c).
Figure 4: Overview of pixel selection for proposed method.
3.2 Matching Method
Since hue and pixel values are used for pixel selection
in the proposed method, they are also used for match-
ing. First, the RGB values of the input image are con-
verted to pixel values and hue and pixel values quan-
tized to 255 steps. Discrete pixels f (n) selected using
the co-occurrence probability are stored in a 1D array
as f
G
(n) or f
H
(n), depending on the label f
R
(n) in 3.1,
either pixel value or hue value. The i-coordinate and j-
coordinate of the selected pixel are also stored as f
i
(n)
and f
j
(n) in a one-dimensional array. The S
SSD
is cal-
culated by the sum of the squares of the differences
between the pixels of the template image displaced
by (δ
x
, δ
y
) from the input image and superimposed
on it, using Equations (4) and (5). The value of the
input image is g(i, j), and it switches between pixel
value and hue value depending on the label f
R
(n) of
the template image. The number of reference pixels
is M. The SSDA method (Sequential Similarity De-
tection Algorithm), which uses SSD (Sum of Abso-
lute Difference) as an index, speeds up the similarity
calculation. The best match position is determined
where the calculation results are lowest, i.e., where
the similarity is highest. The differences are deter-
mined so as not to cause problems with the circular
model of hue values.
S
SSD
=
M−1
∑
n=0
(g( f
i
(n) + δ
x
, f
j
(n) + δ
y
) − f (n))
2
(4)
f (n) =
f
G
(n) i f f
R
(n) = 0
f
H
(n) i f f
R
(n) = 1
(5)
3.3 Robust Pixel Selection for Similar
Objects
In this section, we expand on the proposed method
and explain how to minimize misrecognition even
when there are many similar objects around the ob-
ject.
3.3.1 Basic Idea
Figure 5 shows the flow of this study, which consists
of three steps from 1. to 3. 1. First, from the tem-
plate image, the probability of pixel values and hue
values in two-pixel pairs occurring is calculated using
the CPTM method described in 2.2 and the CoP-TM
method described in 2.3, respectively, and the pixel
with the lowest probability is selected and used as ini-
tial pixels. This is expected to reduce mismatches to
a certain degree. 2. Next, the discriminative perfor-
mance of the pixels selected from two sample images
VISAPP 2023 - 18th International Conference on Computer Vision Theory and Applications
610
prepared in advance is evaluated: the target object im-
ages (positive sample) and the similar object images
(negative sample). While evaluating the performance
using Genetic Algorithms (GA), the pixels selected
in 1. are further carefully selected, and the pixels
with the maximum performance are used as the fi-
nal pixels. 3. Finally, similarity is calculated using
the matching method described in 3.2, on the basis of
pixels selected in 2. and the input images.
Figure 5: Proposed method robust to similar objects.
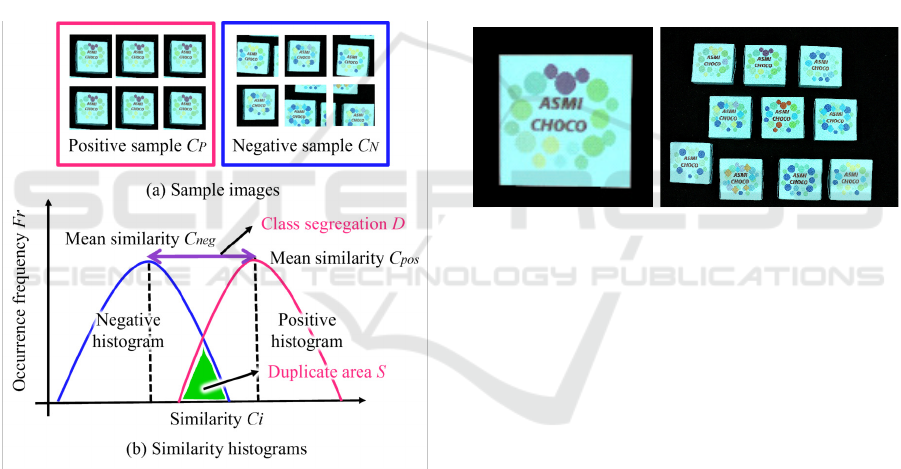
3.3.2 Evaluation of Pixel Discrimination
Performance
In this study, the discriminative performance of pix-
els selected from the template image is evaluated us-
ing two pre-prepared image groups, as shown in Fig-
ure 6 (a). The right image in Figure 6 (a) shows im-
ages from which similar object regions are randomly
cut out from input images that are assumed to have
many similar objects including the target object (neg-
ative sample C
N
), and the left image in Figure 6 (a)
shows images from which target object regions are
cut out (positive sample C
P
). Specifically, one nega-
tive image and one positive image are cropped from a
single image. If 200 sample images are prepared for
each sample image, no two images will be exactly the
same because they are cropped from 200 original im-
ages. Figure 6 (b) shows an example of the distribu-
tion when the similarity C
i
between the selected pixels
by 2. in 3.3.1 and these sample images is calculated
and converted into the histogram. Using the two eval-
uation indices D and S calculated from the histogram,
the discrimination performance of the selected pixels
is evaluated using Equation (6).
F = w
1
1
S + ε
+ w
2
D (6)
The larger the evaluation value F, the higher the
discrimination performance, and the smaller the value
of D and the larger the value of S, the better. Note
that w
1
and w
2
are weight coefficients, and ε is a sup-
plementary coefficient. The two evaluation indices
are described in detail below. The first is the degree
of class separation D. The class separation D of this
method is defined as the difference between the mean
values of the positive and negative similarity distri-
butions. The purple line in Figure 6 (b) is the class
separation, and the average similarity C
pos
of the N
pos
positive samples and the average similarity C
neg
of the
N
neg
negative samples are calculated using Equations
(7) and (8).
C
pos
=
1
N
pos
∑
i∈C
P
C
i
(7)
C
neg
=
1
N
neg
∑
i∈C
N
C
i
(8)
From the difference between C
pos
and C
neg
, the
class separation D is calculated using Equation (9).
D = C
pos
−C
neg
(9)
The larger D is, the further apart the distributions
of the two sample groups are, and thus, the more sta-
ble the discrimination by the thresholding process is
expected to be. The second is the duplicate area S,
which is the duplicate area between the histograms
of the two sample groups. The green area in Figure
6 (b) corresponds to the duplicate area, and the exis-
tence of this duplicate area indicates the misrecogni-
tion rate P
E
. The misrecognition rate is the probability
of misidentifying a similar object as a target object or
a target object as a similar object. The misrecognition
rate P
E
of the positive sample group C
P
and the nega-
tive sample group C
N
is defined by Equation (10).
P
E
=
C
P
∧C
N
C
P
∨C
N
(10)
C
P
∧C
N
means the area S of the overlap between
the positive and negative sample groups. C
P
∨C
N
means the total area of both classes minus the over-
lapped area. The pixels that minimize the misrecog-
nition rate P
E
are equivalent to the pixels that mini-
mize S. The smaller this value is, the smaller the risk
of misrecognition is considered to be. The area S of
Fast and Reliable Template Matching Based on Effective Pixel Selection Using Color and Intensity Information
611
the overlapped area of both sample groups is calcu-
lated by Equations (11) and (12). The similarity C
i
between each sample image and the template image
is calculated, and the overlapped area S is calculated.
p
min
is the minimum similarity in the positive sample
group.
S =
∑
i∈C
N
S
i
(11)
S
i
=
1 i f C
i
> p
min
0 otherwise
(12)
From the above, the pixel with the largest value
of F in Equation (6) can be judged to be good. The
proposed method generates groups of pixels one after
another using GA and evaluates the goodness of the
pixels using the above approach. Finally, pixels with
a certain level of goodness from a practical standpoint
are determined as an approximate solution.
Figure 6: Evaluation of discrimination performance.
4 EXPERIMENTS
4.1 Experimental Conditions
Two types of experiments were done: the first was
an experiment to verify the pixels selected with the
proposed method, and the second was to compare the
performance of the proposed method with the base
CPTM and CoP-TM methods in order to demonstrate
the effectiveness of the proposed method. The ob-
jective was to show whether the proposed method
can achieve more accurate matching than the conven-
tional methods by using pixels selected by the pro-
posed method. If the matching result was within
±4 of GT, the recognition was considered success-
ful. As other comparison methods, we used the
Canny edge detection method(Canny, 1986), the in-
tensity gradient method, random matching, all-pixel
matching, AKAZE(Alcantarilla and Solutions, 2011),
YOLOv5(Jocher et al., 2020) and BBS(Dekel et al.,
2015). Figure 7 (a) shows the template image used
in the experiment. The size is 117 × 117 [pixel], and
the target object simulated a box of chocolate candy.
In the experiment, 0.1%, 0.2%, 0.5%, 1%, 2%, 4%,
and 5% of the 117 × 117 [pixel] were used as the
number of selected pixels. The input image size was
505 × 379 [pixel], and 100 patterns were prepared.
Figure 7 (b) shows an example of an input image used
in the experiment. 200 positive and 200 negative sam-
ples were used for each.
(a) Template image (b) Input image
Figure 7: Template image and input image.
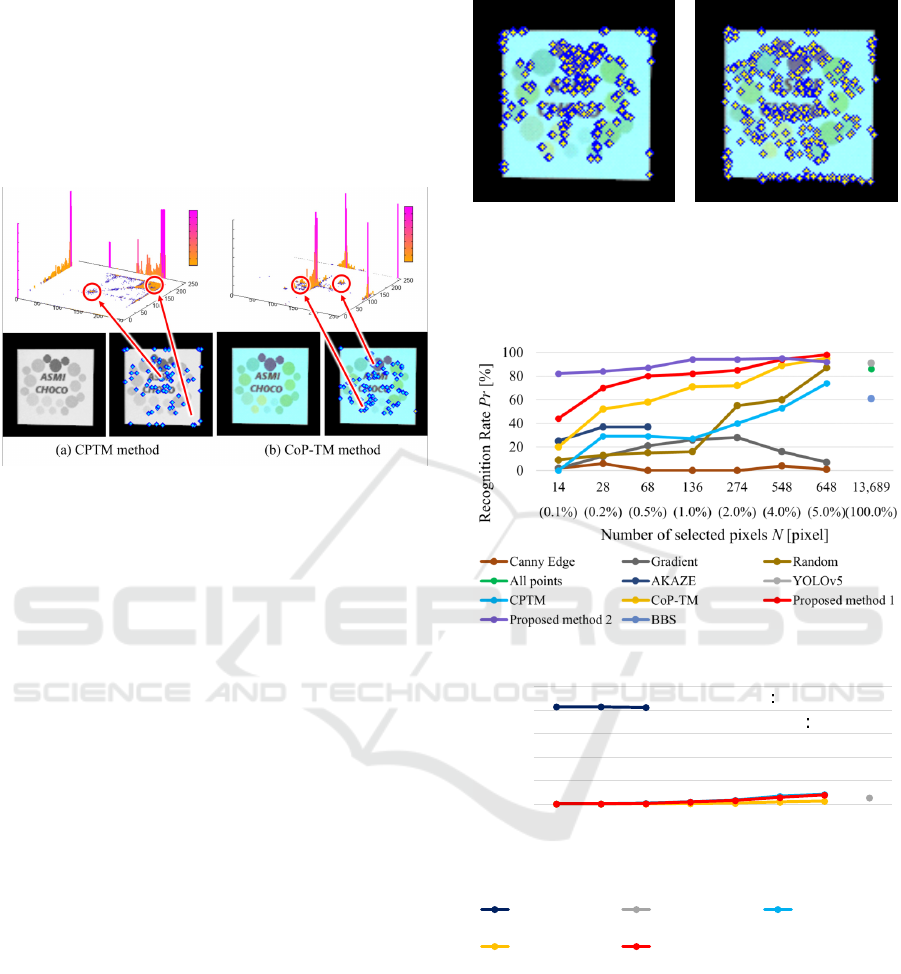
4.2 Result of Selected Pixels
In this section, we show the co-occurrence histograms
generated from the CPTM and CoP-TM methods,
which are the base methods of the proposed method,
and selected pixels (Figure 8). We confirmed that
the co-occurrence histograms were correctly gener-
ated from the information of the pixels in the tem-
plate image, and evaluated whether the selected pix-
els correspond to a distinctiveness distribution in the
co-occurrence histograms.
The upper row of Figure 8 (a) shows the
co-occurrence histogram generated by the CPTM
method, the left side of the lower row shows the tem-
plate image, and the right side shows the selected pix-
els. When the template image in Figure 7 (a) was
grayscaled, the difference in the intensity of the pat-
tern became less pronounced. Therefore, as shown
on the left side of the lower row of Figure 8 (a),
the only areas where the difference in intensity was
clear were the areas corresponding to the characters
and the purple pattern. The probability value of the
co-occurrence histogram was high because light gray
VISAPP 2023 - 18th International Conference on Computer Vision Theory and Applications
612
pixels (blue pixels in the color image) other than char-
acters occupy a large percentage of the template im-
age. The selected pixels were selected from the areas
corresponding to characters and edges, and as can be
seen from the co-occurrence histogram in the upper
row of Figure 8 (a), they have low probability values
and were confirmed to be pixels with high distinctive-
ness.
Figure 8: Co-occurrence histogram and selected pixels.
Figure 8 (b) upper row shows the co-occurrence
histogram generated by the CoP-TM method, the left
side of the lower row shows the template image, and
the right side of the lower row shows the selected
pixel pairs. The co-occurrence histogram in the up-
per row of Figure 8 (b) shows that the green and pur-
ple pixel pairs have a low probability value and low
frequency of occurrence, indicating their distinctive-
ness. Another feature of this method is that pixels are
not selected from the edges as often as the selected
pixel by the CPTM method.
Figure 9 shows pixels selected by the proposed
method. Proposed method 1 selected pixels using the
method described in 3.1, and proposed method 2 se-
lected pixels using the method described in 3.3.2. The
pixels selected by proposed method 1 in Figure 9 (a)
were selected in such a way that they covered both the
pixels selected by the CPTM and CoP-TM methods in
Figure 8. For example, edge pixels and purple pixels
selected by the CPTM method and green pixels se-
lected by the CoP-TM method fall into this category.
In addition, the pixels selected by proposed method 2
(Figure 9 (b)) were selected for being robust to simi-
lar objects, not only on the basis of the distinctiveness
of the template image.
4.3 Performance Evaluation
Figure 10 shows the recognition success rate for each
number of selected pixels for the proposed method
and the comparison method. Figure 11 shows the pro-
cessing time when a Ryzen 5 5600X was used as the
(a) Proposed
Method 1
(b) Proposed
Method 2
Figure 9: Pixels selected by proposed method.
CPU for each number of selected pixels.
Figure 10: Recognition rate of each method.
0
200
400
600
800
1000
14 28 68 136 274 548 648 13,689
(0.1%) (0.2%) (0.5%) (1.0%) (2.0%) (4.0%) (5.0%)(100.0%)
Processing time t [msec]
Number of selected pixels N [pixel]
AKAZE YOLOv5 CPTM
CoP-TM Proposed method
BBS 730 sec
All points
1.9 sec
Figure 11: Processing time of each method.
The processing times for the Canny edge detec-
tion method, the intensity gradient method, and ran-
dom matching were omitted because the CoP-TM
method was used as the matching index. Since the
number of keypoints in AKAZE and the number of
pixels that can be judged as edges in the Canny
edge detection method are limited, the recognition
results are shown within the possible range. Pro-
posed method 1 achieved a higher recognition rate
than the compared methods for all conditions of the
Fast and Reliable Template Matching Based on Effective Pixel Selection Using Color and Intensity Information
613

number of selected pixels. Figure 11 shows that pro-
posed method 1 achieved reliable matching in almost
the same processing time as the CPTM and CoP-
TM methods. Figure 10 and 11 show that proposed
method 1 achieves the same performance as YOLOv5
despite its short off-line processing time (3 [sec]),
with a processing time of 58 [msec] and a recognition
success rate of 94%, while YOLOv5, a comparative
learning-based method, had a processing time of 55
[msec] and a recognition success rate of 91%. The re-
sults of proposed method 2, shown in Figure 10, con-
firm that preferentially selecting pixels that are robust
to similar objects is effective in improving the recog-
nition rate.
5 CONCLUSIONS
In this study, we proposed fast image matching
method that uses only effective pixels for matching on
the basis of two measures from color and grayscale
images. Experiments using 100 real images showed
that when approximately 0.5% (68 pixels) of the
117 × 117 template image was used, the recognition
success rate was 80% and the processing time was 5.9
msec. When 5.0% (648 pixels) was used, the success
rate was 98% and the processing time was 80 msec,
confirming that both high speed and high reliability
are possible. The recognition rate of proposed method
decreases in the presence of disturbances such as ro-
tation, illumination change, and shading. We would
like to improve the method by adding images that in-
clude highlights and illumination changes to the pos-
itive samples and by improving the pixel selection al-
gorithm. In addition, since we used our own datasets
for this experiment, we would like to experiment with
public datasets(Wu et al., 2013) in the future.
REFERENCES
Alcantarilla, P. F. and Solutions, T. (2011). Fast ex-
plicit diffusion for accelerated features in nonlinear
scale spaces. IEEE Trans. Patt. Anal. Mach. Intell,
34(7):1281–1298.
Canny, J. (1986). A computational approach to edge de-
tection. IEEE Transactions on pattern analysis and
machine intelligence, (6):679–698.
Dekel, T., Oron, S., Rubinstein, M., Avidan, S., and Free-
man, W. T. (2015). Best-buddies similarity for robust
template matching. In Proceedings of the IEEE con-
ference on computer vision and pattern recognition,
pages 2021–2029.
Dubuisson, M.-P. and Jain, A. K. (1994). A modified haus-
dorff distance for object matching. In Proceedings of
12th international conference on pattern recognition,
volume 1, pages 566–568. IEEE.
Hashimoto, M., Fujiwara, T., Koshimizu, H., Okuda, H.,
and Sumi, K. (2010). Extraction of unique pix-
els based on co-occurrence probability for high-speed
template matching. In 2010 International Symposium
on Optomechatronic Technologies, pages 1–6. IEEE.
Jocher, G., Nishimura, K., Mineeva, T., and Vilari
˜
no, R.
(2020). yolov5. Code repository.
Kat, R., Jevnisek, R., and Avidan, S. (2018). Matching pix-
els using co-occurrence statistics. In Proceedings of
the IEEE Conference on Computer Vision and Pattern
Recognition, pages 1751–1759.
Korman, S., Milam, M., and Soatto, S. (2018). Oatm:
Occlusion aware template matching by consensus set
maximization. In Proceedings of the IEEE Conference
on Computer Vision and Pattern Recognition, pages
2675–2683.
Korman, S., Reichman, D., Tsur, G., and Avidan, S. (2013).
Fast-match: Fast affine template matching. In Pro-
ceedings of the IEEE Conference on Computer Vision
and Pattern Recognition, pages 2331–2338.
Lowe, D. G. (1999). Object recognition from local scale-
invariant features. In Proceedings of the seventh
IEEE international conference on computer vision,
volume 2, pages 1150–1157. Ieee.
Shevlev, I. and Avidan, S. (2019). Co-occurrence neural
network. In Proceedings of the IEEE/CVF Conference
on Computer Vision and Pattern Recognition, pages
4797–4804.
Tagami, R., Eba, S., Nakabayashi, N., Akizuki, S., and
Hashimoto, M. (2022). Template matching using a
small number of pixels selected by distinctiveness of
quantized hue values. In International Workshop on
Advanced Imaging Technology (IWAIT) 2022, volume
12177, pages 662–667. SPIE.
Talmi, I., Mechrez, R., and Zelnik-Manor, L. (2017). Tem-
plate matching with deformable diversity similarity. In
Proceedings of the IEEE Conference on Computer Vi-
sion and Pattern Recognition, pages 175–183.
Wu, Y., Lim, J., and Yang, M.-H. (2013). Online object
tracking: A benchmark. In Proceedings of the IEEE
Conference on Computer Vision and Pattern Recogni-
tion (CVPR).
Xiao, J. and Wei, H. (2014). Scale-invariant contour seg-
ment context in object detection. Image and Vision
Computing, 32(12):1055–1066.
Yu, Q., Wei, H., and Yang, C. (2017). Local part chamfer
matching for shape-based object detection. Pattern
Recognition, 65:82–96.
VISAPP 2023 - 18th International Conference on Computer Vision Theory and Applications
614
