
Facial Paralysis Recognition Using Face Mesh-Based Learning
Zeerak Mohammad Baig and Dustin van der Haar
a
Academy of Computer Science and Software Engineering, University of Johannesburg,
Kingsway Avenue and University Rd, Auckland Park, South Africa
Keywords:
Facial Paralysis, Machine Learning, Support Vector Machine, XGBoost, K Nearest Neighbour, CNN,
MobileNetV2, Face Mesh.
Abstract:
Facial paralysis is a medical disorder caused by a compressed or enlarged seventh cranial nerve. The facial
muscles become weak or paralysed because of the compression. Many medical experts believe that viral
infection is the most common cause of facial paralysis; however, the origin of nerve injury is unknown. Facial
paralysis hampers a patient’s ability to blink, swallow, or communicate. This article proposes deep learning-
based and traditional machine learning-based approaches for facial paralysis recognition in facial images,
which can aid in developing standardised medical evaluation tools. The proposed method first detects faces or
faces in each image, then extracts a face mesh from the given image using Google’s Mediapipe. The face mesh
descriptors are then transformed into a novel face mesh image, fed into the final component, comprised of a
convolutional neural network (CNN) to perform overall predictions. The study uses YouTube facial paralysis
datasets (Youtube and Stroke face) and control datasets (CK+ and TUFTS face) to train and test the model
for unhealthy patients. The best approach achieved an accuracy of 98.93% with a MobilenetV2 backbone
using the YouTube facial paralysis dataset and the Stroke face dataset for palsy images, thereby showing mesh
learning can be accomplished using a CNN.
1 INTRODUCTION
Facial paralysis or facial palsy is a condition whereby
one cannot move the facial muscles of the face on one
or both sides. This medical condition can result from
nerve damage due to diseases such as brain tumours
or Stroke and trauma (Parra-Dominguez et al., 2021).
Suppose the early detection of facial palsy and treat-
ment is delayed. In that case, it can result in many
complications, which include damage to the seventh
cranial nerve and excessive dryness in the eye, which
may lead to eye infections, ulcers and even loss of
vision. Furthermore, one may develop synkinesis,
a condition in which a movement of one face part
causes an unintentional movement of another face
part (Tiemstra and Khatkhate, 2007).
Facial paralysis is a well-known medical condi-
tion that needs to be detected and treated early. De-
veloping methods that can assist doctors in detecting
facial palsy earlier can add a fair amount of value to
the detection and treatment. These methods can also
serve as the basis for forming standardised tools for
medical assessments, treatment, and monitoring.
Our contributions presented in the study includes
a
https://orcid.org/0000-0002-5632-1220
face mesh-based learning for facial paralysis recogni-
tion. The study also looks at variations of face mesh
transformation to measure their impact on accuracy
in the deep learning model. The study will present a
detailed comparative study for both a traditional base-
line approach and the proposed deep learning method.
This article will discuss the methods used for facial
paralysis recognition in an image and the results of
a study comparing two different approaches and their
results.
2 PROBLEM BACKGROUND
A delay in detecting and treating facial paralysis
might result in several complications. This is because
nerve damage worsens as time passes after the onset
of symptoms, and the healing rate slows. It is critical
to remove the inflammation that has occurred in the
nerve and prevent the progression of paralysis (Hato
et al., 2003).
The study of facial indicators has sparked a flurry
of studies on automated facial nerve function evalu-
ation based on biomedical visual capture of the face,
particularly in the field of computer vision: traditional
Baig, Z. and van der Haar, D.
Facial Paralysis Recognition Using Face Mesh-Based Learning.
DOI: 10.5220/0011682900003411
In Proceedings of the 12th International Conference on Pattern Recognition Applications and Methods (ICPRAM 2023), pages 881-888
ISBN: 978-989-758-626-2; ISSN: 2184-4313
Copyright
c
2023 by SCITEPRESS – Science and Technology Publications, Lda. Under CC license (CC BY-NC-ND 4.0)
881

photos and video capture the face, as well as infrared
(thermal imaging) and depth images (Hassaballah and
Hosny, 2019). A feature extraction technique is car-
ried out by a few image-based algorithms, which en-
tails detecting the face region in the image and then
extracting crucial points based on a specified model.
It’s also worth noting that several publicly available
shape predictors use Haar cascades to extract face fea-
tures and bespoke feature extractors that provide de-
cent results. The extraction of key points is critical
since it is utilised to compute distances and angles be-
tween landmarks later (Boyko et al., 2018).
2.1 Existing Works and Solutions
Before doing face analysis, some works employ facial
landmarks detection (i.e., facial keypoint extraction),
while other studies treat facial paralysis as a binary
classification task (Wang et al., 2016; Guarin et al.,
2018; Jiang et al., 2020). Another method by Kim
et al. offered a smartphone-based autonomous diag-
nostic system with three components: a facial land-
mark detector, a feature extractor based on facial re-
gions, and a classifier (Kim et al., 2015). The method
used by (Parra-Dominguez et al., 2021) uses a shape
predictor to extract various facial landmarks initially.
The distances between different facial landmarks are
then used to compute facial measures, and finally, a
multilayer perceptron-based classifier is used for clas-
sification. Hsu et al. proposed using deep learning
to use a standard camera to identify facial palsy (Ji-
son Hsu et al., 2018). They framed facial palsy de-
tection as an object detection task. The target objects
are the deformation areas caused by facial palsy or
the palsy regions on a patient’s face. Face detection,
facial landmark detection, and local palsy area iden-
tification are the three components of their suggested
method. Their hierarchical-based network achieves a
prediction accuracy of 93% on their private database.
Another study by Barbosa et al. (Barbosa et al.,
2019) presented a two-stage technique for classify-
ing facial paralysis: first, distinguishing healthy from
unhealthy participants and classifying facial palsy
among unhealthy people. It measured symmetry us-
ing four facial expressions: at rest, lifting the eye-
brows, screwing up the nose, and smiling. The sys-
tem used rule-based and machine-learning techniques
to create a categorisation model (hybrid classifier). In
their private database, the authors reported a sensi-
tivity of 98.12% in discriminating between healthy
and unhealthy people. Based on the attention facial
paralysis has received in the scientific community, we
should explore Machine learning algorithms to detect
facial paralysis in a picture more accurately.
3 EXPERIMENT SETUP
This study uses two approaches to identify whether a
particular image of a face has been affected by facial
paralysis. The first approach examines the symmetry
of the face, while the second uses a face mesh and
a convolutional neural network for paralysis recogni-
tion in a given facial image.
3.1 Datasets
For this study, we used four publicly available
datasets, two containing images of healthy patients,
whereas the other two comprised pictures of un-
healthy patients.
YouTube facial paralysis database (YFP) gathers
facial images of subjects suffering from facial paral-
ysis. The dataset contains 32 videos of 21 patients,
with a few cases having several recordings. These
videos are converted into a 6FPS picture sequence
since the shortest facial palsy session lasts a second
(Jison Hsu et al., 2018). The facial droop and fa-
cial paralysis image dataset was also used, which con-
tained 1024 images of unhealthy patients.
Tufts Face Database, the most complete, large-
scale face dataset available, includes seven image
modalities: visible, near-infrared, thermal, comput-
erised sketch, LYTRO, recorded video, and 3D im-
ages are used to gather images of subjects who
are considered healthy (Panetta et al., 2018). The
tufts database contains approximately 100000 im-
ages of 112 participants. To enhance robustness
against expression variation, the CK+ facial expres-
sion database was also used during our model train-
ing.
It’s worth noting that while all four of the
databases aim to make information easier to find for
the creation of therapeutic applications, they’re not
identical in terms of image quality, lighting, or pos-
ing circumstances, nor are the activities done by the
participants. In other words, while neither database
is directly equivalent to the other for our categorisa-
tion challenge, they were both helpful in the design
process.
The data set was divided into training and testing
sets, where the training set had a total of 3958 images,
with half being unhealthy subjects. The test set had a
total of 864 images which were also divided equally
among healthy and unhealthy patients. YouTube fa-
cial paralysis and Stroke face data sets were used to
train the model for unhealthy patients. For the train-
ing set of unhealthy subjects, the study used a total
of 1979 images, of which 1547 images belong to the
YouTube facial paralysis database, and the rest belong
ICPRAM 2023 - 12th International Conference on Pattern Recognition Applications and Methods
882

to the Stroke-face data set. The test set for unhealthy
patients comprised only stroke face data set images.
The training set for healthy patients used a combina-
tion of the Tufts face data set and the CK+ data set.
The training set for healthy images comprised 981
images from the CK+ data set, while the rest were
taken from Tufts face data set. The testing set for the
healthy patients contains 432 images from Tufts face
data set.
3.2 Evaluation Metrics
The study will report relevant metrics to measure the
accuracy of the classifiers. Precision and Recall are
helpful metrics of prediction success when the classes
are severely unbalanced. Precision measures result
from relevancy in information retrieval, whereas re-
call measures how many relevant results are returned
(Davis and Goadrich, 2006). The precision-recall
curve depicts the tradeoff between precision and re-
call rates for various thresholds. With high accu-
racy suggesting a low false-positive rate and high re-
call indicating a low false-negative rate, a significant
area under the curve means good recall and precision.
High scores imply that the classifier delivers accurate
results and that most positive outcomes are positive.
4 METHODS
The structure of the study consists of two approaches
for a detailed analysis of facial paralysis recognition.
Both methods include facial detection, landmark ex-
traction, feature extraction, and classification. The
first approach uses the traditional machine learning
approach using various facial distance measures be-
tween landmarks, as depicted in Figure 1, to make
classifications.
Figure 1: Traditional machine learning approach for facial
paralysis recognition.
The second approach is a deep learning approach
to facial paralysis recognition. It uses Mediapipe to
generate a face mesh from a given facial image. The
face mesh is generated using a model which focuses
on semantically significant facial areas, predicting
Figure 2: Deep learning approach for facial paralysis recog-
nition.
landmarks around the mouth, eyes, and irises more
correctly at the cost of higher computational power.
The input for this particular model is a 256 by 256 pic-
ture. Either the face detector or tracks from a previous
frame provides this image. The model divides into
numerous sub-models after obtaining a 64 64 feature
map. All 478 face mesh landmarks are predicted by
one sub-model, which also produces crop boundaries
for each region of interest. The remaining sub-models
use the matching 2424 feature maps created by the
attention mechanism to forecast regional landmarks
(Grishchenko et al., 2020). The generated mesh is
then placed on a blank background and fed to a Mo-
bilenetV2 architecture for classification, as depicted
in Figure 2.
4.1 Traditional Machine Learning
Approach with Facial Distance
measures
This approach uses traditional machine learning tech-
niques where data pre-processing is done manually
before classification. This project implements four
variations of the same method involving different
kinds of classifiers. The feature extraction and facial
measure component remain the same, whereas differ-
ent classifiers predict whether the patient is healthy.
4.1.1 Facial Landmarks Extraction
The input image is initially converted to grayscale; af-
ter that, it is scaled down to 70% of its original size.
The input image is also normalised before facial land-
mark extraction.
The facial landmark method begins by locating the
face in a picture. The face detector is a method of de-
tecting a human face in an image and delivering data
in the form of bounding boxes or rectangle box values
(Khan et al., 2019). We determine minor facial traits
like brows, lips, and so on after detecting the face’s
position in a photograph. Facial landmark detection
informs us of all the necessary elements of a human
face.
Facial Paralysis Recognition Using Face Mesh-Based Learning
883
Once the face has been detected in an image, the
system uses Dlib’s facial landmark detector to esti-
mate the position of 68 coordinates (x, y) that map
the facial points on a person’s face. It’s a landmark
facial detector using pre-trained models (Wu et al.,
2017). The extracted data is then stored for further
processing.
4.1.2 Facial Distance Measures
Once the key points have been extracted from an im-
age, we compute various distances between these key
points. This approach evaluates the image intending
to detect the symmetry level between the two sides of
the face. Information from the brows, eyes, nose, and
mouth is extracted in the suggested measurements.
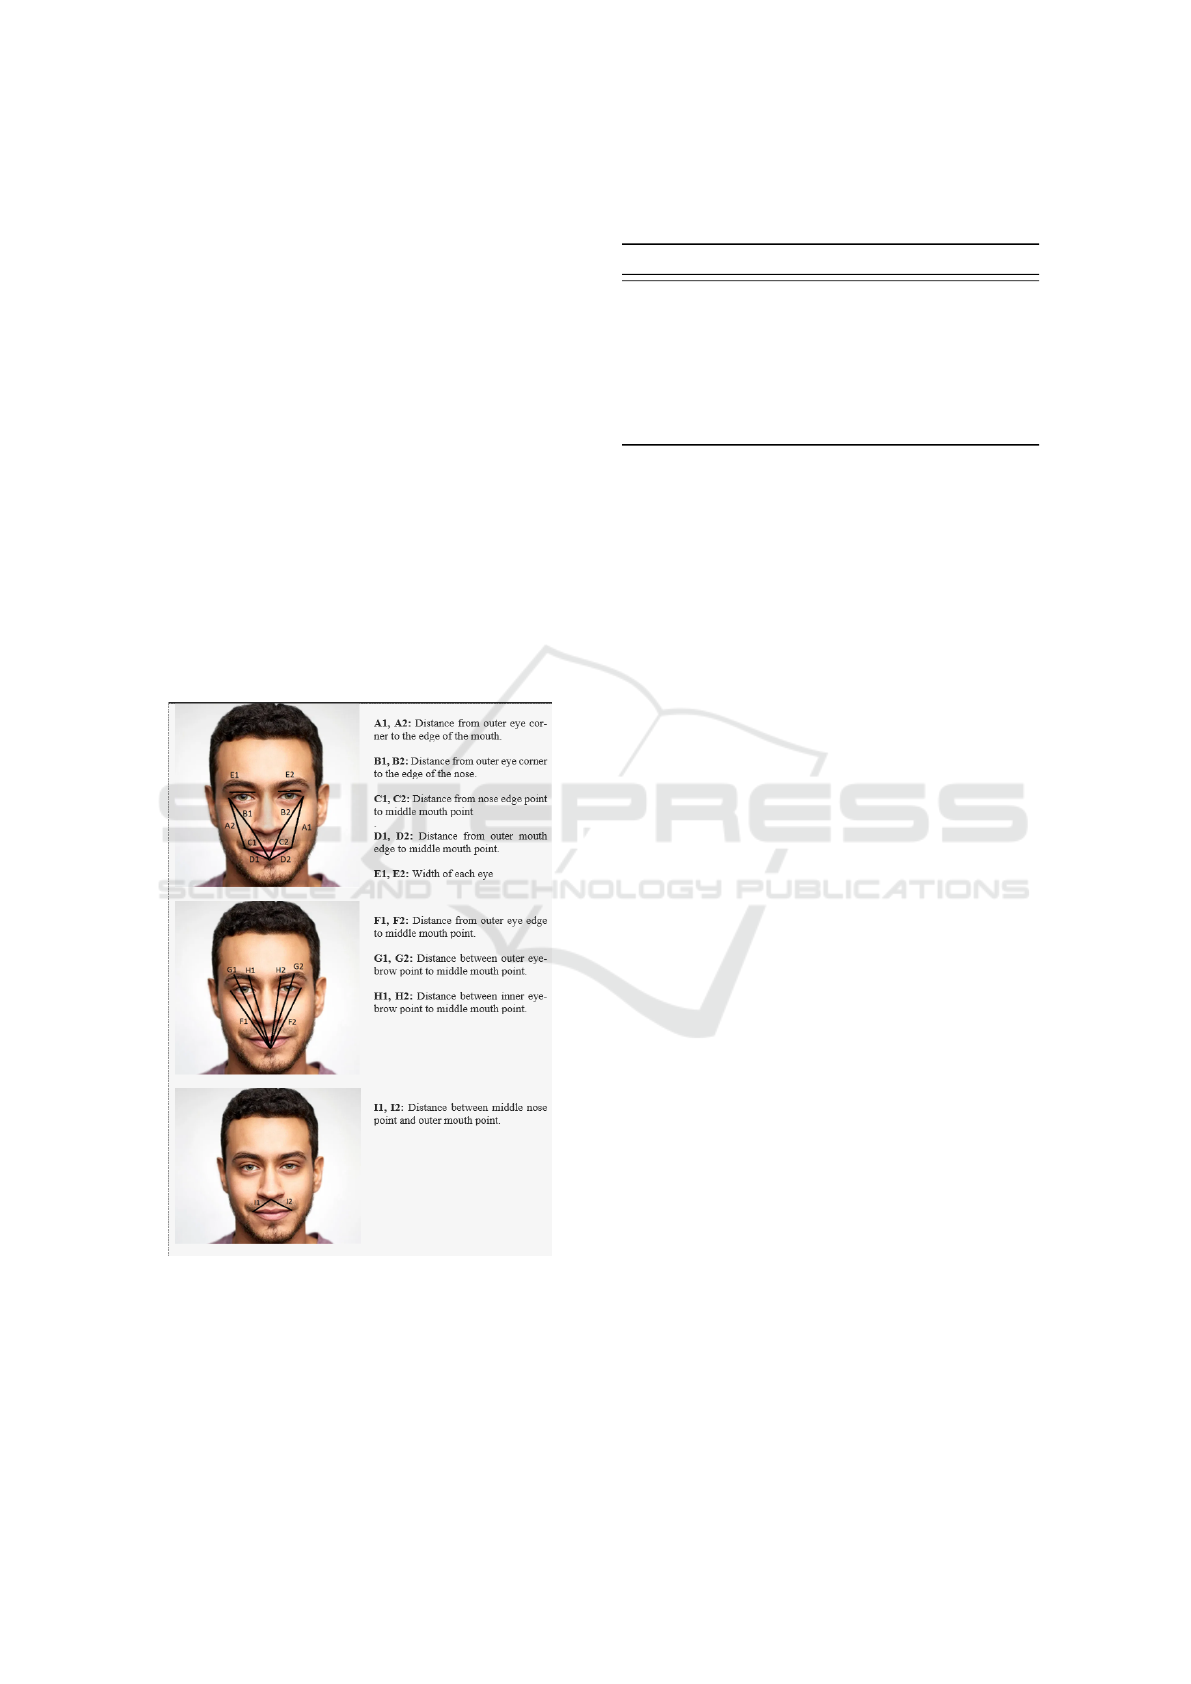
Twenty-one various distances were calculated using
the facial key points. The multiple distances pre-
sented in Figure 3 allow us to compute the asymmetry
level of a human face to categorise them into healthy
and unhealthy subjects. Figure 3 below shows the dif-
ferent facial distances and descriptions.
Figure 3: Distance measures between various facial land-
marks.
The proposed facial measures are used to com-
pute the asymmetry level between the face’s left and
right sides of the face. The work of (Parra-Dominguez
et al., 2021) uses the percentage differences depicted
in Table 1 between the various facial measures to de-
Table 1: Percentage distance measures between various fa-
cial landmarks
Measure Description
D1 Percentage difference between B1 and B2
D2 Percentage difference between C1 and C2
D3 Percentage difference between A1 and A2
D4 Percentage difference between D1 and D2
D5 Percentage difference between E1 and E2
D6 Percentage difference between I1 and I2
D7 Percentage difference between F1 and F2
D8 Percentage difference between H1 and H2
termine if a subject is healthy or unhealthy.
4.1.3 Classifiers
As mentioned previously, our first approach uses four
classifiers to predict whether the subject falls under
the healthy or unhealthy patient category. The list of
classifiers used for our study involves the following:
1. Support Vector Machine.
2. XGBoost Learning Algorithm.
3. K Nearest Neighbour
4. Random Forest Classifier
4.2 Face-mesh Based Learning Using
MobileNetV2 Architecture
Traditional machine learning techniques have inher-
ent limitations when identifying features and infor-
mation in picture data. Due to their multi-level archi-
tecture, CNNs, in particular, assist in getting around
these restrictions. This approach has a facial land-
mark extraction component. It then uses Google’s
media pipe, a cutting-edge tool that calculates 468 3D
face markers in real-time, even on mobile devices, to
produce a facial mesh.
Before feeding our Convolutional neural network
with train and test samples, image samples must be
pre-processed. The images are firstly resized to 224
by 224. Some photos can be in grayscale one chan-
nel. Therefore, we convert them to a three-channel by
repeating the intensity across the three channels. The
process then reads the image in RGB format and ap-
plies pixel normalisation. Google’s Mediapipe is then
used to extract a facial mesh from the normalised im-
age. Once the facial mesh is generated, it is placed
on a black background, concluding the image pre-
processing stage. Once the image pre-processing has
been completed, our convolutional neural network is
ready to accept the input data. Before feeding data to
the CNN, the training data goes through a data aug-
mentation stage, which increases the diversity of a
dataset without the need to collect more data.
ICPRAM 2023 - 12th International Conference on Pattern Recognition Applications and Methods
884

In the proposed method, the MobileNetV2 ar-
chitecture forms the first layer of our model, a
lightweight and memory-efficient architecture, fol-
lowed by a two-dimensional Global Average Pool-
ing layer. Global average pooling is intended to take
the role of the fully connected layer in conventional
CNNs. The goal is to produce one feature map in the
final mlpconv layer for each category that corresponds
to the classification problem rather than constructing
fully linked layers on top of the feature maps. We
then add a dropout layer with a 20% dropout rate to
stop overfitting during the training of a neural network
model. A specific number of neurons in the network
are ignored or dropped out randomly using the tech-
nique. Finally, we add a fully connected layer with a
softmax activation function for binary classification.
Slight variations in the colour of the generated
mesh result in mild variations in the performance and
accuracy of the method. All the variations in feature
extraction are depicted in Figure 4. The reason for
generating various feature templates was to develop a
variety of results for a comprehensive comparison of
mesh composition strategies. The results section will
elaborate on the scores achieved using each feature
template depicted below.
Figure 4: Variations of face meshes generated (referred to
as template A,B and C respectively.
5 RESULTS
5.1 Traditional Machine Learning
Approach
In our first approach to facial paralysis recogni-
tion, we used traditional machine learning classifiers,
which included:
1. Support Vector machine.
2. XGBoost Learning Algorithm
3. K Nearest Neighbours
4. Random Forest Classifier
Precision and recall measures and the F1 score
were calculated for each classifier. Finally, the over-
all accuracy score was calculated for each of the clas-
sifiers. The function used to calculate the accuracy
score computes subset accuracy, meaning that the set
of labels predicted for a sample should match the cor-
responding set of ground truth labels. Table 2 sum-
marises the classification scores for all the various
classifiers used in our initial method.
The support vector machine achieved an overall
accuracy of 78.09%, with an average recall of 74.5%.
This shows us that the classifier predicted the relevant
cases correctly 74.5% of the time. Precision scores
depict that classes were correctly labelled with 81.5%
accuracy, whereas healthy patients were labelled with
75% accuracy. The overall accuracy of the classifier
is 78.09%, indicating that 78.09% of the predicted la-
bels matched precisely with the ground truth values.
The report shows that the XGBoost classifier per-
formed better than the support vector machine, with
a precision and accuracy of approximately 94%. The
classifier used two thousand estimators, and the rest
of the parameters were kept to default. The XGBoost
classifier had a 20% increase in accuracy score com-
pared to the support vector machine.
K nearest neighbour also outperformed the sup-
port vector machine with an accuracy score of 83%
with a 5% increase in overall classification accu-
racy. It (KNN) achieved an average precision score
of 87.5%. However, this classifier did not perform as
well as the XGboost classifier.
A random forest classifier based on an ensemble
learning technique outperformed all the classifiers in
our approach with an accuracy score of 94.68%, as
shown in Table 2. The classifier used ten thousand
estimators.
5.2 Face-mesh Based Learning Using
MobilenetV2 Architecture
The second approach used a convolutional neural net-
work for classification purposes, specifically a Mo-
bileNetV2 architecture. MobileNetV2’s architecture
starts with a fully convolutional layer with 32 fil-
ters and is followed by 19 remaining bottleneck lay-
ers. Because ReLU6 is reliable when used with low-
precision computing, we choose it as the non-linearity
(Sandler et al., 2018). We add a global average
pooling layer after the Mobilenet architecture, which
converts the features into a single vector per image.
A drop-out layer follows the global average pooling
layer to avoid overfitting. Finally, the model has a
fully connected layer with a softmax activation func-
tion for classification.
The deep-learning-based approach outperformed
the traditional machine-learning approaches with an
overall accuracy of 98.93%. Let’s compare our deep-
learning approach by taking the best-performing con-
ventional technique, a random forest classifier. We
Facial Paralysis Recognition Using Face Mesh-Based Learning
885

Table 2: Comparison with previous studies.
Method Precision Recall F1-Score Accuracy
Huang et al 93% 88% - -
Barbosa et al - 98.12% - -
Kim et al 92.3% 90% - 88.9%
Gemma et al 99.24% - - 97.22%
SVM 81.5% 74.5% 75.5% 78.09%
XGBoost 94% 93.5% 93.5% 93.81%
KNN 87.5% 78.5% 80.5% 83.16%
RFC 94.5% 95% 94.5% 94.68%
MobileNetV2 99% 99% 99% 98.93%
can see a 4% increase in the overall accuracy of the
classifier.
Comparing our results against Huang et al., we
can see a 5.5 per cent increase in precision. Gemma et
al. achieved higher average precision than our model,
but our approach had a 1.71% increase in accuracy.
It is important to note that results for Kim et al(Kim
et al., 2015) and Barbosa et al. (Barbosa et al., 2019)
made use of a private database.
6 ABLATION STUDY
The study implemented an ablation experiment to as-
sess the performance of the deep learning model. The
experiment generated various feature templates, as
shown in Figure 4, to analyse the variance in the per-
formance of the model. A cross-data set analysis was
performed to measure the impact of data imbalance
in the face of variability. Finally, the experiment gen-
erated a t-SNE or t-Distributed Stochastic Neighbour
Embedding report by converting the four-dimensional
feature maps to 2-dimensional ones. The scatter plot
for the 2-dimensional features helps us to determine
which input data seems similar to the deep neural net-
work.
6.1 Different Feature Templates
For a comparative study, we generated different
colours for face-mesh at the feature extraction stage.
Table 3 summarises the model’s overall classification
report with different feature templates, as reported in
Figure 4. The table above shows that the convolu-
tional neural network performance in terms of accu-
racy was similar when given the first two types of
feature templates. However, with a black background
and a white face mesh, CNN’s performance decreased
by 0.3%. The overall results show an improvement
from the traditional techniques, with an accuracy of
98.93 %.
Table 3: Classification report for deep learning approach
using MobilenetV2 architecture for the varying feature tem-
plates.
Template Precision Recall F1-Score Accuracy
A 99% 99% 99% 98.93%
B 99% 99% 99% 98.93%
C 99% 99% 99% 98.63%
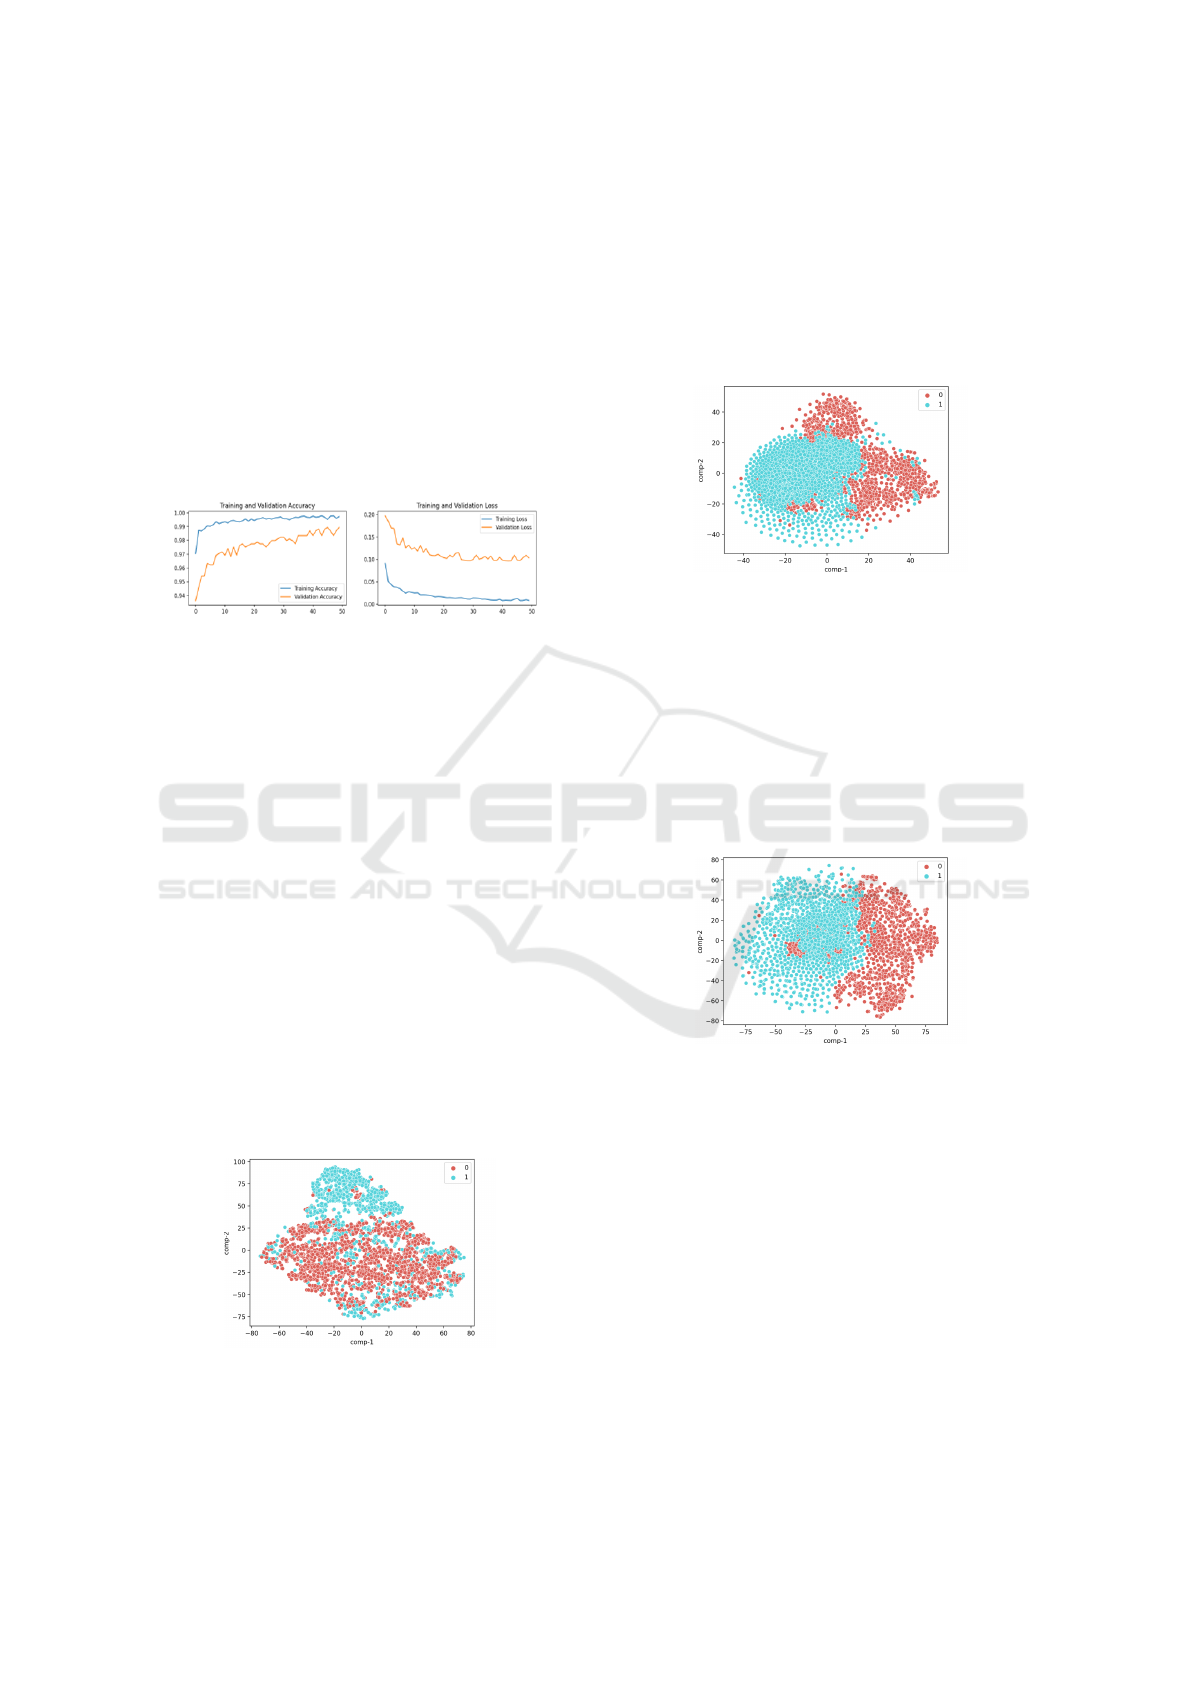
6.2 Cross Dataset Validation
The performance of our model showed a great deal
of variation when different combinations of data sets
were used for training and testing purposes. Train-
ing and validation loss/accuracy curves were gener-
ated to analyse whether the model was overfitting.
Apart from the original combination of the data set,
depcited in Figure 5, the experiment creates two dif-
ferent combinations of the data set already in use. The
first combination used YouTube Facial paralysis data
set and TUFTs face data set for model training. In
contrast, the Stroke face and CK+ data sets were used
as testing sets for Unhealthy and healthy patients, re-
spectively.
Figure 5: Training and validation learning curves for the
first combination of data sets.
The second combination slightly differed from the
first combination shown in Figure 6. The training and
testing set for unhealthy subjects remain the same,
whereas, for healthy subjects, we swapped the CK+
and the TUFTS face data set for training and testing
purposes. Results in Figure 6 below show that the
model overfits faster than the first combination of data
sets due to a steeper validation loss curve. It is impor-
tant to note that during such experiments, the ratios
between various data sets may vary due to the differ-
ent sizes of the data sets. We do not claim that dif-
ferent data set combinations used in this experiment
were equal in ratio. However, it gives us a good indi-
cation of whether data imbalance impacts the face of
variability.
Figure 6: Training and validation learning curves for the
second combination of data sets.
ICPRAM 2023 - 12th International Conference on Pattern Recognition Applications and Methods
886
The third combination of data sets was similar to
the data set mentioned in section 3.1. However, we
reduced the number of CK+ data set images from 981
to 730 for the training set of healthy subjects. Figure
7 shows that the validation and training loss decreases
gradually, indicating that the model is not overfitting.
This supports the claim of Huang et al., where adding
CK+ makes our model more robust against facial ex-
pression variation. The decline in healthy subject im-
ages from the CK+ data set resulted in an overall ac-
curacy of 98.74% which has a 0.20% decrease from
the original model where 981 images were used from
the CK+ data set.
Figure 7: Training and validation learning curves for the
third combination of data sets.
6.3 t-SNE Report
The final part of our ablation study provides a t-SNE
report on the different feature vectors generated in our
methods by detecting observable clusters based on the
similarity of data points with many attributes. t-SNE
aims to uncover multidimensional data patterns by
mapping them to a lower-dimensional space, allow-
ing us to assess the appropriateness of each feature
space.
6.3.1 t-SNE Report for Traditional Machine
learning techniques
The t-SNE report in Figure 8 provides a scatter plot
of the two classes under observation. 0 represents
healthy subjects, whereas 1 represents unhealthy sub-
jects. The figure also shows small clusters of un-
healthy classes forming within the cluster of healthy
cases.
Figure 8: Scatter plot of t-SNE on distance measures calcu-
lated for traditional machine learning approach.
6.3.2 t-SNE Report for Different Feature
Templates for Deep Learning Approach
There were significant differences in scatter plots
when different feature templates were used for our
deep-learning approach. Figure 9 represents a t-SNE
scatter plot for a white face mesh. We see the forma-
tion of two different clusters within the scatter plot.
Figure 9: Scatter plot of t-SNE on feature template with a
white face mesh over a black background.
On the other hand, Figure 10 shows us a t-SNE
scatter plot for a colour face mesh with a black back-
ground. We see healthy subjects forming within the
unhealthy subjects cluster. This condition can occur
due to some occlusions that may have malformed de-
scriptors. Future studies will examine why such clus-
ters formed, and more robust quality checks will be
employed at pre-processing image level so that occlu-
sions with malformed descriptors are avoided.
Figure 10: Scatter plot of t-SNE on feature template with a
colour face mesh over a black background.
7 CONCLUSION
A method for detecting facial paralysis in a picture
was presented, using two different approaches for a
comparative study. The first approach extracted 26
facial measures computed using facial landmarks dur-
ing the feature extraction phase and used various bi-
nary classifiers which provide a healthy or unhealthy
label. Classifiers for the first approach included a sup-
port vector machine, XGBoost classifier, K Nearest
Neighbour and a random forest classifier with a ran-
dom forest classifier outperforming every other clas-
sifier with an accuracy score of 94.68%. On the
Facial Paralysis Recognition Using Face Mesh-Based Learning
887

other hand, the deep learning-based approach for im-
age classification used MobileNetV2 as a base model
for the overall structure and a different feature space
resulting in a facial mesh. Looking at our results,
we achieved an accuracy of approximately 98.93%,
which shows that the model outperformed all the pre-
vious studies mentioned in the article and our ini-
tial approach. Developing such incremental and im-
proved methods results in higher reliability and accu-
racy in medical diagnostic systems. These methods
can also serve as the basis for forming standardised
tools for medical assessments, treatment, and moni-
toring.
REFERENCES
Barbosa, J., Seo, W.-K., and Kang, J. (2019). parafacetest:
an ensemble of regression tree-based facial features
extraction for efficient facial paralysis classification.
BMC Medical Imaging, 19(1):1–14.
Boyko, N., Basystiuk, O., and Shakhovska, N. (2018). Per-
formance evaluation and comparison of software for
face recognition, based on dlib and opencv library. In
2018 IEEE Second International Conference on Data
Stream Mining & Processing (DSMP), pages 478–
482. IEEE.
Davis, J. and Goadrich, M. (2006). The relationship be-
tween precision-recall and roc curves. In Proceed-
ings of the 23rd international conference on Machine
learning, pages 233–240.
Grishchenko, I., Ablavatski, A., Kartynnik, Y., Raveen-
dran, K., and Grundmann, M. (2020). Attention mesh:
High-fidelity face mesh prediction in real-time. arXiv
preprint arXiv:2006.10962.
Guarin, D. L., Dusseldorp, J., Hadlock, T. A., and Jowett, N.
(2018). A machine learning approach for automated
facial measurements in facial palsy. JAMA facial plas-
tic surgery, 20(4):335–337.
Hassaballah, M. and Hosny, K. M. (2019). Recent advances
in computer vision. Studies in computational intelli-
gence, 804:1–84.
Hato, N., Matsumoto, S., Kisaki, H., Takahashi, H., Wak-
isaka, H., Honda, N., Gyo, K., Murakami, S., and
Yanagihara, N. (2003). Efficacy of early treatment
of bell’s palsy with oral acyclovir and prednisolone.
Otology & neurotology, 24(6):948–951.
Jiang, C., Wu, J., Zhong, W., Wei, M., Tong, J., Yu, H.,
and Wang, L. (2020). Automatic facial paralysis as-
sessment via computational image analysis. Journal
of Healthcare Engineering, 2020.
Jison Hsu, G.-S., Huang, W.-F., and Kang, J.-H. (2018). Hi-
erarchical network for facial palsy detection. In Pro-
ceedings of the IEEE Conference on Computer Vision
and Pattern Recognition Workshops, pages 580–586.
Khan, M., Chakraborty, S., Astya, R., and Khepra, S.
(2019). Face detection and recognition using opencv.
In 2019 International Conference on Computing,
Communication, and Intelligent Systems (ICCCIS),
pages 116–119. IEEE.
Kim, H. S., Kim, S. Y., Kim, Y. H., and Park, K. S. (2015).
A smartphone-based automatic diagnosis system for
facial nerve palsy. Sensors, 15(10):26756–26768.
Panetta, K., Wan, Q., Agaian, S., Rajeev, S., Kamath, S.,
Rajendran, R., Rao, S. P., Kaszowska, A., Taylor,
H. A., Samani, A., et al. (2018). A comprehensive
database for benchmarking imaging systems. IEEE
transactions on pattern analysis and machine intelli-
gence, 42(3):509–520.
Parra-Dominguez, G. S., Sanchez-Yanez, R. E., and Garcia-
Capulin, C. H. (2021). Facial paralysis detection on
images using key point analysis. Applied Sciences,
11(5):2435.
Sandler, M., Howard, A., Zhu, M., Zhmoginov, A., and
Chen, L.-C. (2018). Mobilenetv2: Inverted residu-
als and linear bottlenecks. In Proceedings of the IEEE
conference on computer vision and pattern recogni-
tion, pages 4510–4520.
Tiemstra, J. D. and Khatkhate, N. (2007). Bell’s palsy: di-
agnosis and management. American family physician,
76(7):997–1002.
Wang, T., Zhang, S., Dong, J., Liu, L., and Yu, H.
(2016). Automatic evaluation of the degree of facial
nerve paralysis. Multimedia Tools and Applications,
75(19):11893–11908.
Wu, Y., Hassner, T., Kim, K., Medioni, G., and Natarajan, P.
(2017). Facial landmark detection with tweaked con-
volutional neural networks. IEEE transactions on pat-
tern analysis and machine intelligence, 40(12):3067–
3074.
ICPRAM 2023 - 12th International Conference on Pattern Recognition Applications and Methods
888
