
Evaluation of a Tool to Increase Cybersecurity Awareness Among
Non-experts (SME Employees)
Kaiying Luan
1a
, Ragnhild Halvorsrud
2b
and Costas Boletsis
2c
1
Department of Informatics, University of Oslo, Oslo, Norway
2
SINTEF Digital, Oslo, Norway
Keywords: Cybersecurity Awareness, Customer Journey Modelling Language, Tool Development, Empirical Study.
Abstract: Humans are the weak link in cybersecurity, hence, this paper considers the human factor in cybersecurity and
how the customer journey approach can be used to increase cybersecurity awareness. The Customer Journey
Modelling Language (CJML) is used to document and visualise a service process. We expand the CJML
formalism to encompass cybersecurity and develop an easy-to-use web application as a supporting tool for
training and awareness. We present the results from the usability test with ten persons in the target group and
report on usability and feasibility. All participants managed to finish the test, and most participants indicated
that the tool was easy to use. By using the tool, non-expert users can make user journey diagrams showing
basic conformance in a short time without professional training. For the threat diagram, half of the users
achieved full conformance. In conclusion, the tool can serve as low-threshold cybersecurity awareness
training for SME employees. We discuss the limitations and validity of the results and future work to improve
the tool’s usability.
1 INTRODUCTION
Small and medium-sized enterprises (SMEs) are
considered the latest target for cyberattacks. They are
among the least mature and most vulnerable
enterprises in terms of their cybersecurity risk and
resilience, and they rarely conduct thorough risk
assessments (Benz & Chatterjee, 2020; Paulsen,
2016; Ponsard & Grandclaudon, 2020; Vakakis et al.,
2019). In addition, they may face various internal
issues when attempting to set up cyber-risk strategies,
such as relatively small IT teams, inadequate security
budgets and disagreements between IT and business
leadership teams regarding cybersecurity risk
management. Consequently, over half of the existing
SMEs either lack a defined cyber-risk strategy or
have not updated existing ones (Benz & Chatterjee,
2020; Paulsen, 2016; The National Center for the
Middle Market, 2016). Evidence suggests that the
human element, i.e., clicking unknown links, may be
among the greatest internal threats faced by SMEs
(Meshkat et al., 2020; Symantec, 2019). As such, the
a
https://orcid.org/0000-0001-8015-6571
b
https://orcid.org/0000-0002-3774-4287
c
https://orcid.org/0000-0003-2741-8127
most challenging aspect of cybersecurity risk
management in SMEs is taking the first step, which
involves implementing the appropriate initial actions
to improve security posture and address human errors.
Prior studies have proposed mapping the current
practices of SMEs and the potential threats they may
face as a useful first step in cybersecurity risk
management (Benz & Chatterjee, 2020; Boletsis et
al., 2021; Meszaros & Buchalcevova, 2017; Paulsen,
2016). This mapping method generates a model of
human behaviour in cybersecurity-related scenarios
and presents it in a comprehensible way (Bellamy et
al., 2007; Boletsis et al., 2021; Kullman et al., 2020;
Paulsen, 2016). A recent paper has suggested using a
customer journey approach for clear communication
of problematic human behaviour towards SME
employees (Boletsis et al., 2021). In general, the term
“customer journey” is used as a metaphor for
examining a service process from the perspective of a
customer or end-user (Tueanrat et al., 2021). The
journey concept puts humans at the centre of the
process, regardless of their specific role. A journey
Luan, K., Halvorsrud, R. and Boletsis, C.
Evaluation of a Tool to Increase Cybersecurity Awareness Among Non-experts (SME Employees).
DOI: 10.5220/0011680500003405
In Proceedings of the 9th International Conference on Information Systems Security and Privacy (ICISSP 2023), pages 509-518
ISBN: 978-989-758-624-8; ISSN: 2184-4356
Copyright
c
2023 by SCITEPRESS – Science and Technology Publications, Lda. Under CC license (CC BY-NC-ND 4.0)
509

map refers to a visualisation of the end-users’ steps,
or touchpoints, to achieve a specific goal or to reach
a desired outcome.
This study explores how a customer journey
approach can be used to raise awareness about
cybersecurity. More specifically, we extend an
existing framework for customer journeys with
formalism from the CORAS language for risk
modelling (Lund et al., 2011). Furthermore, we
develop a tool for training SME employees and
evaluate it with representatives from the target group.
Given the target group’s breadth and heterogeneity,
the tool does not require any technical or
cybersecurity expertise. In this way, we investigate
whether such a tool can support increased awareness
of cybersecurity among non-experts in SMEs.
1.1 Research Questions and Overview
The overall research question (RQ) is: Can a
customer journey approach support non-experts in
essential cybersecurity awareness? More specifically:
RQ1: How can we develop a tool for threat
scenarios based on customer journeys?
RQ2: What degree of precision can target users
achieve through the models developed using
this tool?
RQ3: What is the perceived usefulness of the
tool?
The next section reviews related work and how
human factors can be used to help increase
cybersecurity awareness. Section 3 introduces the
customer journey approach, and Section 4 explains
how it was extended using basic properties from risk
modelling. Section 5 describes the tool’s
development and its experimental design; Section 6
describes the outcome of the evaluation; Section 7
discusses the results and the limitations of the study;
and, finally, Section 8 concludes the paper and
suggests future work.
2 RELATED WORKS
The term “human factor” is commonly used when
describing human performance, technological design,
and human-computer interactions. It is a key element
in cybersecurity, and in this context, it always
represents user failures and human error –
unintentional actions or a lack of appropriate action
(Ferronato & Bashir, 2020). According to recent
research, 82% of data breaches involve human factors
(Verizon Business, 2022). Obviously, the human
factor plays a vital role in cybersecurity.
According to a study by Sharma and Bashir
(2020) about how phishing emails exploit human
vulnerabilities, emotional triggers and subject lines
that include a user’s online account name and
“payment information” are the most frequent and
successful methods used by phishing attackers. Due
to the lack of protective action and poor knowledge
of cyber threats, users are often attracted by these
strategies and led to phishing traps. Thus, to avoid
such risks, it is vital to increase users’ fundamental
awareness of cybersecurity.
Moreover, a company’s assets are accessed not
only by computer experts, but also by employees with
a non-technical background. Thus, differentiated
learning and training methods should be applied to
ensure that all employees gain awareness of
cybersecurity. Tsohou et al. (2010) proposed a
theoretical and methodological framework based on
the Actor Network Theory and the due process
model; by analysing actors’ interests, roles and goals,
this framework can provide insights into the analysis
of security awareness activities and, finally, guide
actors to security-oriented behaviours. Ghafir et al.
(2018) proposed a security awareness training
framework to help businesses and employees
understand potential cyber threats and mitigation
strategies for self and business protection. This
framework monitors employees’ activities at their
workstations and instantly provides them with
information regarding online security and social
engineering when they access websites that may lead
to potential cyberattacks.
While there are already many methods utilised for
cybersecurity awareness, we still lack computer-
based training programmes that take the customer
journey approach into account.
3 CUSTOMER JOURNEY
MODELLING LANGUAGE
The Customer Journey Modelling Language (CJML)
is a domain-specific modelling language for
documentation and visualization of end-user
journeys, regardless of whether the human has the
role of customer, employee, user or citizen
(Halvorsrud et al., 2021). The rationale for exploring
CJML in the present study is that the language, as
such, is precise and well documented. Furthermore,
previous studies indicate that users with a non-
technical background can adopt CJML and generate
appropriate diagrams with good precision
(Halvorsrud et al., 2016).
ICISSP 2023 - 9th International Conference on Information Systems Security and Privacy
510
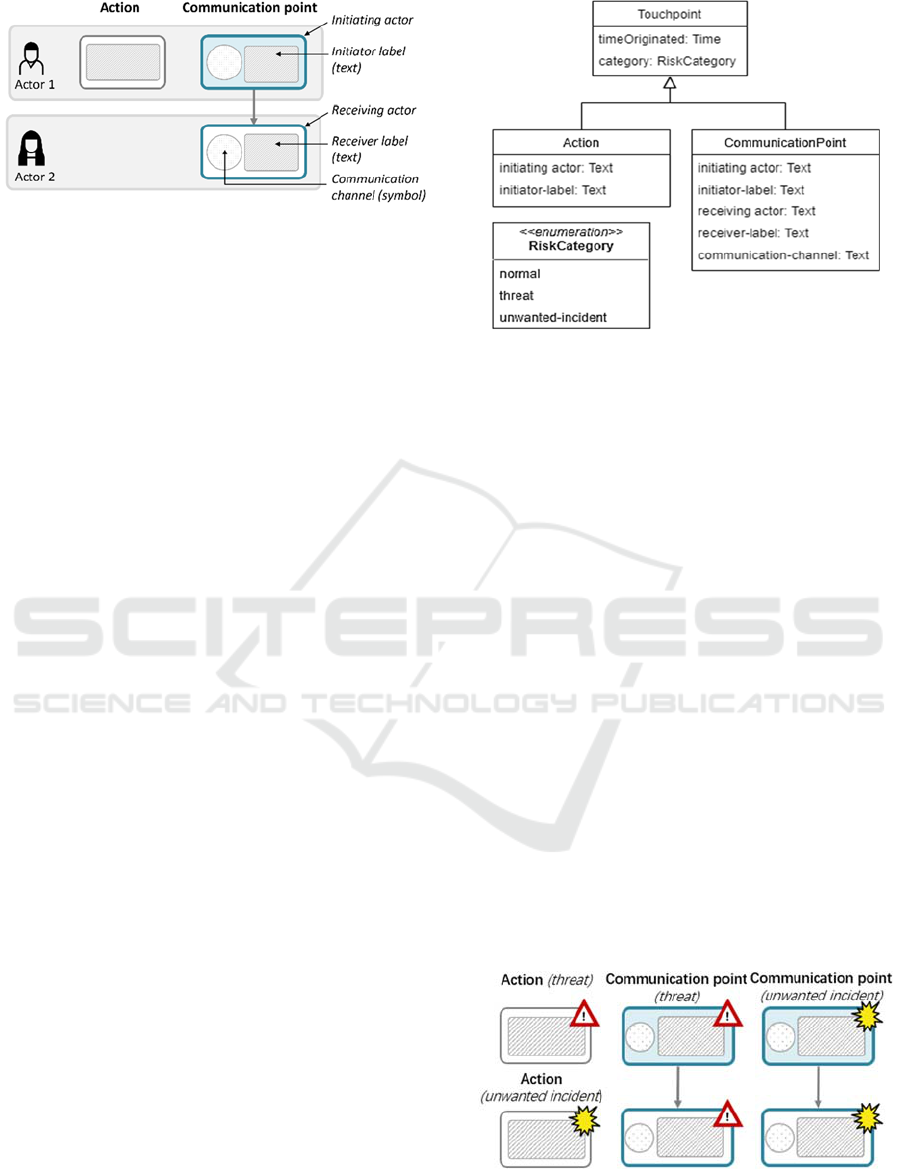
Figure 1: Key elements of the CJML swimlane diagram.
In CJML, the core ingredients of a journey are the
actors (the end-user and other involved entities) and the
touchpoints, i.e., the process steps encountered by the
actors. A touchpoint can be of two types: (1) a
communication point (an instance of communication
between two actors) or (2) an action (an activity
conducted by an actor as part of the journey).
In CJML, two types of diagrams can be used to
emphasize different perspectives: the simple journey
diagram and the swimlane diagram (also called the
journey network diagram). The journey diagram is
suitable for journeys involving few actors and for
emphasizing deviations in the expected behaviour.
Swimlane diagrams, on the other hand, are more
suitable for service delivery networks (Tax et al.,
2013), emphasizing mutual interactions in a network
of several actors. In the present work, we focus only
on the swimlane diagram type. Here, each actor’s
journey is confined in separate swimlanes, and both
the initiator and receiver of a communication point
are readily available, as seen in Figure 1. The colour
of the boxes and the direction of the arrows indicate
the message flow. The symbol area in the
communication points indicates the communication
channel carrying the message. The figure also shows
an action located in the relevant swimlane.
4 EXTENDING THE
FORMALISM OF CJML
In this section, we describe how the syntax of CJML
was extended to encompass essential concepts from
cybersecurity. We adopted key elements like threat
and unwanted incident from CORAS, a model-driven
and self-contained approach to risk management that
emphasises cybersecurity and cyber-risk assessment
(Lund et al., 2011). In CORAS, each threat scenario
needs to have an identified asset. Every threat has an
action or event that may cause an unwanted incident,
where an unwanted incident is the damage or loss of
the asset.
Figure 2: The Touchpoint class expanded with risk
categories.
As human activities and communications may
themselves cause threats and unwanted incidents, we
developed two new elements as novel attributes in the
touchpoints of CJML. Following the UML class
diagram notation, Figure 2 shows the essential
attributes of the Touchpoint class. Threats and
unwanted incidents are categorised based on the risk
category of the touchpoints, including three potential
states: normal, threat and unwanted incident.
To apply the risk categories to the swimlane
diagram, the following symbols were designed based
on the existing symbols in the CORAS framework, as
shown in Figure 3. The symbol in the upper right
corner indicates whether the touchpoint represents a
threat or an unwanted incident.
Figure 4 shows an example threat scenario using
the extended CJML. Here, an attacker acquires a
customer’s personal information. The attacker calls
the customer, pretending to be an employee at his
bank (threat). The attacker informs the customer
about a bill that is due the same day, requesting an
amount paid to a special account. The customer trusts
the false bank employee and transfers money to the
account (unwanted incident).
Figure 3: The concrete syntax for touchpoints in the case of
the risk categories threat and unwanted incident.
Evaluation of a Tool to Increase Cybersecurity Awareness Among Non-experts (SME Employees)
511
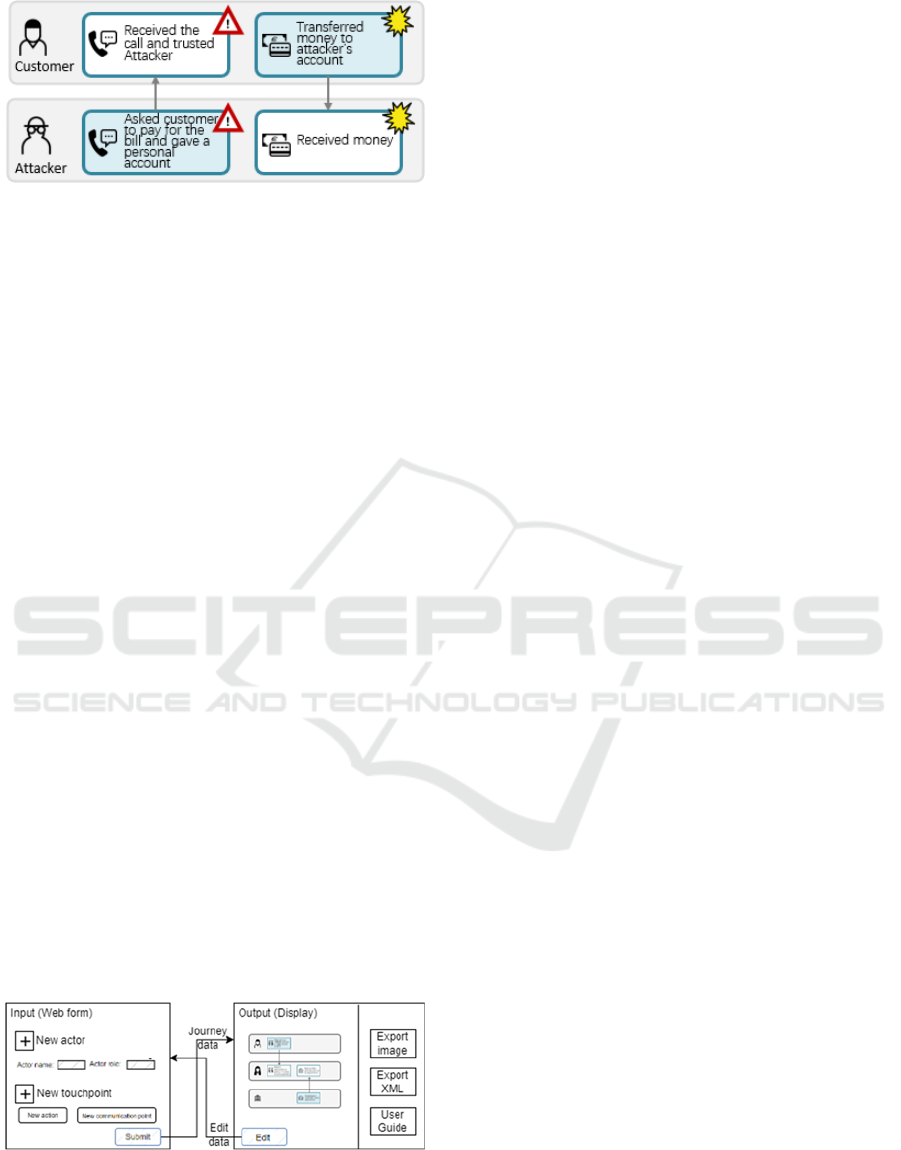
Figure 4: Example of the threat scenario.
5 METHOD
This section describes the development of the tool,
the design of the experiment, and the procedure for
evaluation of the tool with target users.
5.1 Development of the Tool
The tool was developed as a web application that can
be run on all commonly used browsers. Figure 5
outlines the basic structure of the tool. The user
specifies the journey through a web form, providing
the necessary information for the actors and
touchpoints through input fields such as drop-down
menus, text fields, and radio buttons. Upon
submitting the journey data, the web application
processes the data and automatically generates the
diagram. In the case of missing data, the user is
prompted to provide more data. The user may return
to the web form to modify the journey data at any
stage through the “edit” option. The diagram can be
exported both as an image in the PNG format or an
XML document. An easily understandable user guide
is one of the most important aspects of the tool as it is
the only way for users, especially new users, to
understand how to use the tool and generate a valid
CJML diagram.
JavaScript was the primary programming
language, and Netlify was used to deploy the web
application to ensure that users could access it
anytime on any device.
Figure 5: Basic structure of the tool.
5.2 Experimental Design
As defined by Shackel (2009), usability is “the
capability to be used by humans easily and
effectively”. More specifically, it is defined by the
International Organization for Standardization (ISO)
as the “extent to which a product can be used by
specified users to achieve specified goals with
effectiveness, efficiency, and satisfaction in a
specified context of use” (Wever et al., 2008).
The COVID-19 pandemic has led to an increasing
focus on remote work (Larsen et al., 2021), which
allows people who are separated in time and space to
work together (Burzacca & Paternò, 2013). Thus, a
remote usability test has many advantages over lab-
based testing, such as low cost, greater freedom, and
higher efficiency (Alhadreti, 2022; Dray & Siegel,
2004), and has become the preferred method. As such,
the experiment was designed as a remote usability test
with two options (for the user to choose between a
remote 1:1 moderated test and a remote unmoderated
test).
5.2.1 Overview of the Experimental
Procedure
The usability test was designed as a 1-hour session,
targeting participants working in SMEs. No prior
experience with CJML or any other modelling
language was required. The experiment was
conducted over a period of three days in April 2022.
The remote moderated test was designed as a
virtual meeting (using Microsoft Teams) and
consisted of the following three sessions:
Session 1: Introduction to the extended CJML
model by the moderator, including a
walkthrough of a warm-up example scenario;
Session 2: Modelling of two scenarios: a
general scenario and a threat scenario;
Session 3: Q&A session. Participants could ask
questions and provide feedback about the tool
and CJML.
The two modelling scenarios (tested in Session 2)
were the same for the moderated and unmoderated
tests and are shown in the next section.
In contrast to the moderated test, the unmoderated
test gave the participants more freedom. Instructions
for carrying out the test were sent through e-mail,
with a link to the tool, feedback questionnaire, as well
as recommended test procedures. The participants
were instructed to export and return their modelling
scenarios through e-mail immediately after finishing
the test.
ICISSP 2023 - 9th International Conference on Information Systems Security and Privacy
512
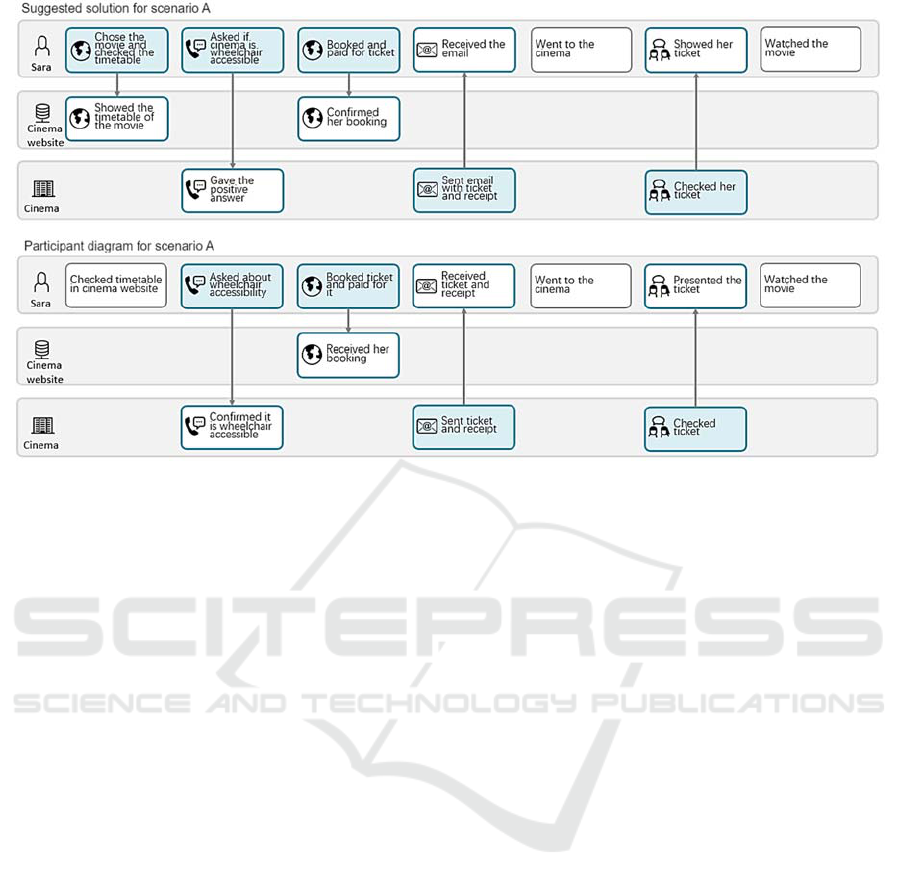
Figure 6: Scenario A: Suggested solution (top) and one participant model (bottom).
The same feedback questionnaires were sent to
the participants by email before both the moderated
and unmoderated tests commenced. Participants in
the unmoderated test were required to send back the
questionnaire with questions regarding their prior
experience and feedback about the test and the tool,
while the moderated test participants were asked the
same questions as the unmoderated test participants
(in the questionnaires) during the test (sessions 1 and
3) and required to send back the form if they had extra
feedback.
5.2.2 Test Scenarios
Central to the usability test were the two modelling
exercises given to the participants. Some minor
simplification was applied to the scenarios to reduce
the degree of variation in the responses. The
following textual descriptions were provided
verbatim to the participants during the test:
A. Scenario A: General customer journey
(Background: Sara wanted to watch a new movie and
needed to use a wheelchair because she broke her
legs last week.) She accessed the cinema website and
checked the timetable of the movie. Sara decided to
watch the movie scheduled at 8 p.m. She called the
cinema and asked them if it was wheelchair-
accessible. After she got a positive answer, Sara
booked and paid for the ticket on the website. After
the payment, she received an email with the receipt
and ticket from the website. Sara went to the cinema.
There, the staff checked her ticket, and she watched
the movie.
Figure 6 shows the suggested solution for
Scenario A and a diagram produced by one of the
participants.
B. Scenario B: Customer journey with a phishing
attack
This threat scenario contained a phishing attack, since
these are among the most common types of
cyberattacks. The asset is identified as Bobs’ money
in the following scenario.
(Background: Since the attacker wanted money, he
hacked the database of a pizza restaurant’s website
by injecting a malcode to acquire customers’
information.) The attacker set up a phishing website
which looked like the real website of the pizza
restaurant. He sent phishing emails to the customers
of the pizza restaurant with the link to the phishing
website, which showed they would receive a
promotion from the restaurant. Customer Bob
received the email, clicked the link and logged into
the fake website to access the promotion. Bob placed
his order and paid for it on the fake website.
He waited for his pizza for a long time but did not
receive it, so he called the restaurant. However, the
restaurant told him they didn’t have any promotions
and that he had been scammed.
The suggested solution for Scenario B and a
participant’s diagram are presented in Figure 7.
Evaluation of a Tool to Increase Cybersecurity Awareness Among Non-experts (SME Employees)
513
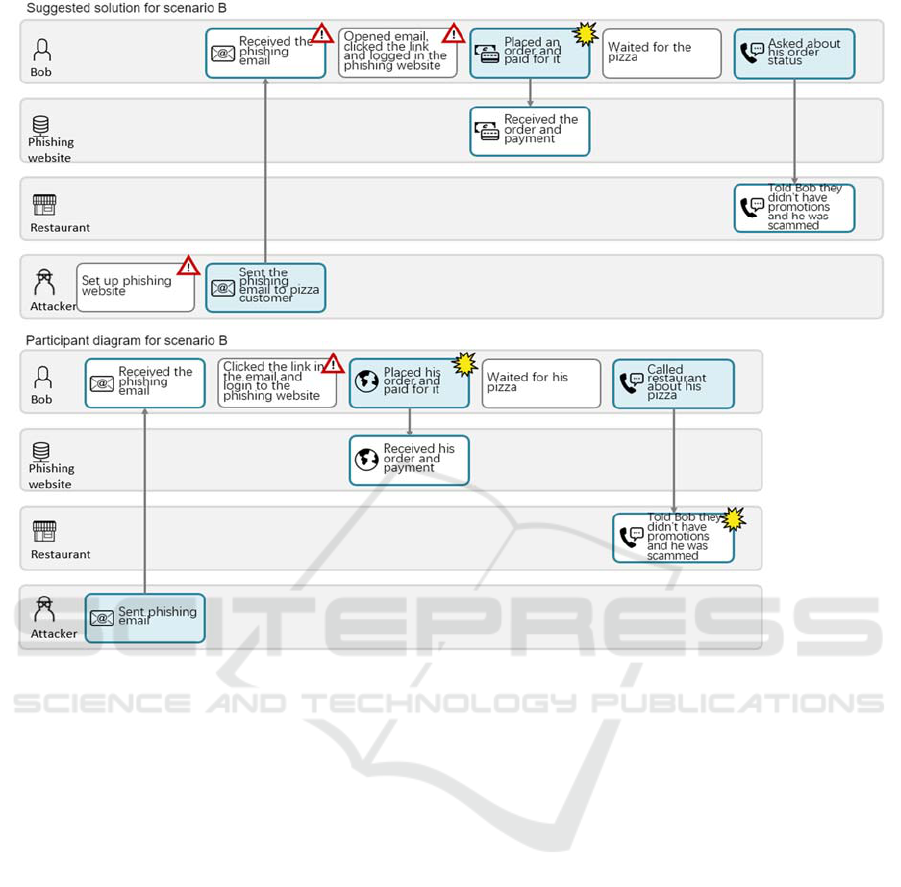
Figure 7: Scenario B: Suggested solution (top) and one participant model (bottom).
5.2.3 Success Criteria
Considering the different levels of understanding for
the scenarios and the limitations of the tool, the
following success criteria (C1–C7) were developed to
evaluate the participants’ modelling efforts:
C1: Identification of Actors: Users should
correctly identify all essential actors in the
provided scenario;
C2: Textual Description of Touchpoints: The
diagram should cover the entire journey. All
essential activities should be described in the
diagram, with no missing touchpoints;
C3: Relevant Touchpoint Actors: All the
touchpoints should have a correct initiating
actor and receiving actor;
C4: Communication Channel: Users should
select the correct communication channel
(communication points only);
C5: Type of Touchpoints: All touchpoints
should be described accurately, with the correct
type, action, or communication point;
C6: Touchpoint Excess: Excess touchpoints
should not appear in the diagram. While a
description of the journey’s background is not
required in the diagram, it is not an ‘excess’
when illustrated in the diagram;
C7: Risk Category: Scenario B only. Users
should mark the correct risk category for all the
touchpoints.
Based on the success criteria, three levels of
conformance can be distinguished:
Basic conformance: Criteria C1–C4 are
fulfilled.
High conformance: Criteria C1–C5 are
fulfilled.
Full conformance: For Scenario A, Criteria
C1–C6 are fulfilled. For Scenario B, Criteria
C1–C7 are fulfilled.
A diagram with basic conformance should include
descriptions of all necessary events and the correct
corresponding actors. It allows users some margin of
error in terms of excess touchpoints or incorrect
identification of touchpoint types. However, each
defined action or communication point should have
the correct description, corresponding actors and a
proper communication channel. In a diagram with
ICISSP 2023 - 9th International Conference on Information Systems Security and Privacy
514
high conformance, all touchpoints should have the
right type, illustration, corresponding actors and an
appropriate channel of communication. Excess
touchpoints are allowed. In a full conformance
diagram, the customer journey should be represented
accurately, and there should be no excess touchpoints.
In Scenario B, the correct risk category is required.
5.2.4 Recruitment
The participants for the usability test were employees
working in SMEs. Participants were recruited from
the CyberKit4SME project’s SME partners, which
was funded by the European Union’s Research and
Innovation Programme. An additional 4 participants
(also SME employees) were recruited by convenience
sampling through personal networks. Recruitment
was conducted by sending an invitation email to the
target participants. The participants could choose if
they preferred the moderated or unmoderated test.
Informed consent was obtained prior to the test.
Overall, a total of ten individuals participated in
the test. The researcher responsible for the
development of the tool acted as the moderator and
facilitated the data collection. The moderated sessions
were recorded for further analysis. The data (scenario
models and questionnaires) were stored and sorted
using a spreadsheet for further analysis.
6 RESULTS
Six of the ten participants chose the 1:1 moderated
test, while the other four selected the unmoderated
test. Seven of the ten participants had little or some
familiarity with CJML before the test. Table 1
summarizes the information about the participants.
Table 1: Key information about the participants.
Method and
K
nowled
g
ePartici
p
ant Number
Test t
yp
e: moderate
d
test P1 - P6
Test type: unmoderate
d
test P7 - P10
Prior knowledge of CJML All except P4, P5, P7
The remote unmoderated test started one day
earlier than the moderated test. The first participant
reported a technical issue regarding exporting the
diagram, which was resolved before the other
participants began the test. During the moderated test,
the participants shared their screens while operating
the tool and making their diagrams. No other
technical issues occurred, and all participants were
able to use the web form and generate the diagram
using the tool. The mean duration of the test was 50
and 60 minutes for the moderated and unmoderated
tests, respectively. A majority of the participants
reported that they regularly communicate directly
with customers in their work. When asked about
previous experience with CJML, only 3 participants
had no prior experience. A majority of participants
had no previous knowledge of cybersecurity.
6.1 Assessment of the Diagrams
A total of 20 CJML diagrams were produced in the
test, 10 for each scenario. All participants were able
to use the tool successfully for both the general
scenario and the threat scenarios.
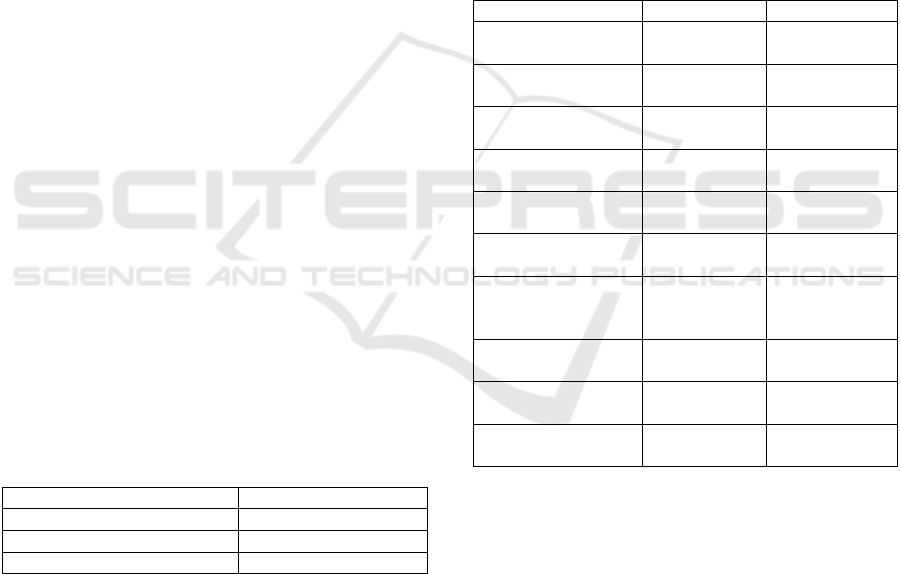
Table 2 summarizes
the key results of the participants’ efforts in relation
to the success criteria defined in Section 5.2.3.
Table 2: Key results from the diagram analysis.
Name Scenario A Scenario B
Identification of
actors
All correct All correct
Text description of
touchpoints
Not P1 All correct
Relevant actors of
touch
p
oints
Not P7 All correct
Communication
channel
All correct All correct
Type of
touchpoints
Not P1, P2,
P5
Not P3, P4,
P6, P7, P9
Touchpoint excess
Not P2, P4,
P8
Not P8, P10
Risk Category -
Not P1, P2,
P6, P7, P8, P9,
P10
Basic conformance
8/10
dia
g
rams
10/10
dia
g
rams
High conformance
6/10
dia
g
rams
5/10 diagrams
Full conformance
4/10
diagrams
1/10 diagrams
In the diagrams for Scenario A (general scenario),
the participants identified all the actors correctly.
Most participants described the touchpoints
appropriately, with one exception in the textual
description and one exception in selecting the correct
actor in a touchpoint. Therefore, eight of the ten
diagrams for Scenario A satisfy the basic
conformance criteria (C1–C4). Six of the ten
diagrams fulfilled criteria C1–C5 and thus achieved
high conformance. Four of the 10 diagrams achieved
the full conformance requirement and can be seen as
“almost perfect”.
In the diagrams for Scenario B (threat scenario),
participants were required to assess the risk categories
(normal, threat and unwanted incidents) of the
Evaluation of a Tool to Increase Cybersecurity Awareness Among Non-experts (SME Employees)
515

scenario. Here, all the diagrams satisfied the basic
conformance criteria. Since half of the participants
made mistakes in identifying the correct touchpoint
type, only five of the ten diagrams achieved a high
conformance level. As the majority of participants
were non-experts in cybersecurity, only one diagram
achieved the full conformance in which the threat and
unwanted incident were correctly identified. This is
illustrated in Figure 7 (bottom), where the participant
marked the wrong threats and an unwanted incident
when describing the threat scenario.
6.2 User Feedback
We asked the participants about their user experience
when using the tool during the Q&A session and also
through the feedback questionnaire. In general, the
tool was well received by the participants. More
specifically, eight of the ten participants found it to be
useful and convenient.
Two participants expressed their preference for
the tool instead of using templates in PowerPoint:
“Being able to make a CJML diagram by filling in a
form is much easier than drawing” and “It is easier to
document and time-saving.” One participant
commented, “It is convenient. I like to use it and
would like to see this tool with more features in the
future.”
All participants in the unmoderated test used the
tool’s built-in user guide before, as well as during, the
test. In contrast, only two participants in the
moderated test referred to the user guide during the
test. All participants who read the user guide stated
that it was helpful and that they could find solutions
to all of their queries within it.
On the critical side, three participants found it
difficult to change the order of the touchpoints and to
get an overview of all the touchpoints in the editing
mode: “The form is too long when there are many
touchpoints.” Furthermore, two participants missed
the option of saving the model and the opportunity to
modify it later. One user missed the option of working
with several models at a time.
7 DISCUSSION
In this section, we discuss differences in the
participants’ performances with regard to their
background knowledge of CJML and the two test
types.
Is there any difference in diagram quality with
regard to the participants’ previous CJML
experience? In terms of the time taken and the quality
of the diagrams, there was no obvious difference
between participants who had a CJML background
and those who did not. As can be seen from the
diagram conformance results in Table 3, the majority
of participants with a CJML background generated
diagrams with high conformance, while only one
participant without a CJML background achieved
high conformance for each scenario. However, no
obvious evidence highlighted the difference between
the participants’ CJML backgrounds when achieving
full conformance.
Table 3: Diagram conformance for scenarios A and B.
Basic
conformance
High
conformance
Full
conformance
A
(8 of 10) P2,
P3, P4, P5,
P6, P8, P9,
P10
(6 of 10) P3,
P4, P6, P8,
P9, P10
(4 of 10) P3,
P6,
P9, P10
B
(10 of 10) P1-
P10
(5 of 10) P1,
P2, P5, P8, P10
(1 of 10) P5
Is there any difference in diagram quality with
regard to the type of test (moderated versus
unmoderated)? There were six moderated test
participants (P1–P6) and four unmoderated test
participants (P7–P10). As discussed previously in
Section 4, a short lecture for moderated test
participants was given to impart basic CJML
knowledge. To ensure unbiased results for the
experiments, we made every effort to ensure that the
content of the lecture was consistent with the content
of the user guide so that unmoderated test participants
could gain all the same basic knowledge over a short
duration as well.
As can be seen from Table 3, the participants from
the unmoderated group performed equally well. For
full conformance, the two groups were also equally
represented. Therefore, it is evident that the diagrams
produced by participants of both test types were of
comparable quality.
7.1 Limitations
The presented approach seems promising, as almost
all participants were able to produce scenarios with
basic conformance in a relatively short time.
Nevertheless, there are several weaknesses in our
work that need further attention:
Small sample size: With only ten users, no
strong conclusions can be drawn regarding the
effect of background knowledge and test type.
Scenario ambiguity: The textual descriptions of
the scenarios were not unambiguous and may
have created confusion. Thus, we gave high
ICISSP 2023 - 9th International Conference on Information Systems Security and Privacy
516

flexibility in describing the customer journey
when analysing the diagrams. For example, the
participant’s diagram in Figure 6 (bottom) can
be seen as full conformance, even though the
first touchpoint is displayed as an action.
Feedback and data collection: The
questionnaire was non-standard and lacked a
systematic and validated schema to produce
scores of usability and usefulness. Furthermore,
the face-to-face Q&A session might have
prevented the participants from expressing
criticism.
8 CONCLUSION
A recent survey among SME employees in the UK
revealed a concerning lack of cybersecurity
awareness, with only 19% offered courses or training
in cybersecurity from their employer (Erdogan et al.,
2023). Taking into account the overall research
question in this paper, we have described how an
industry-relevant tool based on customer journeys
may support an increased awareness of cybersecurity
among non-experts. To develop the tool for threat
scenarios, the concrete and abstract syntax of CJML
was enriched with formalism from the CORAS risk
modelling framework to encompass cybersecurity.
The resulting threat scenarios are based on actors and
touchpoints, thus emphasizing the human element in
a socio-technical setting (RQ1). Our work describes
how the tool was systematically tested with target
users through a controlled experiment focusing on the
preciseness of the models produced by the
participants (RQ2). We have demonstrated that all the
participants achieved basic conformance of their
threat scenarios. While half of them achieved high
conformance, only one participant achieved full
conformance of the threat scenario; however, the
small sample size cannot justify a reliable conclusion.
Nevertheless, the results indicate that this approach to
cybersecurity training for SME employees is
promising and deserves further attention. From the
questionnaire and Q&A sessions, the participants
found the tool useful and convenient (RQ3).
Based on the comments received in the evaluation
stage, the following improvements can be
implemented in future work:
adding drag-and-drop functionality to change
the order of touchpoints and improve the input
form for very long journeys;
adding functionality to import models in XML,
which would represent a save option.
A larger catalogue of threat scenarios with
varying levels of complexity should be developed and
integrated into the tool to better support users in
cybersecurity training.
ACKNOWLEDGEMENTS
This work was funded by the European Union’s
Research and Innovation Programme through the
CyberKit4SME project (Grant Agreement No.
883188.).
REFERENCES
Alhadreti, O. (2022). A comparison of synchronous and
asynchronous remote usability testing methods.
International Journal of Human-Computer Interaction,
38(3), 289–297. https://doi.org/10.1080/10447318.
2021.1938391
Bellamy, R. K., Erickson, T., Fuller, B., Kellogg, W. A.,
Rosenbaum, R., Thomas, J. C., & Wolf, T. V. (2007).
Seeing is believing: Designing visualizations for
managing risk and compliance. IBM Systems Journal,
46(2), 205–218. https://doi.org/10.1147/sj.462.0205
Benz, M., & Chatterjee, D. (2020). Calculated risk? A
cybersecurity evaluation tool for SMEs. Business
Horizons, 63(4), 531–540. https://doi.org/10.1016/
j.bushor.2020.03.010
Boletsis, C., Halvorsrud, R., Pickering, J., Phillips, S., &
Surridge, M. (2021). Cybersecurity for SMEs:
Introducing the human element into socio-technical
cybersecurity risk assessment. Proceedings of the 16th
International Joint Conference on Computer Vision,
Imaging and Computer Graphics Theory and
Applications, 3, 266–274. https://doi.org/10.5220/
0010332902660274
Burzacca, P., & Paternò, F. (2013). Remote usability
evaluation of Mobile Web Applications. In Human-
computer interaction. Human-centred design
approaches, methods, tools, and environments (Vol.
8004, pp. 241–248). Springer Berlin Heidelberg.
https://doi.org/10.1007/978-3-642-39232-0_27
Dray, S., & Siegel, D. (2004). Remote possibilities?
International usability testing at a distance.
Interactions, 11(2), 10–17. https://doi.org/10.1145/
971258.971264
Erdogan, G., Halvorsrud, R., Boletsis, C., Tverdal, S., &
Pickering, J. B. (2023). Cybersecurity Awareness and
Capacities of SMEs. To appear in the proceedings of
the 9th International Conference on Information
Systems Security and Privacy (ICISSP 2023).
Ferronato, P., & Bashir, M. (2020). Does the propensity to
take risks influence human interactions with
autonomous systems? In Advances in human factors in
cybersecurity (Vol. 1219, pp. 23–29). Springer
Evaluation of a Tool to Increase Cybersecurity Awareness Among Non-experts (SME Employees)
517

International Publishing. https://doi.org/10.1007/978-
3-030-52581-1_4
Følstad, A., & Kvale, K. (2018). Customer journeys: A
systematic literature review. Journal of Service Theory
and Practice, 28(2), 196–227. https://doi.org/
10.1108/JSTP-11-2014-0261
Ghafir, Saleem, J., Hammoudeh, M., Faour, H., Prenosil,
V., Jaf, S., Jabbar, S., & Baker, T. (2018). Security
threats to critical infrastructure: the human factor. The
Journal of Supercomputing, 74(10), 4986–5002.
https://doi.org/10.1007/s11227-018-2337-2
Halvorsrud, R., Boletsis, C., & Garcia-Ceja, E. (2021).
Designing a modeling language for customer journeys:
Lessons learned from user involvement. 2021
ACM/IEEE 24th International Conference on Model
Driven Engineering Languages and Systems
(MODELS) (pp. 239–249). Institute of Electrical and
Electronics Engineers. https://hdl.handle.net/11250/
3014760
Halvorsrud, R., Haugstveit, I. M., & Pultier, A. (2016).
Evaluation of a modelling language for customer
journeys. In 2016 IEEE Symposium on Visual
Languages and Human-Centric Computing (VL/HCC),
(pp. 40–48). https://doi.org/10.1109/VLHCC.2016.
7739662
Kullman, K., Buchanan, L., Komlodi, A., & Engel, D.
(2020). Mental model mapping method for
cybersecurity. In Human-Computer Interaction for
Cybersecurity, Privacy and Trust (Vol. 12210, pp. 458–
470). Springer International Publishing. https://
doi.org/10.1007/978-3-030-50309-3_30
Larsen, L. B., Øvad, T., Nielsen, L., & Larusdottir, M.
(2021). Remote user testing: Experiences and trends. In
Human-Computer Interaction – INTERACT 2021 (Vol.
12936, pp. 579–583). Springer International Publishing.
https://doi.org/10.1007/978-3-030-85607-6_81
Lund, M. S., Solhaug, B., & Stølen, K. (2011). Model-
driven risk analysis: The CORAS approach. Springer.
Meshkat, L., Miller, R. L., Hillsgrove, C., & King, J. (2020).
Behavior modeling for cybersecurity. In 2020 Annual
Reliability and Maintainability Symposium (RAMS) (pp.
1–7). Institute of Electrical and Electronics Engineers.
https://doi.org/10.1109/RAMS48030.2020.9153685
Meszaros, J., & Buchalcevova, A. (2017). Introducing
OSSF: A framework for online service cybersecurity
risk management. Computers & Security, 65, 300–313.
https://doi.org/10.1016/j.cose.2016.12.008
Paulsen, C. (2016). Cybersecuring Small Businesses.
Computer, 49(8), 92–97. https://doi.org/10.1109/
MC.2016.223
Ponsard, C., & Grandclaudon, J. (2020). Guidelines and
tool support for building a cybersecurity awareness
program for SMEs. In Communications in Computer
and Information Science (Vol. 1221, pp. 335–357).
Springer International Publishing. https://doi.org/
10.1007/978-3-030-49443-8_16
Shackel, B. (2009). Usability – Context, framework,
definition, design and evaluation. Interacting with
Computers, 21(5–6), 339–346. https://doi.org/10.1016/
j.intcom.2009.04.007
Sharma, T., & Bashir, M. (2020). An analysis of phishing
emails and how the human vulnerabilities are exploited.
In Advances in Human Factors in Cybersecurity (Vol.
1219, pp. 49–55). Springer International Publishing.
https://doi.org/10.1007/978-3-030-52581-1_7
Symantec. (2019). Symantec 2019 internet security threat
report. https://docs.broadcom.com/doc/istr-24-2019- en
Tax, S. S., McCutcheon, D., & Wilkinson, I. F. (2013). The
service delivery network (SDN): A customer-centric
perspective of the customer journey. Journal of Service
Research, 16(4), 454–470. https://doi.org/10.1177/
1094670513481108
The National Center for the Middle Market. (2016).
Cybersecurity and the middle market: The importance of
cybersecurity and how middle market companies
manage cyber risks. https://www.middlemarketcenter.
org/Media/Documents/the-growing-importance-of-
cybersecurity-and-how-middle-market-companies-
manage-cyber-risks_NCMM_Cybersecurity_FINAL.pdf
Tsohou, A., Karyda, M., Kokolakis, S., & Kiountouzis, E.
(2010). Analyzing Information Security Awareness
through Networks of Association. In S. Katsikas, J.
Lopez, & M. Soriano (Eds.), Trust, Privacy and
Security in Digital Business (pp. 227–237). Springer.
https://doi.org/10.1007/978-3-642-15152-1_20
Tueanrat, Y., Papagiannidis, S., & Alamanos, E. (2021).
Going on a journey: A review of the customer journey
literature. Journal of Business Research, 125, 336–353.
https://doi.org/10.1016/j.jbusres.2020.12.028
Vakakis, N., Nikolis, O., Ioannidis, D., Votis, K., &
Tzovaras, D. (2019). Cybersecurity in SMEs: The
smart-home/office use case. 2019 IEEE 24th
International Workshop on Computer Aided Modeling
and Design of Communication Links and Networks
(CAMAD) (pp. 1–7). https://doi.org/10.1109/CAMAD.
2019.8858471
Verizon Business. (2022). 2022 Data Breach Investigations
Report. Retrieved September 19, 2022, from https://
www.verizon.com/business/resources/reports/dbir/
Wever, R., van Kuijk, J., & Boks, C. (2008). User‐centred
design for sustainable behaviour. International Journal
of Sustainable Engineering, 1(1), 9–20. https://
doi.org/10.1080/19397030802166205
ICISSP 2023 - 9th International Conference on Information Systems Security and Privacy
518
