
It’s not Just What You Do but also When You Do It: Novel Perspectives
for Informing Interactive Public Speaking Training
Beatrice Biancardi
1 a
, Yingjie Duan
2
, Mathieu Chollet
3 b
and Chlo
´
e Clavel
2 c
1
LINEACT CESI, Nanterre, France
2
LTCI, T
´
el
´
ecom Paris, IP Paris, Palaiseau, France
3
School of Computing Science, University of Glasgow, Glasgow, U.K.
Keywords:
Affective Computing, Human Communication Dynamics, Social Signals, Public Speaking.
Abstract:
Most of the emerging public speaking training systems, while very promising, leverage temporal-aggregate
features, which do not take into account the structure of the speech. In this paper, we take a different perspec-
tive, testing whether some well-known socio-cognitive theories, like first impressions or primacy and recency
effect, apply in the distinct context of public speaking perception. We investigated the impact of the temporal
location of speech slices (i.e., at the beginning, middle or end) on the perception of confidence and persua-
siveness of speakers giving online movie reviews (the Persuasive Opinion Multimedia dataset). Results show
that, when considering multi-modality, usually the middle part of speech is the most informative. Additional
findings also suggest the interest to leverage local interpretability (by computing SHAP values) to provide
feedback directly, both at a specific time (what speech part?) and for a specific behaviour modality or feature
(what behaviour?). This is a first step towards the design of more explainable and pedagogical interactive
training systems. Such systems could be more efficient by focusing on improving the speaker’s most impor-
tant behaviour during the most important moments of their performance, and by situating feedback at specific
places within the total speech.
1 INTRODUCTION
Soft skills have been identified as key competencies
for work in the 21st century (Sharma and Sharma,
2010). Among them, public speaking constitutes a
real challenge: estimates indicate that 15% to 30% of
the population suffers from public speaking anxiety
(Tillfors and Furmark, 2007).
The automatic evaluation of public speaking per-
formance remains a complex task for which exist-
ing approaches still show some limitations, due to its
subjectivity and the challenges posed by the multi-
modality of human communication. An additional
problem is encountered when automatic evaluations
are used to provide feedback to the user. Indeed,
most of the models used to predict communicative
skills, and more broadly socio-emotional behaviours,
are based on “black box” models (e.g., deep neural
networks), whose opacity makes them ill-suited to
a
https://orcid.org/0000-0002-6664-6117
b
https://orcid.org/0000-0001-9858-6844
c
https://orcid.org/0000-0003-4850-3398
produce explainable feedback to users about their per-
formance. This approach weakens the current poten-
tial of public speaking skills training applications, in
particular by limiting pedagogical explanations.
In this paper, we propose a novel approach to-
wards the aim of facilitating explainability in public
speaking training systems. In particular, we are inter-
ested in whether specific moments during a speaker’s
speech have a different impact on the perception
of their performance. If it is the case, a speaker
should pay more attention at their behaviours dur-
ing these specific moments. In particular, we in-
vestigate whether some well-known effects of socio-
cognitive theories, such as first impressions (Ambady
and Skowronski, 2008) or primacy and recency effect
(Ebbinghaus, 1913), apply in the distinct context of
public speaking.
We aim to answer the following research question:
“Is the impact of speakers’ behaviours on the ob-
server’s perception of their performance different ac-
cording to WHEN these behaviours are realised dur-
ing the speech? If yes, which part of the speech is the
most important?”
Biancardi, B., Duan, Y., Chollet, M. and Clavel, C.
It’s not Just What You Do but also When You Do It: Novel Perspectives for Informing Interactive Public Speaking Training.
DOI: 10.5220/0011680400003417
In Proceedings of the 18th International Joint Conference on Computer Vision, Imaging and Computer Graphics Theory and Applications (VISIGRAPP 2023) - Volume 2: HUCAPP, pages
193-200
ISBN: 978-989-758-634-7; ISSN: 2184-4321
Copyright
c
2023 by SCITEPRESS – Science and Technology Publications, Lda. Under CC license (CC BY-NC-ND 4.0)
193

Automatic assessment of a speaker’s performance
could benefit from this information by assigning dif-
ferent weights to different behaviours considering
when they are realised during the speech. In addition,
a training system could be more efficient by focusing
on improving the speaker’s most important behaviour
during the most important moments of their perfor-
mance, and by situating feedback at specific places
within the total speech.
2 RELATED WORK
2.1 Public Speaking Assessment
Multi-modal modelling of public speaking in differ-
ent contexts has been extensively studied. These con-
texts include job interviews (e.g., (Hemamou et al.,
2019)), student presentations (e.g., (Nguyen et al.,
2012)), academic talks (Curtis et al., 2015) or polit-
ical speech (e.g., (Hirschberg and Rosenberg, 2005)).
The results of these studies highlight that several be-
havioural descriptors can be used as cues of a good
speaking performance. Among them: fundamental
frequency F0, speaking rate, the use of 1st-person
pronouns (Hirschberg and Rosenberg, 2005); motion
energy, tense voice quality, reduced pause timings
(Scherer et al., 2012); flow of speech, vocal variety,
eye contact (Batrinca et al., 2013); overall speaker’s
movement normalised by the head movements (Cur-
tis et al., 2015); vocal expressivity, pitch mean and the
ratio of speech and pauses (W
¨
ortwein et al., 2015).
On the other hand, difluencies have been found to be
negatively correlated with the speaker’s performance
(Strangert and Gustafson, 2008). In general, speech
and lexical features perform better than visual ones,
but multi-modal models achieve the best performance
(Chen et al., 2015; W
¨
ortwein et al., 2015).
The above studies analysed time-aggregated fea-
tures, however a few others explored different ap-
proaches. For example, Ramanarayan et al. (Rama-
narayanan et al., 2015) focused on the temporal evolu-
tion of a speaker’s performance during a presentation,
by including in their analyses time-series features.
Haider et al. (Haider et al., 2020) proposed a novel ac-
tive data representation method to automatically rate
segments of full video presentations, based on un-
supervised clustering. Chollet and Scherer (Chollet
and Scherer, 2017) investigated the use of thin slices
of behaviours (Ambady and Rosenthal, 1992) for as-
sessing public speaking performance. Their results
showed that it is possible to predict ratings of perfor-
mance using audio-visual features of 10-second thin
slices randomly selected from the full video. A sim-
ilar effect was also found in the context of job inter-
views. The analyses in (Hemamou et al., 2021) on
peaks of attention slices (of a duration between 0.5
and 3.3 seconds) during asynchronous job interviews
showed that these slices were systematically different
from random slices. They occured more often at the
beginning and at the end of a response, and were bet-
ter than random slices at predicting hirability.
2.2 Public Speaking Training
In addition to automatically assessing public speaking
quality, several authors also focused on feedback gen-
eration to help speakers improve their performance.
We can divide existing interactive systems accord-
ing to the type of the temporality of the feedback
provided: real-time feedback (e.g., (Damian et al.,
2015; Tanveer et al., 2015; Chollet et al., 2015)) and
after-speech report (e.g., (Zhao et al., 2017)). Real-
time feedback can provide visual information such as
graphs or icons, or can be communicated through the
mean of virtual humans (as coach or virtual audience).
After-speech reports usually include an interface dis-
playing the video of the speaker’s performance along
with personalised feedback information.
2.3 Our Positioning
Temporal Position Matters...
We aim to investigate if the differences in the be-
haviours related to high and low public speaking per-
formance are more discriminative at particular mo-
ments of the speech. Previous studies demonstrated
that it is possible to predict a speaker’s performance
from thin slices randomly selected from a presenta-
tion (Chollet and Scherer, 2017; Nguyen and Gatica-
Perez, 2015), but they did not focus on the location
of these slices. Our general hypothesis is that not
only what happens is important, but when it happens
is important as well. Some previous works suggest
that the moments that are most important in a speech
are the beginning and the end. For example, pri-
macy and recency effect (Ebbinghaus, 1913) is ex-
ploited by politicians as a persuasive strategy in their
speech (e.g.,(Hongwei et al., 2020)). If the primacy
and recency effect applies to our context, the discrim-
ination between high and low performance should be
related to the behaviours occurring at the beginning
and at the end of the speech, while what happens in
the middle should have less impact in the prediction
of a speech quality. Differently, first impressions the-
ory (Ambady and Skowronski, 2008) argues that per-
ceivers form an impression of others at the earliest
instants of an interaction (the earliest instants of the
HUCAPP 2023 - 7th International Conference on Human Computer Interaction Theory and Applications
194

speech in our case), and that this first impression is
hard to modify subsequently. If this theory applies to
our context, we should find a significant impact of the
speakers’ behaviour at the beginning of their speech,
and what happens during the rest of the speech should
have less impact in predicting their performance. Fi-
nally, it could be that what is important for a speaker
is to maintain the listener’s attention during all the
speech. In this case, their behaviour at the middle
of the speech should be more informative about their
performance.
...Also when Giving Feedback
Our goal is to develop a public speaking training sys-
tem, which can offer personalised after-speech reports
providing localised, actionable hints on a variety of
behaviours. If our hypothesis that different parts of
speech vary in their importance is confirmed, then a
feedback system should reflect this in the advice pro-
vided to users. Our main contribution in this paper
is a step towards more explainable and pedagogical
interactive systems. We propose a SHAP-based ap-
proach with the aim to provide feedback in a localised
way and at the modality or feature level using a purely
data-driven method.
3 METHODOLOGY
3.1 The POM Dataset
The Persuasive Opinion Multimedia (POM) dataset
(Park et al., 2014) includes 1000 movie review videos
obtained from a social multimedia website called Ex-
poTV.com. The videos are relatively short (mean du-
ration = 93 ± 31 seconds). Each video contains a
movie review given by one person talking in front of
the camera. Persuasiveness and other high-level at-
tributes and personality traits have been annotated for
each speaker by three raters, on a 7-point Likert scale.
The final value for each dimension is the mean of the
scores given by the three raters.
3.2 Labels
In the studies presented in Section 2, most of the items
used to assess a speaker’s performance are explicitly
related to their verbal and non-verbal behaviours. A
few items are related to the raters’ perception of the
speakers, beyond their behaviour, and mainly concern
the perceived level of confidence and persuasiveness
of the speaker. We focus on these two dimensions
since we are interested in how annotators’ perception
of the speaker is influenced by their behaviours.
As we want to discriminate between performances
in terms of quality, we only consider speakers who
obtained high and low scores of persuasiveness or
confidence. Speakers obtaining persuasiveness scores
higher than 5 are taken as high-persuasiveness speak-
ers, while speakers obtaining persuasiveness scores
lower than 3 are taken as low-persuasiveness ones.
Since confidence ratings are a bit positively skewed,
we consider scores higher than 6 to select high-
confidence speakers, while speakers obtaining confi-
dence scores lower than 3 are taken as low-confidence
ones. The final set used in our study contains
162 high-persuasiveness, 114 low-persuasiveness, 94
high-confidence and 61 low-confidence samples.
3.3 Features
3.3.1 Audio Features
We used openSMILE (Eyben et al., 2010) to extract
88 features from the extended Geneva Minimalistic
Acoustic Parameter Set (eGeMAPS) proposed by Ey-
ben et al. (Eyben et al., 2016). This feature set in-
cludes prosodic, voice quality and some spectral fea-
tures like MFCCs. The default statistical functionals
(e.g., mean, standard deviation) were computed for
each feature. In addition, features related to speech
flow (speech and articulation rates, use of pauses)
were extracted from the aligned transcripts.
3.3.2 Text Features
We counted the number of occurrences of unigrams
and bigrams of the corresponding transcripts. We
used lemmas of words extracted by the lemmatizer
nltk (Bird et al., 2009) for unigrams and bigrams and
selected unigrams and bigrams occurring more than
100 times in the corpus. We used spaCy
1
to extract
POS of each word and selected unigrams, bigrams
and trigrams occurring more than 20 times. We also
extracted 93 features of Linguistic Inquiry and Word
Count (LIWC) (Pennebaker et al., 2015).
3.3.3 Visual Features
We used OpenFace 2.2 (Baltrusaitis et al., 2018) to
extract Action Units (AU) related features of both
presence and intensity (see Table 1 for more details),
as well as head pose features.
3.3.4 Feature Groups
The features described above were grouped according
to their modality (i.e., text, audio or visual) and also
1
https://github.com/explosion/spaCy
It’s not Just What You Do but also When You Do It: Novel Perspectives for Informing Interactive Public Speaking Training
195

Table 1: The features computed for our study, belonging to three modalities: audio, text and visual.
Audio
eGeMAPS contains 88 features:
prosodic features: pitch, loudness etc.
voice quality features: formant, jitter, shimmer etc.
spectral features: MFCC 1-4, spectral flux etc.
Flow of Speech:
speech rate words=
nWords+nPauses
10
art rate words=
nWords
10−durationPauses
pause rate=
nPauses
10
pause ratio =
nPauses
nWords
pause mean dur=
durationPauses
nPauses
pause perc=
durationPauses
10
Text
LIWC contains 93 features:
Syntactic related: Ppron, Verb categories etc.
Lexical related: Social, Work categories etc.
Count of N-gram contains 606 features
uni-grams and bi-grams of lemmas occurring >100 times
Count of POS N-gram contains 1310 features
uni-grams, bi-grams and tri-grams of POS occurring >20 times
Visual
Presence of AU:
duration= sum(AU)
episodes= #separate episodes
average=
duration
episodes
Intensity of AU:
int mean, int sd, int range (int
min
−int
max
−)
int
′
mean, int
′
sd, int
′
range (int
′
min−
int
′
max
)
Head Pose
Count of Nod: number of peaks and valleys of pose Rx
Count of Shake: number of peaks and valleys of pose Ry
Count of Tilt: number of peaks and valleys of pose Rz
Table 2: Feature Groups and Corresponding Features.
Lexical count of n-gram and lexical related categories in LIWC
Syntactic count of POS n-gram and syntactic related categories in LIWC
Prosody prosodic features in enGeMAPS and features of flow of speech
Voice Quality voice quality features in eGeMAPS
Spectral spectral features in eGeMAPS
Facial Expression features of presence of AU and features of intensity of AU
Head Pose features of head pose
combined in multi-modal groups (i.e., audio+text, au-
dio+visual, text+visual). In addition, when comput-
ing the SHAP values (see Section 4.2.2), we also cat-
egorised the features in higher-level groups. For au-
dio features, we considered three groups: Prosody,
Voice Quality and Spectral. For text features, we di-
vided them into Lexical and Syntactic. For visual
features, we categorised them into Facial Expressions
and Head Poses. All the groups and corresponding
features are listed in Table 2.
4 EXPERIMENTS AND RESULTS
4.1 Experimental Setting
4.1.1 Slices Datasets
To address our research question, we used thin slices
to investigate the effect of different moments of the
speech on the perception of the speaker. In line with
previous work (e.g., (Chollet and Scherer, 2017)) we
fixed the duration of the windows to 10 seconds. For
each video, we extracted the following windows: start
(the first 10s), middle (a 10s window randomly se-
lected from any moment after the first 30s and before
the last 30s of the video) and end (the last 10s). These
slices were grouped in three new datasets: start-
dataset, middle-dataset and end-dataset according to
which part each slice belongs to.
4.1.2 Classification Models
The aim of this paper is not to obtain state-of-the-art
performance in classification accuracy, but rather to
provide insights about the importance of the various
speech parts and the relative contributions of differ-
ent modalities to each of these parts. Accordingly, we
chose Support Vector Machine (SVM) as the base-
line model to perform the following experiments. We
applied feature selection methods to select the most
important and relevant features, to reduce the redun-
dant ones and improve the performance of the model.
Similar to the method used in (Nojavanasghari et al.,
2016), we performed a z-test between the features
extracted from high and low performance instances,
then select features with p< 0.05.
HUCAPP 2023 - 7th International Conference on Human Computer Interaction Theory and Applications
196

Multi-modal features were generated through
early fusion.As for the hyperparameters of the model
(C and γ), we selected the best combination from lists
of values (the value of C varies in [1, 10, 20] and the
value of γ varies in [0.001, 0.01, 0.1, 1,’auto’]) using
5-fold cross validation.
For each slices dataset (i.e., start-dataset, middle-
dataset and end-dataset) as well for the original
dataset of the full videos, we took 80% as the training
set and the rest as the test set. We trained models on
a binary classification task (high and low confidence
or persuasiveness) by using features from a single
modality or combined features from different modali-
ties, and looked at the F1-scores (because our datasets
are imbalanced, see Section 3.2). Due to the relatively
small size of our dataset, the F1-score varies when we
use different random seeds to split the dataset. There-
fore, we sampled the F1-score 300 times using differ-
ent random seeds and calculated its 95% confidence
interval. The results are shown in Tables 3 and 4.
4.2 Results
4.2.1 Thin Slices vs Full Video
In Tables 3 and 4, we report F1-scores on confidence
and persuasiveness for different modalities and differ-
ent slices of the video. In both tables, we can notice
that the F1-scores vary across the different feature sets
and the considered slices.
The results show that using the full video leads to
a higher performance compared to the slices, in most
of the cases (audio, text, audio+visual and text+visual
for confidence ratings; audio, text, visual and au-
dio+visual for persuasiveness).
What is interesting is that, for both confidence
and persuasiveness, the best performance is obtained
when considering the middle slice (for audio+text
and all modalities and audio+text, text+visual and all
modalities, respectively). In particular, the best abso-
lute score for both confidence and persuasiveness pre-
diction is obtained when considering audio+text fea-
tures in the middle slice.
4.2.2 Temporal Location of Behaviours
With eXplainable Artificial Intelligence (XAI) devel-
oping rapidly in recent years, many excellent tools
have emerged to help us interpret our models. Among
them, SHAP (Shapley Additive Explanations), pro-
posed by (Lundberg and Lee, 2017), is used to ex-
plain the output of any machine learning model, by
showing how much each feature or group of features,
contribute, either positively or negatively, to the tar-
get variable. The SHAP analysis on the different be-
havioural features can give us more details about how
each behaviour is informative and when. In Figures
1 and 2, the mean absolute SHAP values of (a) be-
haviour modalities and (b) feature groups (see Table
2 for more details) are provided, relative to the mod-
els predicting confidence (Figure 1) or persuasiveness
(Figure 2) quality. From these Figures, we can see
that, even if in general text modality is the most infor-
mative for the models (see Figures 1a and 2a), we can
notice some variations across the speech moments.
For example, syntactic features are more informative
to predict the speaker’s confidence during the middle
slice compared to the other moments of the speech
(Figure 1b).
5 DISCUSSION
The results from Tables 3 and 4 show that in general
using the entire video allows for a better performance
when predicting public speaking quality, compared to
specific thin slices. This is consistent with previous
results in (Chollet and Scherer, 2017; Nguyen and
Gatica-Perez, 2015), where it was observed that for
confidence, using full video still performs better than
just using thin slices.
We remind that the focus of this work is not on
the use of thin slices in general but rather on the im-
pact of the temporal position of these slices. Our aim
is to analyse public speaking under the perspective of
socio-cognitive theories such as primacy and recency
effect or first impressions. Under this point of view,
there are some results worth being discussed. In par-
ticular, the best absolute performance of the models
was obtained when looking at the middle slice of the
speech. This could indicate that what is important for
a speaker is to maintain the audience’s attention and
interest also after a first impression is formed. These
results are in contrast with previous findings, for ex-
ample in (Hemamou et al., 2019) it was found that
slices at the beginning and end of a speech performed
better than random slices in predicting a speaker’s
hirability. The used methods and dataset are differ-
ent from ours, thus more investigations are required
to compare these findings.
Beyond the results specific to our research ques-
tion, we can notice a slightly lower performance
when predicting persuasiveness level compared to
confidence. This could be explained by the lower
inter-raters agreement for persuasiveness ((Park et al.,
2014)) and confirms that these dimensions, even if
correlated, represent different aspects of the speaker’s
performance, e.g., persuasiveness is more related to
dominance than confidence (Burgoon et al., 2002).
It’s not Just What You Do but also When You Do It: Novel Perspectives for Informing Interactive Public Speaking Training
197
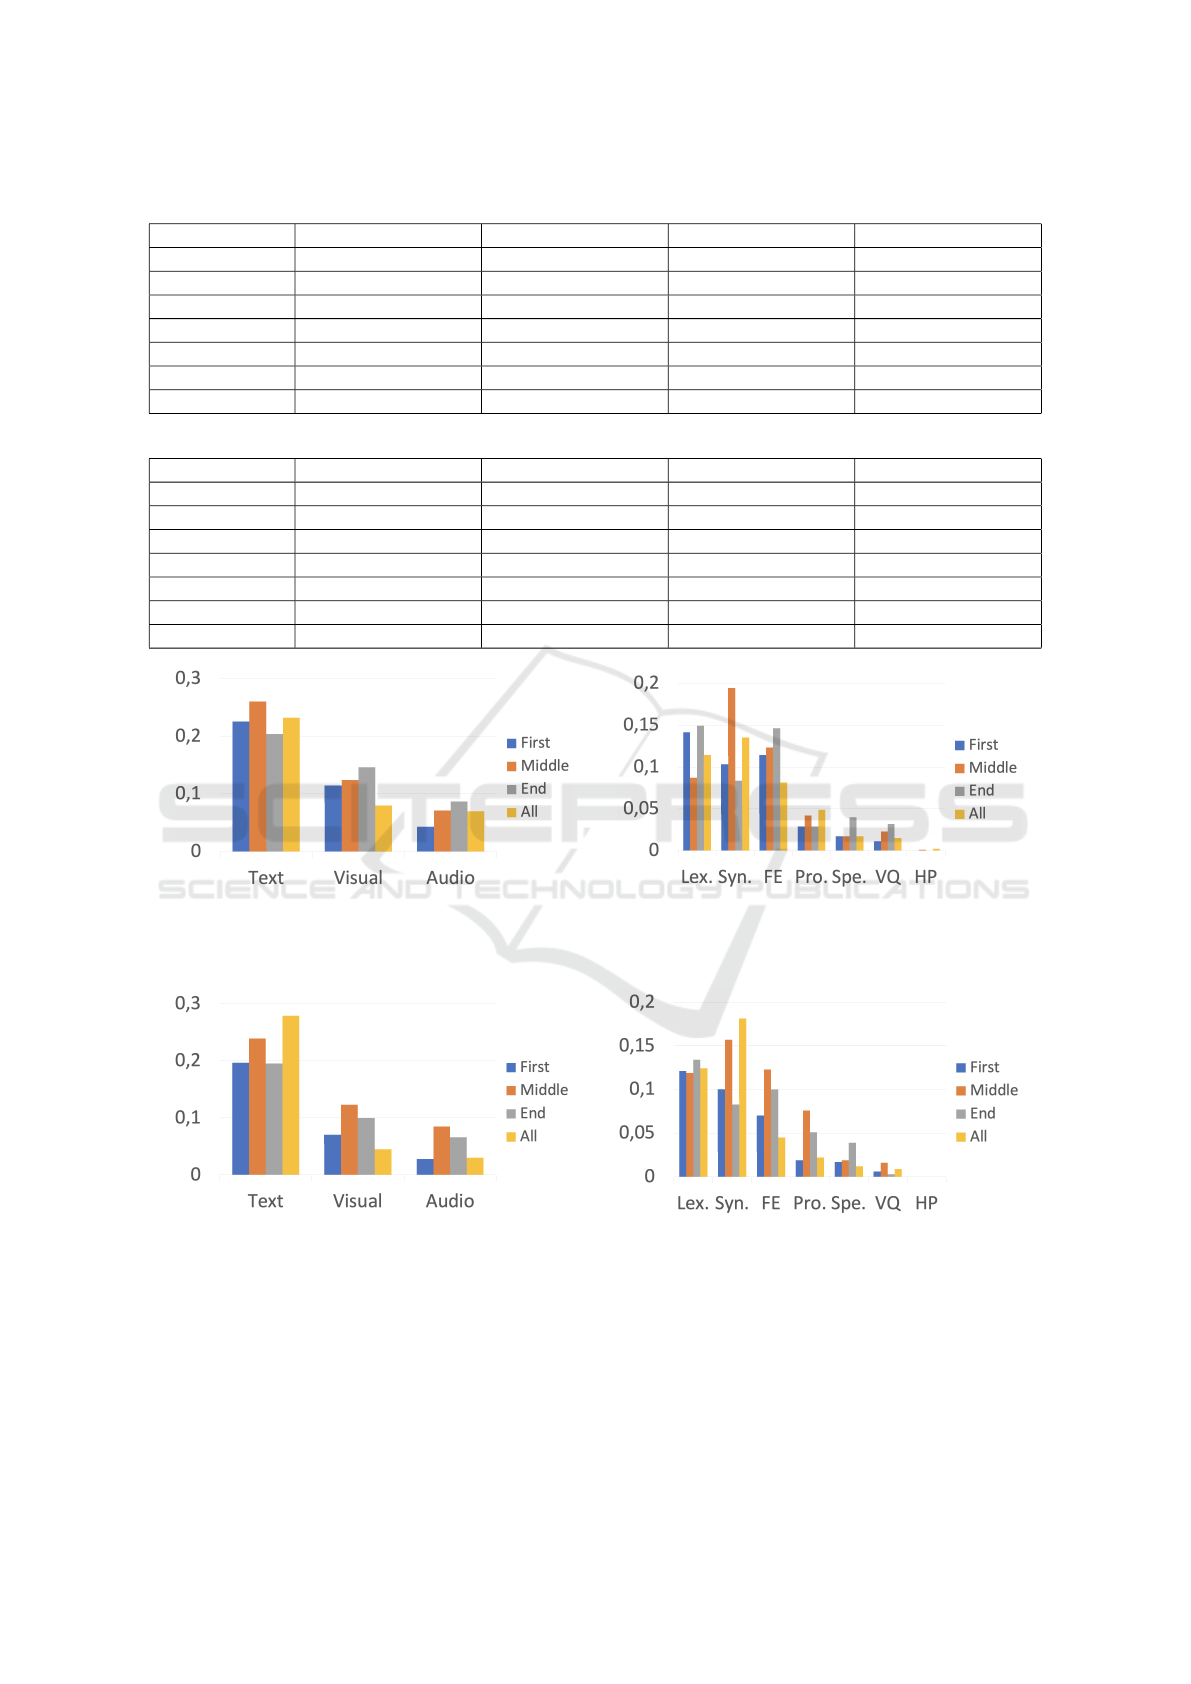
Table 3: The prediction F1-scores of confidence for different features sets of different slices.
Confidence Start Middle End Full
Audio 0.738 (0.729, 0.747) 0.761 (0.753, 0.768) 0.707 (0.699, 0.715) 0.804 (0.797, 0.812)
Text 0.835 (0.828, 0.842) 0.882 (0.876, 0.888) 0.794 (0.786, 0.801) 0.884 (0.878, 0.890)
Visual 0.746 (0.739, 0.753) 0.741 (0.733, 0.748) 0.746 (0.739, 0.753) 0.740 (0.733, 0.748)
Audio + Text 0.852 (0.845, 0.859) 0.906 (0.901, 0.912) 0.827 (0.820, 0.834) 0.896 (0.890, 0.901)
Audio + Visual 0.782 (0.774, 0.790) 0.799 (0.792, 0.807) 0.802 (0.795, 0.810) 0.839 (0.833, 0.846)
Text + Visual 0.865 (0.859, 0.871) 0.888 (0.882, 0.894) 0.880 (0.874, 0.886) 0.889 (0.884, 0.895)
All 0.871 (0.865, 0.918) 0.900 (0.895, 0.906) 0.889 (0.884, 0.895) 0.893 (0.887, 0.898)
Table 4: The prediction F1-score of persuasiveness for different features sets of different slices.
Persuasiveness Start Middle End Full
Audio 0.617 (0.611, 0.623) 0.601 (0.595, 0.608) 0.624 (0.618, 0.631) 0.702 (0.696, 0.709)
Text 0.733 (0.728, 0.739) 0.787 (0.782, 0.792) 0.727 (0.721, 0.733) 0.800 (0.795, 0.805)
Visual 0.619 (0.613, 0.624) 0.619 (0.613, 0.624) 0.619 (0.613, 0.624) 0.622 (0.616, 0.628)
Audio + Text 0.741 (0.736, 0.747) 0.832 (0.827, 0.837) 0.737 (0.731, 0.742) 0.812 (0.807, 0.817)
Audio + Visual 0.641 (0.635, 0.648) 0.630 (0.623, 0.636) 0.653 (0.647, 0.659) 0.688 (0.682, 0.694)
Text + Visual 0.763 (0.757, 0.768) 0.831 (0.826, 0.836) 0.782 (0.776, 0.787) 0.802 (0.798, 0.807)
All 0.765 (0.760, 0.770) 0.828 (0.823, 0.833) 0.794 (0.788, 0.780) 0.812 (0.807, 0.817)
(a) Mean absolute SHAP values of modalities. (b) Mean absolute SHAP values of feature groups.
Figure 1: Mean absolute SHAP values of (a) behaviour modalities and (b) feature groups, relative to the models prediction
confidence quality using the different slices (beginning, middle or end) or the entire video (Lex.: lexical, Syn.: syntactic, FE:
facial expression, Pro.: prosody, Spe.: spectral, VQ: voice quality, HP: head pose).
(a) Mean absolute SHAP values of modalities. (b) Mean absolute SHAP values of feature groups.
Figure 2: Mean absolute SHAP values of (a) behaviour modalities and (b) feature groups, relative to the models predicting
persuasiveness quality using the different slices (beginning, middle or end) or the entire video (Lex.: lexical, Syn.: syntactic,
FE: facial expression, Pro.: prosody, Spe.: spectral, VQ: voice quality, HP: head pose).
In addition, once again in line with results from
(Park et al., 2014), and other previous works (Chen
et al., 2015; W
¨
ortwein et al., 2015) using uni-modal
visual features got the lowest performance for both
confidence (Table 3) and persuasiveness (Table 4)
prediction. This could suggest that in public speak-
ing assessment the non-verbal behaviours need to be
contextualised according to what and how is said (i.e.,
in combination with text and audio modalities).
The results shown in Figures 1 and 2 also sug-
HUCAPP 2023 - 7th International Conference on Human Computer Interaction Theory and Applications
198

gest the interest to leverage local interpretability of
the SHAP-based approach to provide feedback di-
rectly, both at a specific time (what speech part?)
and for a specific behaviour modality or feature (what
behaviour?). Endowing training interactive systems
with this information would allow them to provide
more adapted and hopefully more useful feedback to
speaker trainees. This could take the form of a report
highlighting the different feature groups and associ-
ated behaviours that contributed positively and nega-
tively to a specific assessment.
The main limitation of our study is that the results
we obtained could be related to the particular charac-
teristics of POM dataset. The duration of the videos
is relatively short (93± 31 seconds) and the content of
the speech very specific (movie reviews). In the case
of longer videos, such as TED Talks
2
) for instance,
other moments of the speech could be more discrimi-
native. However, the findings of the present study still
support the hypothesis that the impact of a speaker’s
behaviour on the perception of their performance is
different according to when these behaviours are re-
alised during the speech, and this should be taken into
account by public speaking training systems. Further
investigations could elucidate whether what happens
in the middle part of the speech is still important in
different contexts or whether first impressions or pri-
macy and recency effect apply in those cases.
6 CONCLUSION
In this paper, we proposed a novel perspective to anal-
yse public speaking performance. In order to facilitate
explainability of the assessment of a speaker’s perfor-
mance and in turns provide more pedagogical training
system, we investigated the impact of the temporal
location of speech slices on the perception of confi-
dence and persuasiveness of the speaker. We found
that, when considering multi-modality, usually the
middle part of speech is the most informative. In or-
der to use model-learned knowledge to give feedback,
we discussed a SHAP-based feedback approach, with
the aim to provide feedback in a localised way and
at the modality or feature level using a purely data-
driven method.
This is a first step towards the design of more
explainable and pedagogical interactive training sys-
tems. Such systems could be more efficient by fo-
cusing on improving the speaker’s most important be-
haviour during the most important moments of their
performance, and by situating feedback at specific
2
https://www.ted.com/
places within the total speech. In future work, we
plan to apply the same perspective by implementing
more powerful models such as attention-based neu-
ral models and validate our results on larger datasets.
We are also interested in whether the results also hold
for longer speeches, since observer attention may vary
differently.
ACKNOWLEDGEMENTS
This work was partially funded by the Carnot in-
stitutes TSN and M.I.N.E.S. under the InterCarnot
contract 200000830 AI4SoftSkills and the ANR-21-
CE33-0016-02 REVITALISE project.
REFERENCES
Ambady, N. and Rosenthal, R. (1992). Thin slices of ex-
pressive behavior as predictors of interpersonal con-
sequences: A meta-analysis. Psychological bulletin,
111(2):256.
Ambady, N. and Skowronski, J. J. (2008). First impressions.
Guilford Press.
Baltrusaitis, T., Zadeh, A., Lim, Y. C., and Morency, L.-
P. (2018). Openface 2.0: Facial behavior analysis
toolkit. In 2018 13th IEEE International Conference
on Automatic Face Gesture Recognition (FG 2018),
pages 59–66.
Batrinca, L., Stratou, G., Shapiro, A., Morency, L.-P., and
Scherer, S. (2013). Cicero-towards a multimodal vir-
tual audience platform for public speaking training. In
International workshop on intelligent virtual agents,
pages 116–128. Springer.
Bird, S., Klein, E., and Loper, E. (2009). Natural language
processing with Python: analyzing text with the natu-
ral language toolkit. ” O’Reilly Media, Inc.”.
Burgoon, J. K., Dunbar, N. E., and Segrin, C. (2002). Non-
verbal influence. The persuasion handbook: Develop-
ments in theory and practice, pages 445–473.
Chen, L., Leong, C. W., Feng, G., Lee, C. M., and Soma-
sundaran, S. (2015). Utilizing multimodal cues to au-
tomatically evaluate public speaking performance. In
2015 International Conference on Affective Comput-
ing and Intelligent Interaction (ACII), pages 394–400.
IEEE.
Chollet, M. and Scherer, S. (2017). Assessing public speak-
ing ability from thin slices of behavior. In 2017 12th
IEEE International Conference on Automatic Face
& Gesture Recognition (FG 2017), pages 310–316.
IEEE.
Chollet, M., W
¨
ortwein, T., Morency, L.-P., Shapiro, A., and
Scherer, S. (2015). Exploring feedback strategies to
improve public speaking: an interactive virtual audi-
ence framework. In Proceedings of the 2015 ACM In-
ternational Joint Conference on Pervasive and Ubiq-
uitous Computing, pages 1143–1154.
It’s not Just What You Do but also When You Do It: Novel Perspectives for Informing Interactive Public Speaking Training
199

Curtis, K., Jones, G. J., and Campbell, N. (2015). Effects of
good speaking techniques on audience engagement. In
Proceedings of the 2015 ACM on International Con-
ference on Multimodal Interaction, pages 35–42.
Damian, I., Tan, C. S., Baur, T., Sch
¨
oning, J., Luyten, K.,
and Andr
´
e, E. (2015). Augmenting social interac-
tions: Realtime behavioural feedback using social sig-
nal processing techniques. In Proceedings of the 33rd
annual ACM conference on Human factors in comput-
ing systems, pages 565–574.
Ebbinghaus, H. (1913). Memory: a contribution to exper-
imental psychology. 1885. New York: Teachers Col-
lege, Columbia University.
Eyben, F., Scherer, K. R., Schuller, B. W., Sundberg,
J., Andr
´
e, E., Busso, C., Devillers, L. Y., Epps, J.,
Laukka, P., Narayanan, S. S., and Truong, K. P.
(2016). The geneva minimalistic acoustic parameter
set (gemaps) for voice research and affective com-
puting. IEEE Transactions on Affective Computing,
7(2):190–202.
Eyben, F., W
¨
ollmer, M., and Schuller, B. (2010). Opens-
mile: the munich versatile and fast open-source au-
dio feature extractor. In Proceedings of the 18th ACM
international conference on Multimedia, pages 1459–
1462.
Haider, F., Koutsombogera, M., Conlan, O., Vogel, C.,
Campbell, N., and Luz, S. (2020). An active data
representation of videos for automatic scoring of oral
presentation delivery skills and feedback generation.
Frontiers in Computer Science, 2:1.
Hemamou, L., Felhi, G., Vandenbussche, V., Martin, J.-C.,
and Clavel, C. (2019). Hirenet: A hierarchical atten-
tion model for the automatic analysis of asynchronous
video job interviews. In Proceedings of the AAAI Con-
ference on Artificial Intelligence, volume 33, pages
573–581.
Hemamou, L., Guillon, A., Martin, J.-C., and Clavel, C.
(2021). Multimodal hierarchical attention neural net-
work: Looking for candidates behaviour which impact
recruiter’s decision. IEEE Transactions on Affective
Computing.
Hirschberg, J. B. and Rosenberg, A. (2005). Acous-
tic/prosodic and lexical correlates of charismatic
speech.
Hongwei, Z. et al. (2020). Analysis of the persuasive meth-
ods in barack obama’s speeches from the social psy-
chology’s perspectives. The Frontiers of Society, Sci-
ence and Technology, 2(10).
Lundberg, S. M. and Lee, S.-I. (2017). A unified approach
to interpreting model predictions. Advances in neural
information processing systems, 30.
Nguyen, A.-T., Chen, W., and Rauterberg, M. (2012). On-
line feedback system for public speakers. In 2012
IEEE Symposium on E-Learning, E-Management and
E-Services, pages 1–5. IEEE.
Nguyen, L. S. and Gatica-Perez, D. (2015). I would hire you
in a minute: Thin slices of nonverbal behavior in job
interviews. In Proceedings of the 2015 ACM on inter-
national conference on multimodal interaction, pages
51–58.
Nojavanasghari, B., Gopinath, D., Koushik, J., Baltru
ˇ
saitis,
T., and Morency, L.-P. (2016). Deep multimodal fu-
sion for persuasiveness prediction. In Proceedings
of the 18th ACM International Conference on Multi-
modal Interaction, pages 284–288.
Park, S., Shim, H. S., Chatterjee, M., Sagae, K., and
Morency, L.-P. (2014). Computational analysis of per-
suasiveness in social multimedia: A novel dataset and
multimodal prediction approach. In Proceedings of
the 16th International Conference on Multimodal In-
teraction, pages 50–57.
Pennebaker, J. W., Boyd, R. L., Jordan, K., and Blackburn,
K. (2015). The development and psychometric prop-
erties of liwc2015. Technical report.
Ramanarayanan, V., Leong, C. W., Chen, L., Feng, G., and
Suendermann-Oeft, D. (2015). Evaluating speech,
face, emotion and body movement time-series fea-
tures for automated multimodal presentation scoring.
In Proceedings of the 2015 ACM on International
Conference on Multimodal Interaction, pages 23–30.
Scherer, S., Layher, G., Kane, J., Neumann, H., and Camp-
bell, N. (2012). An audiovisual political speech analy-
sis incorporating eye-tracking and perception data. In
LREC, pages 1114–1120.
Sharma, G. and Sharma, P. (2010). Importance of soft skills
development in 21st century curriculum. International
Journal of Education & Allied Sciences, 2(2).
Strangert, E. and Gustafson, J. (2008). What makes a good
speaker? subject ratings, acoustic measurements and
perceptual evaluations. In Ninth Annual Conference of
the International Speech Communication Association.
Tanveer, M. I., Lin, E., and Hoque, M. (2015). Rhema:
A real-time in-situ intelligent interface to help people
with public speaking. In Proceedings of the 20th in-
ternational conference on intelligent user interfaces,
pages 286–295.
Tillfors, M. and Furmark, T. (2007). Social phobia in
swedish university students: prevalence, subgroups
and avoidant behavior. Social psychiatry and psychi-
atric epidemiology, 42(1):79–86.
W
¨
ortwein, T., Chollet, M., Schauerte, B., Morency, L.-P.,
Stiefelhagen, R., and Scherer, S. (2015). Multimodal
public speaking performance assessment. In Proceed-
ings of the 2015 ACM on International Conference on
Multimodal Interaction, pages 43–50.
Zhao, R., Li, V., Barbosa, H., Ghoshal, G., and Hoque,
M. E. (2017). Semi-automated and collaborative on-
line training module for improving communication
skills. Proceedings of the ACM on Interactive, Mobile,
Wearable and Ubiquitous Technologies, 1(2):1–20.
HUCAPP 2023 - 7th International Conference on Human Computer Interaction Theory and Applications
200
