
A Question of Trust: Old and New Metrics for the Reliable Assessment of
Trustworthy AI
Andrea Campagner
1,∗
, Riccardo Angius
2
and Federico Cabitza
1,3
1
IRCCS Ospedale Galeazzi - Sant’Ambrogio, Milan, Italy
2
University of Padova, Padua, Italy
3
Department of Computer Science, Systems and Communication, University of Milano-Bicocca, Milan, Italy
∗
Keywords:
Medical Machine Learning, Validation, Trustworthy AI, Reliability, Assessment.
Abstract:
This work contributes to the evaluation of the quality of decision support systems constructed with Machine
Learning (ML) techniques in Medical Artificial Intelligence (MAI). In particular, we propose and discuss
metrics that complement and go beyond traditional assessment practices based on the evaluation of accuracy,
by focusing on two different dimensions related to the trustworthiness of a MAI system: reputation/ability,
which relates to the accuracy or predictive ability of the system itself; and expertise/source reliability, which
relates instead to the trustworthiness of the data which have been used to construct the MAI system. Then, we
will discuss some previous, but so far mostly neglected, proposals as well novel metrics, visualizations and
procedures for the sound evaluation of a MAI system’s trustworthiness, by focusing on six different concepts:
advice accuracy, advice reliability, pragmatic utility, advice value, decision benefit and potential robustness.
Finally, we will illustrate the application of the proposed concepts through two realistic medical case studies.
1 INTRODUCTION
This work contributes to the evaluation of the qual-
ity of decision support systems constructed with Ma-
chine Learning (ML) techniques, especially in the
broad sector of Medical Artificial Intelligence (MAI).
We start from the assumption that the quality of a de-
cision support is somehow associated with its trust-
worthiness (and, notably, vice versa). As a result, we
start with a broad question: “When can we call deci-
sion support trustworthy?”.
Starting from a similar question, the
OECD (OECD Network of Experts on AI, 2020) has
recently begun a methodological work to frame this
concept; the assigned OECD Network of Experts
on AI has thus proposed to see trustworthiness as
an emerging property of systems that are “ fair,
transparent, explainable, robust, secure and safe”.
From this, a natural sequitur would be to define
and operationalize (that is to make measurable) the
related concepts of fairness, explainability, robust-
ness, security and safety. This is an ambitious and
far-reaching objective, which informs the current
debate on how to regulate AI (and particularly so
in the current drafting process of the EU AI Act).
However, doing so also seems to put the very concept
of trust in the background. In this contribution,
we aim to propose a complementary approach that
instead grounds on the concept of Trust in Automa-
tion (TiA) (Kohn et al., 2021) and proposes some
better metrics for understanding how well users (i.e.,
trustors) do in placing trust in a system (machine
trustee) which exhibits certain characteristics.
In this light and within the ambit of technolog-
ical decision support, we have to acknowledge that
trustors trust advisors as their trustees, and hence they
are willing to rely on the trustees’ advice, for a large
number of reasons. We ground on some of the most
widely-cited and influential models (Mayer et al.,
1995; Lee and See, 2004; Hoff and Bashir, 2015)
to mention the following determinants of trust (see
also (Kohn et al., 2021)): if the trustees are consid-
ered benevolent and upright, that is trustors are confi-
dent the trustees would give them the right advice, or
the better one, whenever they can; if the trustees’ rep-
utation is good, especially with respect to their com-
petence and skills (this related to the concept of ex-
pertise); if trustors believe the trustees’ sources are
reliable (this is related to the concept of reliability); in
case the trustors are experts themselves, if these gen-
erally agree with the trustees’ recommendations, or
at least, they consider the trustees’ recommendations
132
Campagner, A., Angius, R. and Cabitza, F.
A Question of Trust: Old and New Metrics for the Reliable Assessment of Trustworthy AI.
DOI: 10.5220/0011679600003414
In Proceedings of the 16th International Joint Conference on Biomedical Engineering Systems and Technologies (BIOSTEC 2023) - Volume 5: HEALTHINF, pages 132-143
ISBN: 978-989-758-631-6; ISSN: 2184-4305
Copyright
c
2023 by SCITEPRESS – Science and Technology Publications, Lda. Under CC license (CC BY-NC-ND 4.0)

generally plausible (this relates to the concept of plau-
sibility); even more simply put, if trustees convince
the trustors that they are right and trustworthy (this
relates with the concept of persuasiveness). In an at-
tempt to systematize the above occurrences, Mayer et
al. (Mayer et al., 1995) identified three main factors of
trustworthiness in terms of ability, benevolence, and
integrity; subsequently, Lee et al. (Lee and See, 2004)
formulated what Kohn et al. (Kohn et al., 2021) have
recently denoted as an “automation-friendly transla-
tion” of these three factors in terms of performance
(i.e., how well the automation performs); process
(i.e., in what manner and with which algorithms the
automation objective is achieved); and purpose (i.e.,
why the automation was built originally).
According to these proposals, with the exception
of the factors of benevolence, integrity and purpose,
which relate to moral characteristics of the suppliers
or vendors of MAI systems rather than to the compu-
tational systems themselves, the other concepts men-
tioned above have clear and intuitive counterparts in
the AI and MAI domain: reputation and ability relates
to reported measures of classification performance
and utility; these, in their turn, are usually estimated
by observing metrics that ground on error rate and are
applied to a sample of known cases; plausibility re-
lates to human-machine concordance, or on the agree-
ment rate between machines and experts; and the ad-
visor’s expertise relates to what one of the founders of
ML evocatively referred to as the ML system’s expe-
rience. In what follows we will then propose metrics
that operationalize trustworthiness in terms of repu-
tation/ability and expertise/reliability of the sources.
Reputation/ability is usually related to (known) accu-
racy. Little wonder then that accuracy is one qual-
ity dimension for which the literature is replete with
metrics, techniques and methods. However, despite
this wealth and variability of methods, or precisely
in view of this potential dispersion, in this contribu-
tion we aim to discuss alternative and complemen-
tary metrics to those that are usually applied and re-
ported. Indeed, we believe that some less known met-
rics address broader assessment needs than traditional
metrics and can more fully represent the capabilities
of decision-support systems. Also, the reliability of
the trustee’s sources, which in the ML settings re-
lates to the reliability of the data that has been used to
feed, construct and validate a ML model, must have
a stronger attention for the assessment of trustworthi-
ness. We will then consider: source reliability, ad-
vice accuracy, pragmatic utility, advice value, advi-
sory value, decision benefit, and potential robustness.
These concepts will be introduced with short de-
scriptions and simple analytical formulations, so that
each dimension above will be associated with corre-
sponding indicators and scores; moreover, in regard to
decision benefit and potential robustness, we will also
discuss two novel data visualizations that are aimed at
allowing a qualitative assessment of the related high-
level concepts. We will then illustrate how to apply
these metrics and diagrams to a number of case stud-
ies. These case studies will allow us to argue in favor
of these metrics for the comprehensive assessment of
the quality and “reputation” of a computational deci-
sion aid, in the sense presented above.
2 METHODS
In this section, we will discuss different metrics
and processes for the evaluation of ML systems in
medicine, focusing on 6 different above mentioned
dimensions: source reliability, advice accuracy, prag-
matic utility, advice value, decision benefit and poten-
tial robustness.
2.1 Source Reliability
As mentioned in the introduction, the trustworthiness
of a MAI system is inextricably tied to the reliability
of its underlying data. In this sense, the intuitive no-
tion of reliability is straightforward: how much can
we rely upon the available data to train a predictive
model so as to have it make realistic predictions? In-
tuitively, reliability can be associated with the no-
tion of source trustworthiness: that is, how much the
source of the data used to train a ML model can be
trusted and, by consequence, of much any ML model
trained on such data can be trusted. Despite the broad-
ness of this concept, we focus on the technical un-
derstanding of reliability as the complement of inter-
rater variability (Saal et al., 1980). In this sense, as-
sessing reliability is evaluating the degree to which
the observed agreement among the raters who pro-
duced the data is expected to be genuine, and not due
to chance: if all of the raters agree upon each and ev-
ery case, then no disagreement among the case’s an-
notations is observed, and the reliability is maximum.
Over time, many metrics have been proposed to
estimate the inter-rater variability (also known as
inter-rater reliability and inter-rater agreement) within
a dataset, like the Fleiss’s Kappa, the Cohen’s Kappa,
and the Krippendorff’s Alpha (Hayes and Krippen-
dorff, 2007). These indices aim to go beyond the sim-
ple proportion of matched pairs (Proportion of Agree-
ment, P
o
), which has been widely criticized in the lit-
erature due to its inability to model agreement that
could be due to chance. However, even the above
A Question of Trust: Old and New Metrics for the Reliable Assessment of Trustworthy AI
133

mentioned metrics employ a generic model of chance
effects that does not take into account background in-
formation provided by the raters themselves. To ad-
dress this gap in the literature, the degree of weighted
concordance (ρ) has been proposed in (Cabitza et al.,
2020) as a metric to quantify the degree of genuine
agreement among the raters, on the basis of the num-
ber of agreements and the rater’s confidence of their
ratings. This metric is defined as:
ρ(S, R,C) =
1
|S|
m
2
∑
x∈S,r
i
̸=r
j
∈R
GA
C
x
(r
i
, r
j
) ·C(r
i
(x), r
j
(x))
where S is the set of cases annotated by the raters;
R is the set of raters; C is a |S| × |R| matrix of reported
confidence degrees; C(r
i
(x), r
j
(x)) is the conditional
probability (given that the two raters agreed) that the
annotation provided by the raters for case x is correct;
GA
C
x
(r
i
, r
j
) is the (chance-discounted) agreement be-
tween raters r
i
and r
j
, defined as
GA
C
x
(r
i
, r
j
) =
(
0 r
i
(x) ̸= r
j
(x)
ˆc
i
(x) ˆc
j
(x) otherwise
where ˆc
i
(x) (resp. ˆc
j
(x)) is the corrected confidence
reported by rater r
i
(resp. r
j
) for case x. Intuitively, ρ
can be considered as a generalization of P
o
in which
the confidence and accuracy of the raters is taken into
account as a way to model genuine agreement.
We note that the computation of ρ requires an es-
timate of the accuracy of the raters. This could be
obtained in multiple ways, such as via standardized
pre-testing of the raters, or by employing a statistical
model of raters’ accuracy (Rasch, 1980)).
Furthermore, the ρ, and any other metric whose
purpose is to assess the source reliability for a given
MAI system, can also be related to the advice ac-
curacy of this latter MAI, as a way to provide a
more informative evaluation of its ability that takes
into account not only its accuracy at face value but
also the potential inaccuracy of the underlying ground
truth, i.e. a so-called actual accuracy. Such a rela-
tionship can be depicted in graphical form through
a nomogram such as that shown in Figure 1. In
this sense, given a MAI system which has been con-
structed based on a given ground truth (whose relia-
bility was p%) and reported an accuracy of x%, its
actual accuracy (that is, its real accuracy measured by
discounting unobserved errors due to the ground truth
itself being imperfect) can be obtained by matching
the value of ρ with the corresponding line for the ac-
curacy of the model.
2.2 Advice Accuracy
Moving from source reliability to the dimension of
reputation/ability, as we mentioned in the Introduc-
tion, there is no doubt that assessment of MAI sys-
tems has traditionally grounded on error rate-based
evaluation metrics and, more in particular, on accu-
racy alone. However, despite its wide usage, accuracy
implicitly requires strong assumptions about the sys-
tem and its data (such as label balance, or the equal
importance of different cases), which make it hard
to rigorously assess and safely deploy ML systems
in critical domains, such as the medical ones, where
such assumptions are often not met. Indeed, ML
systems developed with such limited evaluation can
strikingly fail at generalization (Holstein et al., 2019),
an issue which contributes to what has recently been
defined as a reproducibility crisis in ML (Li et al.,
2020; Hutson, 2018).
In the following we thus provide an overview
of some alternative metrics (i.e. metrics that are
not so commonly used as, for example, the accu-
racy, sensitivity, specificity, AUC, F1, while having
a clear semantics and appealing statistical properties)
for evaluation the advice accuracy component of rep-
utation/ability which have been proposed to tackle the
most striking limitations of accuracy and related error
rate-based metrics.
2.2.1 Youden’s J Static
Introduced by (Youden, 1950), the J index is a bal-
anced accuracy metrics defined as:
J = Sensitivity + Speci f icity − 1
The intuition behind the J index is to express how
much a classifier is able to appropriately discriminate
positive and negative examples within, respectively,
a control and a test group. The J index produces a
value in the range from 0 to 1, where the former in-
dicates that all predicted instances have been wrongly
classified, while the latter that neither false positives
nor false negatives have been produced, i.e. a perfect
classifier. The J index has been proposed as a way to
improve the standardization of ML processes, due to
difficulties in the use of the sensitivity and specificity
for cross-study comparisons (B
¨
ohning et al., 2008).
Moreover, the J index can also be related to ROC
analysis, as it is usually understood as one criterion
for the selection of a threshold in ROC space.
2.2.2 Matthews Correlation Coefficient
The MCC (Matthews Correlation Coefficient),
introduced by (Matthews, 1975) for bioinformatics
HEALTHINF 2023 - 16th International Conference on Health Informatics
134

Figure 1: Representation of the general relationship between advice reliability, the accuracy of a dataset, the estimated advice
accuracy, and the actual accuracy of an ML model trained on that ground truth. The figure can be used as a nomogram.
Given a minimum desirable level of accuracy (actual model accuracy) for a ML model and the corresponding theoretical
model accuracy (i.e. the accuracy of the model as measured on a hypothetical 100% correct dataset), the minimum acceptable
reliability score for a ground truth can be obtained (cfr. the red dotted path).
classification tasks, and defined as:
MCC =
T P · T N − FP · FN
(T P + FN)(T N + FP)(T P + FP)(T N + FN)
.
The MCC is effectively a measure of the correla-
tion between the real labels of a dataset and the pre-
dictions provided by a model for the same data points.
In this sense, it ranges from -1, in which case it indi-
cates perfect negative correlation (for binary classifi-
cation only), to 1, indicating perfect correlation, i.e. a
total match between the ground truth and the predic-
tions. Whenever it evaluates to 0, this is understood to
be that the model is no better than a random classifier.
The MCC has recently been increasingly proposed
for the evaluation of ML systems in the medical do-
main, due to its superior comparative power w.r.t.
other error rate-based metrics (Chicco and Jurman,
2020; Chicco et al., 2021), as a consequence of its
ability to take into account of all the entries in a confu-
sion matrix at the same time. Importantly, recent work
(Boughorbel et al., 2017) has also shown that the
MCC can be employed to preserve consistency dur-
ing the construction of a model, meaning that training
a model to optimize the MCC (rather than the accu-
racy) ensures asymptotical convergence to the theo-
retical optimal classifier.
2.2.3 ROC Curves and Balanced Average
Accuracy
ROC curve analysis has been one of the main
approaches for the evaluation of ML models in
medicine, due to its usefulness for evaluating ML
models at different decision thresholds simultane-
ously. In particular, averaging metrics (such as the
AUC or AUPRC) or single threshold metrics (such
as the F1 score) are frequently used as a criterion to
select among different models. However, as recently
discussed in (Carrington et al., 2022), averaging met-
rics that operate across all the ROC space are too gen-
eral because they evaluate all decision thresholds in-
cluding unrealistic ones; conversely, single threshold
metrics whose threshold is not informed by domain-
specific considerations are too specific, as they are
measured at a single threshold that is optimal for some
instances, but not others. To this end, Balanced Av-
erage Accuracy was introduced in literature, as de-
scribed by Carrington et al. in (Carrington et al.,
2022), building upon an analysis of the properties of
ROC AUC curves, and defined as:
AUC
n
i
=
δx
δx + δy
Sensitivity +
δy
δx + δy
Speci f icity.
Intuitively, the Balanced Average Accuracy pro-
vides a generalization of the AUC that is more spe-
cific, as it can be computed by selecting a specific re-
gion of interest in ROC space, as well as a novel inter-
pretation of the AUC itself as a generalization of the
balanced accuracy (with a weighting factor that cor-
responds to the range of considered decision thresh-
olds). Thus, the AUC
n
i
provides a better and more
informative way to model the trade-off between in-
creasing sensitivity and decreasing specificity.
2.3 Pragmatic Utility
The intuitive idea of pragmatic utility grounds on the
(common) idea that AI is introduced in a human work
setting to support and, in particular, improve the ac-
curacy of the decision making tasks that are routinely
A Question of Trust: Old and New Metrics for the Reliable Assessment of Trustworthy AI
135

performed within that setting: the so called Fried-
man’s “Fundamental Theorem” (Friedman, 2009):
H(uman) + AI > H. In this light, we propose to see
AI as a socio-technical intervention that is aimed at
improving human decision making. Thus, to measure
pragmatic utility we propose to monitor the use of the
AI system by a team of decision makers, e.g., radi-
ologists, and to compare this performance with that
of a similar group of decision makers who work in a
traditional, unaided setting; in doing so, therefore, we
propose to adopt a regular intervention-control exper-
imental design. In such a monitoring activity, we can
define (and measure) the number of errors made with
the support of AI, which we denote as AIE; and the
number of errors made when unaided, that is with-
out the AI support, which we denote as CE (that is
the errors made in the Control group). We also define
the number of right AI-aided decisions: AIN; and the
number of right unaided decisions CN.
When these 4 amounts are known, two error rates
can be defined, namely:
1. The Error Rate when aided: AIER =
AIE
AIE+AIN
;
2. The Error Rate when unaided: CER =
CE
CE+CN
;
From these two error rates, we can derive the fol-
lowing 5 indicators:
3. The Absolute Risk Reduction: ARR = CER −
AIER;
4. The Aided Number of Decisions Needed to avoid
a mistake: NND =
1
ARR
;
5. The Relative Risk: RR =
AIER
CER
, that is
AIE·(CE+CN)
CE·(AIE+AIN)
;
6. The Relative Risk Reduction: is RRR = 1 − RR.
And finally, we can define the pragmatic utility of
AI adoption as clinical decision support as
7. The Odds Ratio:
AIER
1−AIER
1−CER
CER
The interpretation of the above indicators is sim-
ilar to their counterparts in epidemiological studies,
which here we briefly recall. The Absolute Risk Re-
duction (ARR), also called risk difference, expresses
the absolute decrease of the risk to make an error
when aided by the AI with respect to being unsup-
ported. Since the ARR is a difficult metric to compre-
hend, it is usually reported along with the NND, that
is the number of decisions that must be made in the
AI supported group in order to avoid a mistake with
respect to the unsupported (control) group: obviously
the bigger the NND, the lower the positive effect of
the AI (although this can be nevertheless significant).
The Relative Risk is a metric that compares the risk
of an error made in the AI-supported group to the risk
in the unsupported group, and it is usually expressed
in decimal numbers. On the other hand, the Relative
Risk Reduction (RRR) is usually expressed as a per-
centage, as it expresses the proportional reduction in
the risk of errors in the supported group with respect
to the unsupported group. Finally, The Odds Ratio
(OR), that is our way to express the pragmatic utility,
is the decimal representation of the ratio of the likeli-
hood of an error in the supported group with respect
to the probability of an error in the the control, un-
supported group; obviously values below 1 indicates
a positive impact (that is the AI is pragmatically use-
ful), while values above 1 a detrimental effect, of the
AI on decision making.
2.4 Advice Value
A related concept to that of pragmatic utility is the one
that we call advice value, or value of the information
provided by the clinical decision support system. In
general, two main approaches are pursued to account
for the value of any piece of information: the first is
the so-called consequentialist approach. A common
proposal in this strand of research is the one first dis-
cussed by Enrico Coiera (Coiera, 2016), where the
so-called Value Of Information (VOI) is defined as
“the difference between the value of persisting with
the present state of affairs and the value of embark-
ing on a different course because of new information”.
The formulation of such a VOI usually requires calcu-
lating the expected utility (EU) of the two situations,
i.e., the aided and the unaided one; in its turn, this util-
ity is simply the likelihood of achieving a good out-
come when physicians do receive (resp. not receive)
the machine’s advice combined with the related costs,
or better yet with the difference between the related
benefits and costs. This proposal is close to similar
proposals in economics, the field of decision theory
and medical tools, such as the Standardized Net ben-
efit (Vickers et al., 2016) and its generalization, the
Weighted Utility (Campagner et al., 2022).
In addition to the consequentialist approach, we
here present also an approach that is closer to the
research at the intersection of the scholarly fields of
cognitive psychology, human factors engineering and
naturalistic decision making. In this strand of re-
search, the value of an information is defined as the
combination of diagnosticity and credibility: the for-
mer concept, diagnosticity, can be assimilated to how
much evidence a piece of information, such as a piece
of advice, offers to decision makers to choose one
hypothesis out of a number of possible alternatives.
Credibility, on the other hand, is a concept similar to
reliability, as it refers to the likelihood that the above
advice can be believed or relied upon. Thus, in light
HEALTHINF 2023 - 16th International Conference on Health Informatics
136
of these two concepts, we can define the advice value
(for each possible advice given by the machine) as
the product of diagnosticity and credibility: that is,
AV = diagnosticity ∗ credibility, or also the product
of the confidence score associated to each prediction
and the corresponding local calibration score: AV =
confidence score ∗ local calibration score.
We also define the advisory value of the machine,
AdV, as the average AV considering a number of pre-
dictions (i.e., pieces of advice) given by the machine
on a sample of cases (that is a validation or test set):
AdV =
1
n
n
∑
i=1
AV
i
.
In particular, in the above formulations, with “con-
fidence score” we mean a normalized score that a
ML model associates with an advice and denoting
the strength for that same advice; on the other hand,
with “local calibration score” we intend a calibration
score that is local in that it is calculated in correspon-
dence of the value range (or “bin”) that is associated
with the confidence score, e.g., by a calibration met-
ric that is defined at local level, such as either the ECE
(Huang et al., 2020) or the GICI (Cabitza et al., 2022);
a calibration score is a normalized score estimating
the extent confidence scores are close to the observed
frequencies. Thus, intuitively, both diagnosticity and
credibility are estimated in terms of the relevance of
the advice, based on the extent the advisor is confident
that its advice is correct, and in terms of the probabil-
ity that the advice is correct, so that this kind of value
can be assimilated to a predictive value.
2.5 Decision Benefit and Benefit
Diagrams
A further notion related to that of pragmatic utility is
the concept of decision benefit. Intuitively, decision
benefit refers to the advantage (or disadvantage) that
an AI system brings into a decision-making process,
measured in terms of the difference between the accu-
racy achieved by the same (or equiparable) physicians
when they are supported by the AI, and the raw ac-
curacy of physicians when they are not supported by
the AI. The setting to define and measure the decision
benefit is the same that we defined above in regard to
the pragmatic utility, that is: we monitor and compare
the use of the AI system by a team of decision makers,
e.g., radiologists, and we interpret AI (and any other
related form of support, such as an eXplainable AI)
as a socio-technical intervention. The decision ben-
efit can then be computed as the difference between
the accuracy obtained with the support of the AI and
the accuracy obtained without it, taken as baseline.
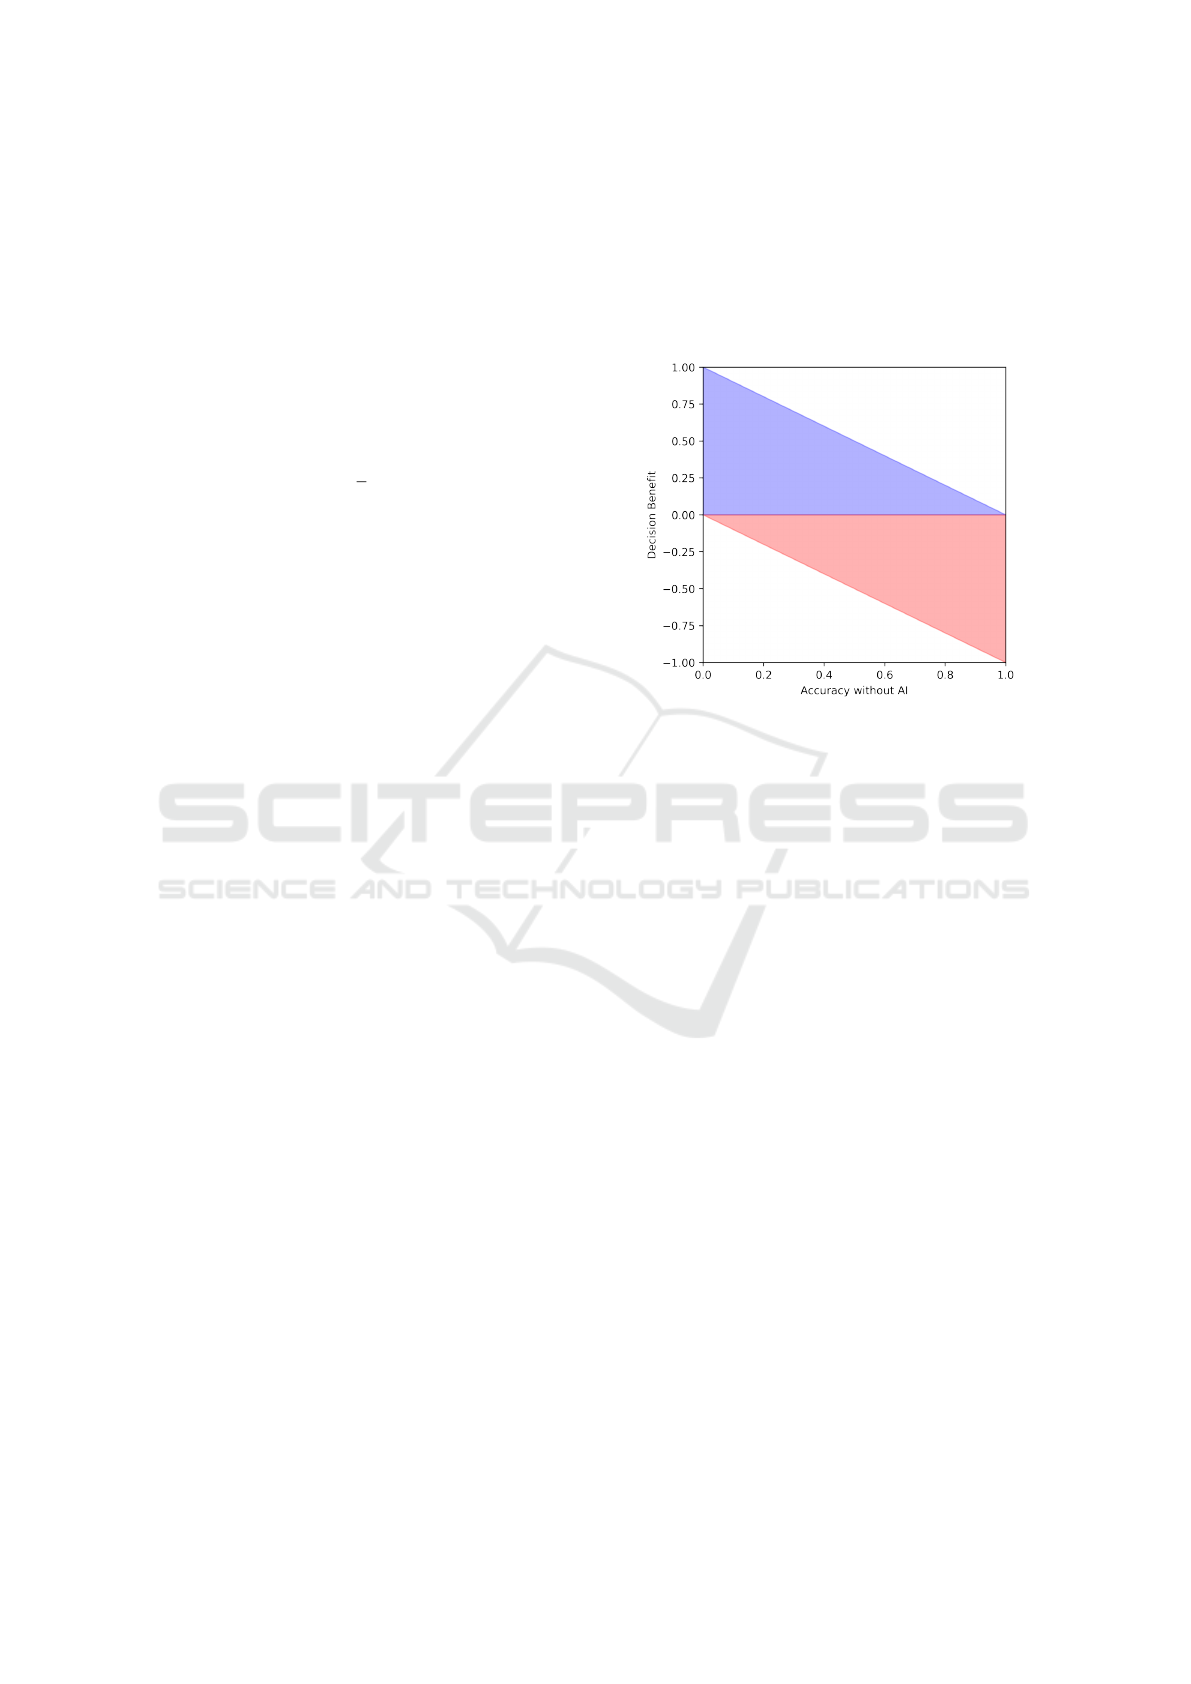
In particular, we propose to illustrate this notion by
putting it in relation to the (basal) accuracy observed
before the intervention in terms of a graphical rep-
resentation that we call benefit diagram (see Figure
2); this data visualization was inspired by a similar
(unnamed) representation that was first presented in
(Tschandl et al., 2020).
Figure 2: A benefit diagram, illustrating the decision benefit
of an AI system. The blue region denotes a benefit, the red
region a detriment.
The decision benefit diagram is basically an ex-
tended and partitioned scatterplot, where the x-axis
represents the baseline accuracy of the human deci-
sion makers, and the y-axis represents the decision
benefit (or detriment, if the former is negative) due to
the medical AI support, as defined above. Each deci-
sion maker is then represented as a glyph (e.g., a dot)
within this representation, and its appearance can be
further modified to convey any stratification informa-
tion (e.g., specialists vs residents in terms of white or
black dots). The blue region in the decision benefit di-
agram denotes a benefit due to the AI support, i.e. an
improvement in accuracy that can be attributed to the
introduction of the AI in the decision-making process,
while the red region denotes a detriment.
2.6 Potential Robustness
We adopt the intuitive notion of robustness in terms
of the extent the system gives correct advice on cases
that are naturally diverse and hence not “too similar”
with respect to the data upon which it was trained.
Since diversity and similarity are difficult concepts
to denote, we prefer speaking of potential robustness,
rather than just robustness. To estimate this latter con-
cept, we focus on the idea of replicability and ex-
ternal validation. Standard evaluation practices are
based on accuracy estimations which build on histor-
A Question of Trust: Old and New Metrics for the Reliable Assessment of Trustworthy AI
137

ical data with features that are often obtained from a
single (or a few) institutions involved in the develop-
ment of the machine learning model. Several studies
have found that when used in different circumstances,
even very accurate models report relevant drops in
their accuracy (McDermott et al., 2021). The vali-
dation of models must then take into account their
robustness, that is their ability to perform similarly
well on data from a diverse set of sources that are dis-
tinct (in terms of work habits and equipment) from
those available in the training process. To achieve
this goal, the evaluation of decision aids should take
into account not only accuracy, but also data similar-
ity, so as to allow researchers to determine whether
validation data are too similar or sufficiently different
from training and test data, and thus whether accuracy
scores are strongly correlated with similarity or not.
The relationship between data similarity and robust-
ness of ML models was first proposed by Bousquet et
al. (Bousquet, 2008): the authors observed that infor-
mation about similarity could provide useful indica-
tions to understand why a ML model performs poorly
on a validation set. Our proposal to evaluate the (po-
tential) robustness of a ML model then relies on the
combination of a metric of similarity, called Degree
of Correspondence (Cabitza et al., 2021), between
two datasets (the training and validation datasets) and
standard measures of accuracy, calibration and utility.
Intuitively, the Degree of Correspondence among the
two datasets is defined as the p-value for a multivari-
ate statistical test for equality of distributions. Then,
the procedure to evaluate the potential robustness of
a ML model encompasses both quantitative and qual-
itative (in particular visual) elements that provide an
estimate of the susceptibility and dependence of its
performance on the dis(similarity) between training
and external test sets. This procedure relies on the
availability of one of more external validation datasets
(and the more datasets, the better) and has the goal
of providing a holistic view over the performance
of the ML model, by considering two distinct as-
pects: dataset similarity (between the external valida-
tion dataset and the training set of the ML model); and
dataset cardinality, in terms of adequacy of the size
of the external validation datasets. The performance
of the ML model is assessed in terms of discrimina-
tion power, calibration and utility, three elements of
equivalent significance in the comprehensive assess-
ment of a model quality. The potential robustness
assessment is then performed by means of a graph-
ical representation of the previously mentioned data
as displayed in Figure 3, called the external perfor-
mance diagram (Cabitza et al., 2021)
1
. This diagram
permits to visually convey, for any external validation
dataset considered, whether or not the dataset meets
(or surpasses) the Minimum Sample Size (MSS) (Ri-
ley et al., 2021); together with a quantitative mea-
surement of the above mentioned quality dimensions
(namely, discrimination power, in terms of the metrics
reported in Section 2.2 or, simply, the AUC; model
utility, in terms of the Weighted Utility (Campagner
et al., 2022) or, as a special case, the Net Benefit; and
model calibration, in terms of the GICI or the Brier
Score) in light of the observed dataset similarity.
So as to adopt a consistent naming convention in
regard to the dataset similarity, measured by means of
the Degree of Correspondence, we adopt a nomencla-
ture inspired by Landis and Koch (Landis and Koch,
1977), which is illustrated in the proposed diagram.
Thus, a similarity higher than 60% (i.e., significant or
fundamental) should make users and developers care-
ful about the utility of such a validation strategy to in-
form about the genuine replicability of the model per-
formance. Then again, great performance displayed
by the model on external datasets that are under 40%
similarity (slight or low similarity) should be viewed
as adequate in providing a conservative estimate of
model performance. A similar terminology is like-
wise embraced concerning the model performance.
Specifically, as for the discrimination power, values
higher than 0.7 are considered acceptable; while val-
ues higher than 0.8, or 0.9 as, respectively, good and
excellent. Similar thresholds are also adopted for the
model’s utility and the calibration.
All of these information pieces are represented in
the external performance diagram. Specifically, in
each one of the three portions in which the diagram
can be easily divided, the bottom regions correspond
to areas of low similarity: if an external validation
set falls into this area, the validation can be viewed
as sufficiently conservative; in addition, if the perfor-
mance of the model on this same dataset falls into the
right-bottom region, the validation procedure can be
considered as providing a good indication of model
reproducibility (and hence robustness).
As a quantitative information that can be derived
from and related to the external performance, we also
propose two metrics that represent the notion of po-
tential robustness, by combining information about
performance and similarity. In regard to our first pro-
posal, that we call strong potential robustness (SPR),
let us assume to test the above mentioned differ-
ence between training and external validation per-
1
A web application to generate an external per-
formance diagram can be accessed at https://qualiml.
pythonanywhere.com/.
HEALTHINF 2023 - 16th International Conference on Health Informatics
138
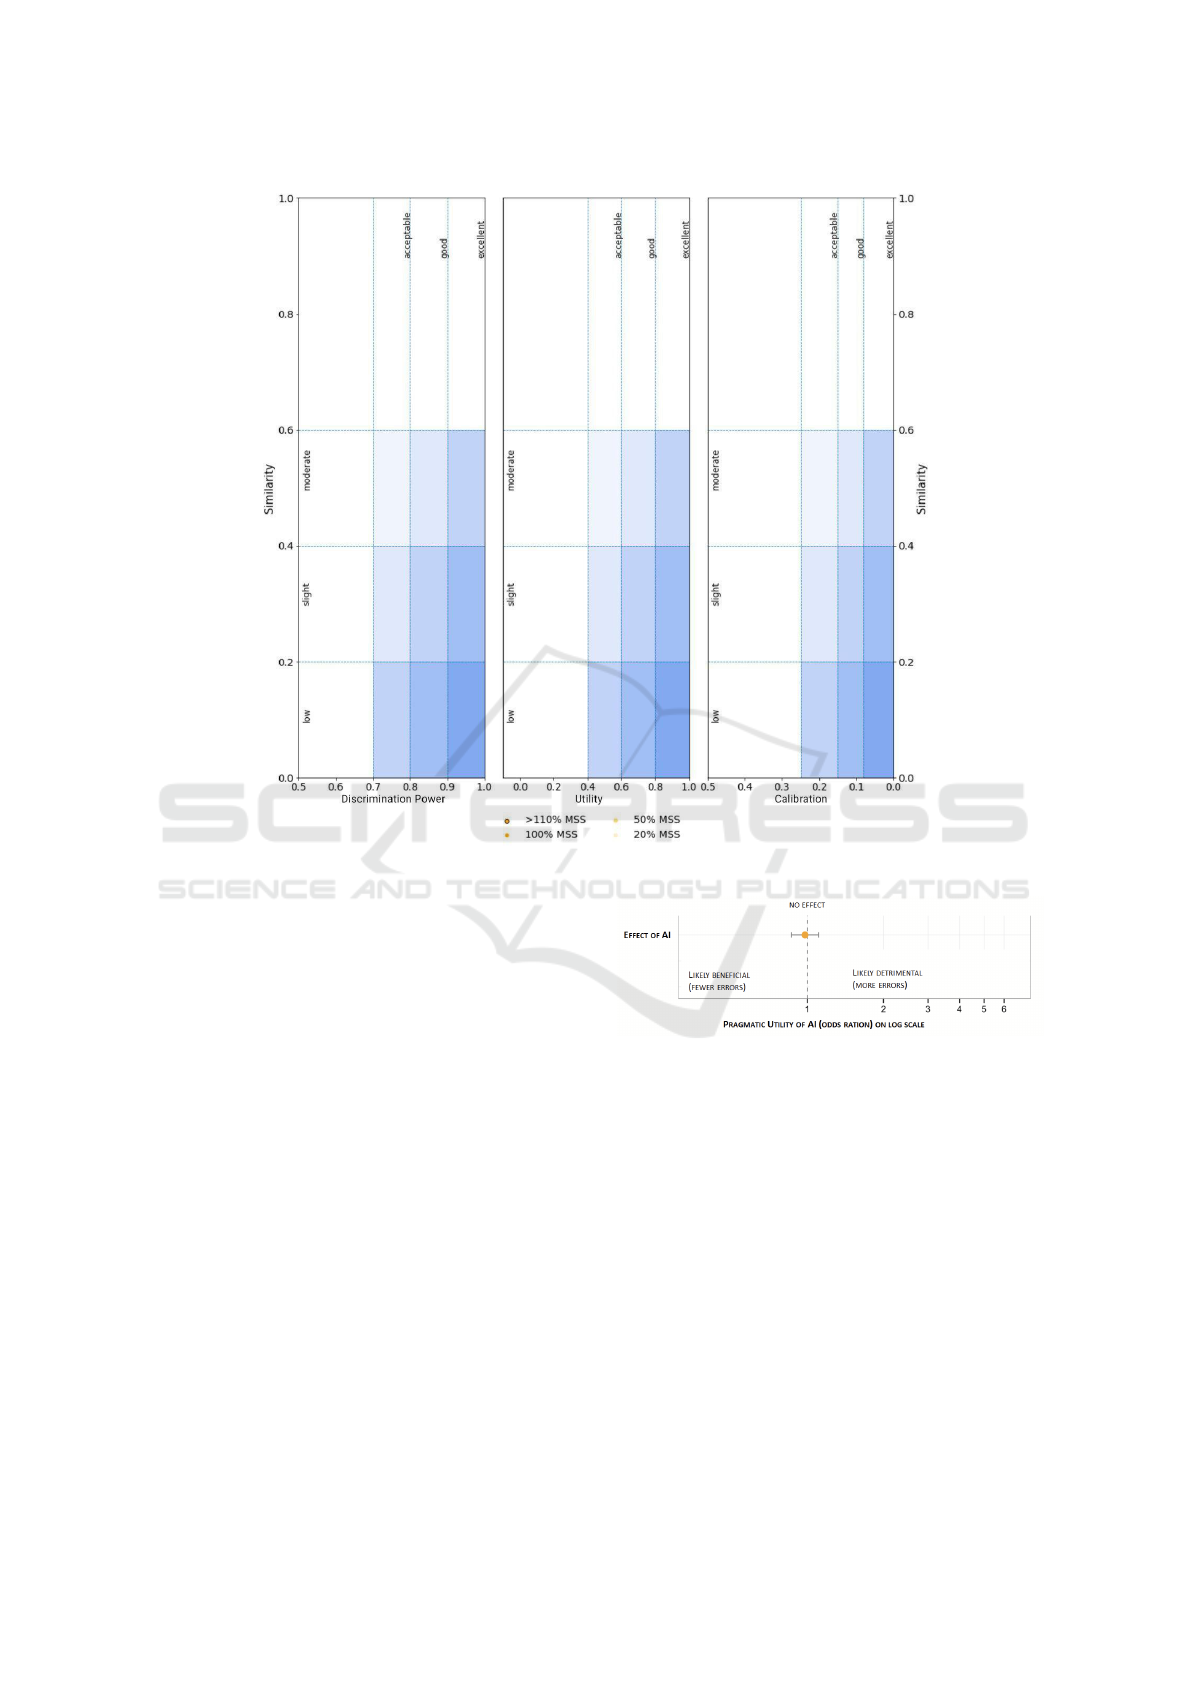
Figure 3: The external performance diagram.
formance, thus obtaining a p-value P
performance
. As-
sume also to test the similarity between the training
set and the external validation dataset, using e.g. the
Degree of Correspondence and thus obtaining a p-
value P
similarity
. Intuitively, the higher P
performance
and
the lower P
similarity
the more robust the ML model
is. Thus, the SPR is computed as the combination
of the two p-values using the Extended Chi-Square
Function, that is SPR = k ∗ (1 - ln(k)), where k
= P
performance
∗ (1 - P
similarity
). Intuitively, the SPR
metric gives an indication about the strength of the
hypothesis that AI performs on any given external
dataset as well as with the internal validation one.
The second metric that we consider, called weak
potential robustness (WPR), is similar to the SPR but
it relaxes the comparison between the internal and ex-
ternal validation performance. In the computation of
the WPR, we propose to perform n randomized splits
of the internal dataset to obtain training and validation
datasets; for each of these splits we evaluate the per-
formance (according to any given accuracy metrics,
such as those discussed previously) on the validation
dataset and we take the minimum A
min
of these val-
Figure 4: A graph depicting the pragmatic utility of a med-
ical AI as decision support, expressed in terms of odd ratio
and its confidence interval. If the C.I. does not cross the ’no
effect’ line there is a statistically significant effect.
ues across the n splits. Then, A
min
is used to com-
pute a p-value P
acceptability
by comparing it to the per-
formance observed on the external validation dataset.
Then, the WPR is obtained as in the case of the SPR
as WPR = t ∗ (1 - ln(t)), where t = P
acceptability
∗ (1
- P
similarity
). In contrast with the SPR, intuitively the
WPR metric gives an indication about the strength of
the hypothesis that the ML model performs better on
any given external dataset than the worst possible out-
come that could be obtained from the internal valida-
tion one. Thus, the idea of strong robustness relates to
systems that are as valid (on external data) as they are
on internal data; the idea of weak robustness relates
A Question of Trust: Old and New Metrics for the Reliable Assessment of Trustworthy AI
139
to systems that are acceptably valid on external data,
that is not worst than they are on the worse internal
validation dataset.
3 APPLICATIONS IN
EXEMPLIFICATORY CASE
STUDIES
To illustrate the use and utility of the metrics proposed
above, we illustrate how to apply them in two case
studies that we performed in the radiological setting,
for the task of the interpretation and classification of
knee lesions Magnetic Resonance Images (MRI), and
in the setting of COVID-19 diagnosis on the basis of
routine blood tests (i.e. Complete Blood Counts).
In the first case study, we involved 13 board-
certified radiologists by asking them to annotate 120
MR images extracted from the MRNet dataset, and
classify them in terms of lesion presence or absence.
For each of the cases, the radiologists had to first pro-
pose a tentative diagnosis, which was recorded, and
then to produce a final classification after that the ad-
vice of an AI system had been proposed to them. By
comparing the two diagnoses, we can count the num-
ber of times radiologists confirmed their initial diag-
nosis or changed it in light of the machine’s advice.
The pragmatic utility scores for the MRI study are
reported in Table 1 (with 95% C.I.) and in Figure 4.
Table 1: The pragmatic utility scores for the MRI study.
Metric Value
AIE 352
AIN 1196
CE 367
CN 1181
AIER .227 [.207, .248]
CER .237 [.216, .258]
ARR 0.01
NND 103
RR .96
RRR 4.09
OR or prag-
matic utility
0.95 [0.8 , 1.12]
2
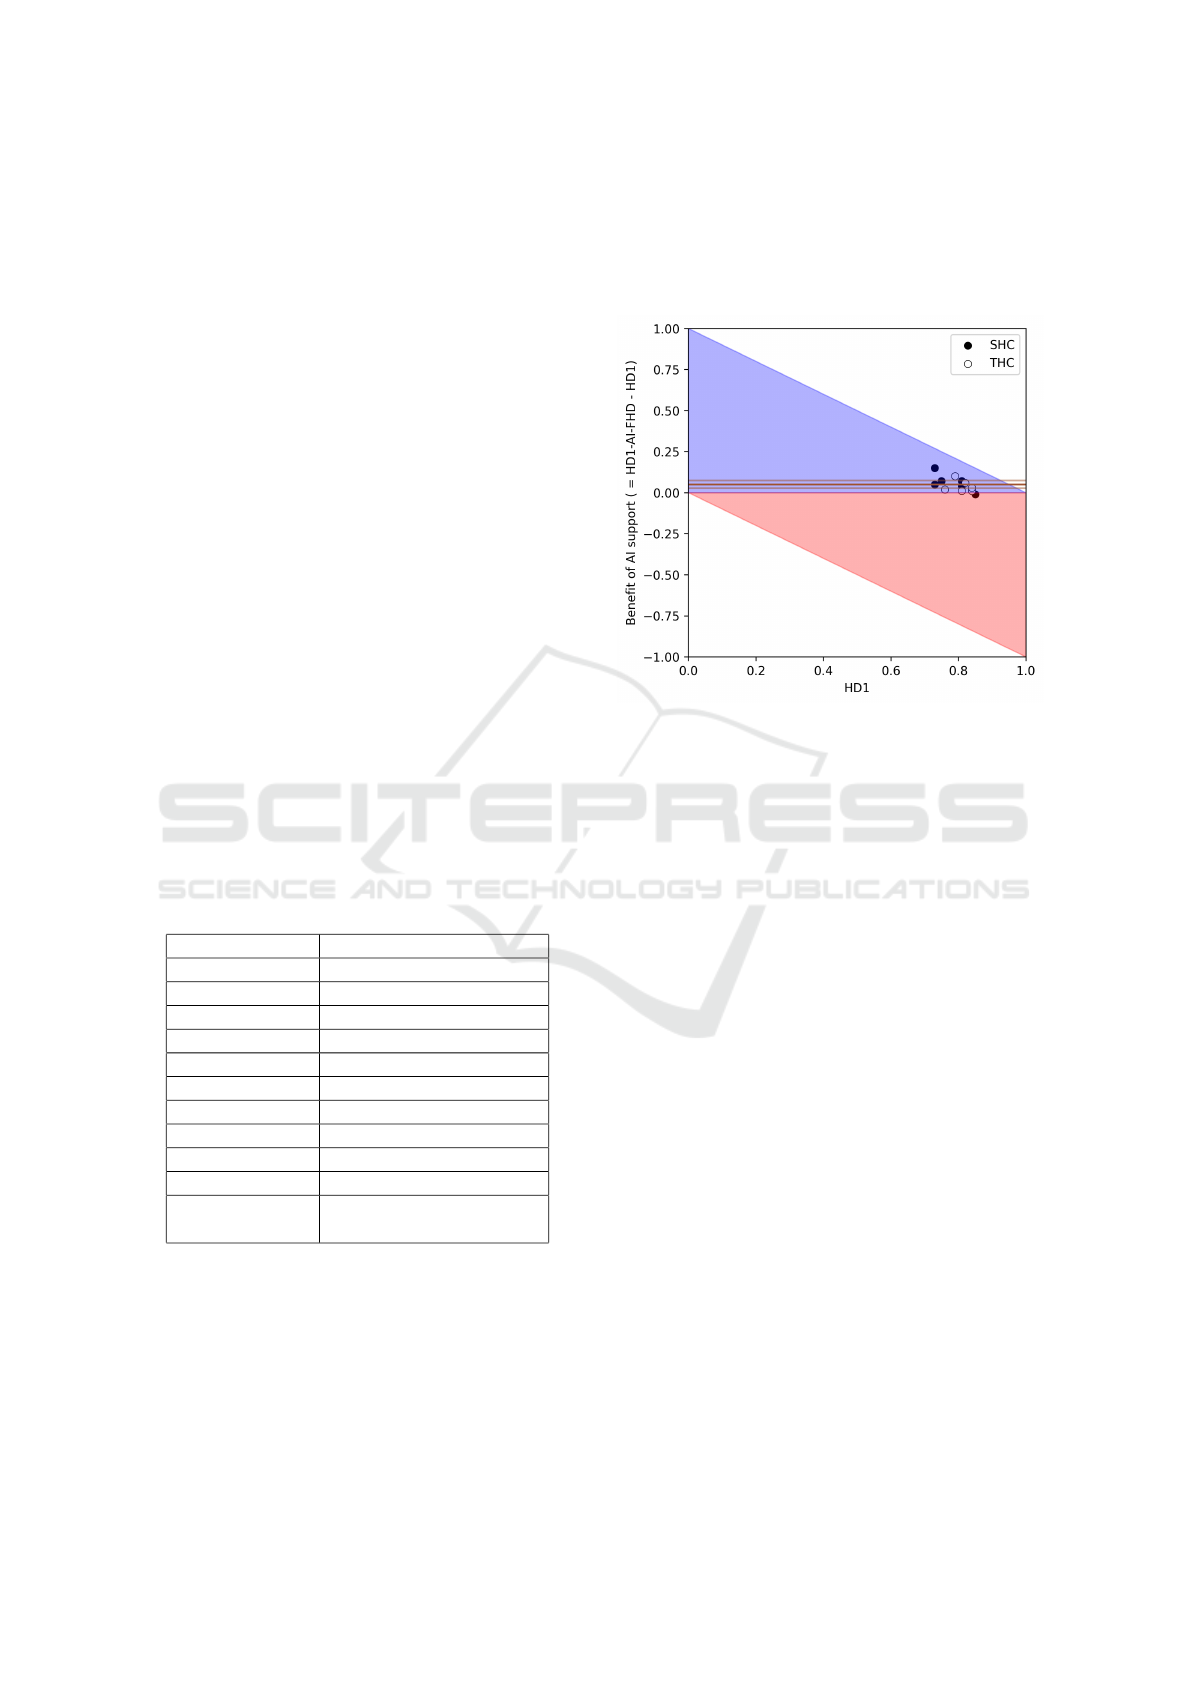
We also evaluated the decision benefit of the AI,
which is depicted in Figure 5: each of the radiologists
is represented as a circle (whose color depends on
the characteristics of the hospital enrolling the corre-
sponding radiologists, either Secondary Health Cen-
ter or Tertiary Health Center), while the average ben-
efit (along with the corresponding 95% C.I.) is repre-
sented as an orange horizontal line. It can be easily
seen that the AI had a significantly positive decision
benefit, as the AI-supported accuracy of all the radi-
ologists was greater than their corresponding unsup-
ported accuracy and significantly so (that is the confi-
dence intervals do not include the 0 benefit line).
Figure 5: The benefit diagram for the MRI study, show-
ing the advantage of introducing AI support in the decision-
making process. SHC stands for Secondary Healthcare and
THC for Tertiary Healthcare, to denote the facilities where
the involved decision makers worked.
Finally, we also evaluated the reliability of the an-
notations produced by the 13 radiologists. The av-
erage actual accuracy of the raters was ˆacc = 0.81 ±
0.04 (95% C.I.) computed with respect to the MR-
Net reference. The distribution of the confidence lev-
els reported by each radiologist is shown in Figure 6.
The ρ between the radiologists was 0.57. By con-
trast, the values of Krippendorff’s α and Fleiss’ k,
they were both equal to 0.63, while the value of P
o
was 0.82. Assume a ML model was trained on the
majority-aggregated training set obtained by the radi-
ologists’ annotations and reported an estimated accu-
racy of 90%. Then, based on the nomogram reported
in Figure 1, the actual accuracy of the ML model can
be computed: the resulting value is approximately
80%, a much more conservative estimate of the ML
model compared to the above mentioned naive esti-
mate of advice accuracy.
In the second case study, we evaluated the robust-
ness of a state-of-the-art COVID-19 analytic model.
This ML model was trained by using a training set of
1736 cases and 21 blood sample and demographics
features, collected at the IRCCS Hospital San Raf-
faele (HSR) and IRCCS Istituto Ortopedico Galeazzi
(IOG), both situated in Milan (Italy). The data were
gathered between March 5, 2020, and May 26, 2020,
that is during the main peak of the COVID-19 pan-
HEALTHINF 2023 - 16th International Conference on Health Informatics
140
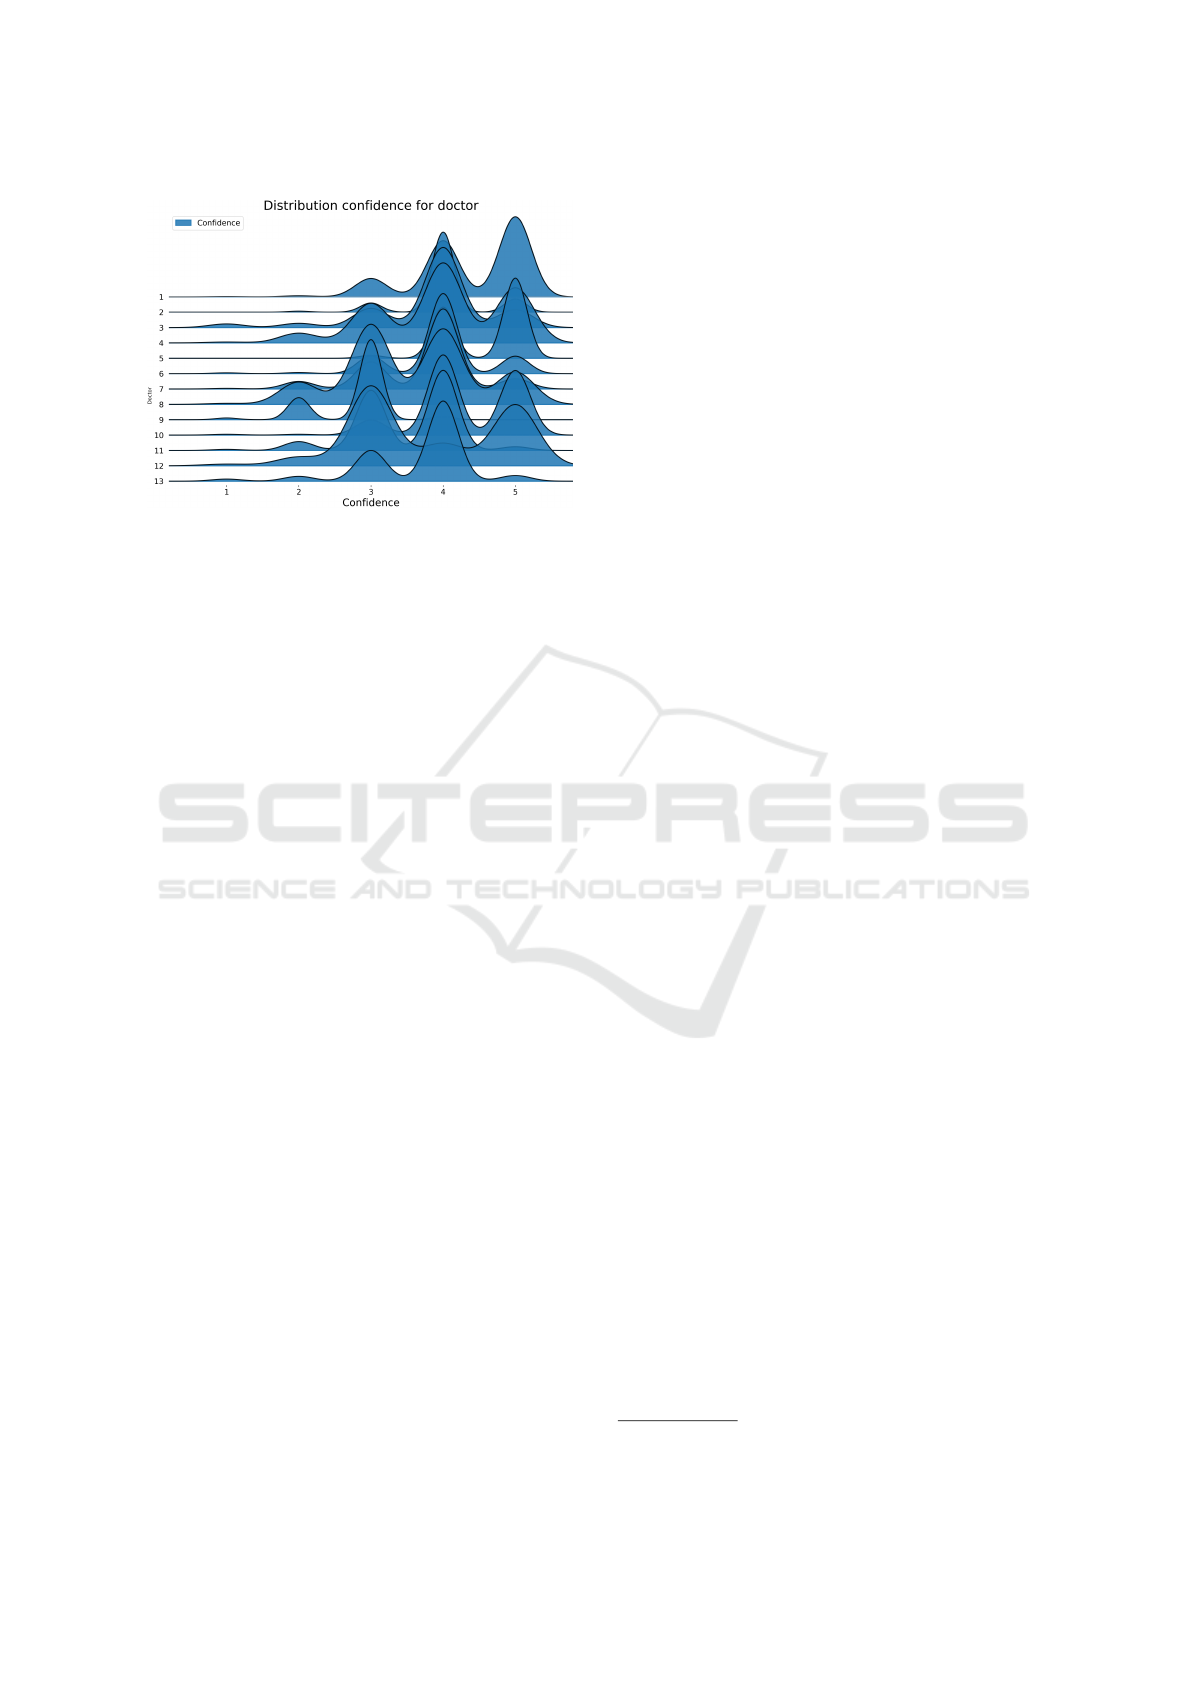
Figure 6: Joyplot of the perceived confidence levels re-
ported by the radiologists involved in the first case study.
Each curve represents the distribution of perceived confi-
dence levels reported by a specific annotator.
demic in Northern Italy. In regard to the ML model,
we validated a pipelined model including: a miss-
ing data imputation step (using K-Nearest Neigh-
bors); a data standardization step; and a RBF Support
Vector Machine classification model. We performed
eight different validations based on as many external
datasets, namely:
• The Italy-1 dataset, gathered at the Desio Hospital
in March/April 2020 and including 337 cases (163
positive, 174 negative);
• The Italy-2 dataset, gathered at the ’Father Gio-
vanni XXIII’ Hospital of Bergamo in March/April
2020 and including 249 cases (104 positive, 145
negative);
• The Italy-3 dataset, gathered at the IRCCS Hospi-
tal San Raffaele in November 2020 and including
224 cases (118 positive, 106 negative);
• The Spain dataset, gathered at the University Hos-
pital Santa Lucia in Cartagena in October 2020
and including 120 cases (78 positive, 42 negative);
• The 3 Brazil datasets: the first dataset, Brazil-1,
was gathered in the Fleury private clinics; while
the other 2 datasets, Brazil-2 and Brazil-3, were
gathered at the Albert Einstein Israelite Hospital
and the Hospital Sirio-Libanes. The datasets in-
cluded, respectively, 1301 (352 positive, 949 neg-
ative), 2335 (375 positive, 1960 negative) and 345
(334 positive, 11 negative) cases, gathered be-
tween February 2020 and June 2020;
• The Ethiopia dataset, gathered at the National
Reference Laboratory for Clinical Chemistry
(Millenium COVID-19 Treatment and Care Cen-
ter) of the Ethiopian Public Health Institute in Ad-
dis Ababa, between January and March 2021 and
including 400 cases (200 positive, 200 negative).
The datasets, including their characteristics and fea-
tures, are further described in (Cabitza et al., 2021)
and are openly accessible on Zenodo
3
By considering Figure 7, we can say that the dis-
criminative performance of the model (in terms of
AUC) was generally good for most external datasets
(for all datasets except the Spain dataset the AUC was
higher than 75%). By contrast, while the calibration
and utility were good on the datasets more similar
to the training data (i.e. the three Italian datasets),
the performance of the model with respect to these
two quality dimensions was lower on the other exter-
nal datasets (see Figure 5). In particular, the connec-
tion between the AUC and the dataset similarity was
very strong (r = 0.74) and significant (p = .035); the
relationship between the utility and dataset similar-
ity was moderate (r = .39) but not significant (p =
.345); while the connection between the calibration
and dataset similarity was strong (r = .66) yet not sig-
nificant (p = .076). Consequently, considering the ob-
servations reported for the first step of the procedure,
we can see that data heterogeneity has a moderate ef-
fect on model performance. Based on the reported
results the model can be thought of as externally val-
idated, as, for at least one external dataset associated
with slight similarity the reported performance was
acceptable (or better) for all the considered metrics.
Moreover, most external validation datasets could be
considered of adequate cardinality: all datasets except
the Spain dataset surpassed the MSS for the three con-
sidered performance metrics.
To complement this qualitative analysis with a
more quantitative perspective, we also computed the
Strong Potential Robustness (SPR) and the Weak Po-
tential Robustness (WPR) scores for the Brazilian
datasets only. In particular, the SPR for the Brazil-
1, Brazil-2 and Brazil-3 datasets were .0, .03 and .01
respectively. Thus, the ML model was not strongly
robust on these datasets. However, the values of the
WPR were .92, .88 and .93 respectively. We remark
that, while optimality is achieved with high values of
SPR, acceptability of the model should be evaluated
with respect to WPR scores.
4 CONCLUSIONS
In this contribution, we presented and discussed novel
and old metrics to assess the quality of a decision aid,
in terms of the comparison between the performance
of clinicians in either aided or unaided (unsupported)
3
https://zenodo.org/record/4958146#.YMjK0kzONPY.
A Question of Trust: Old and New Metrics for the Reliable Assessment of Trustworthy AI
141
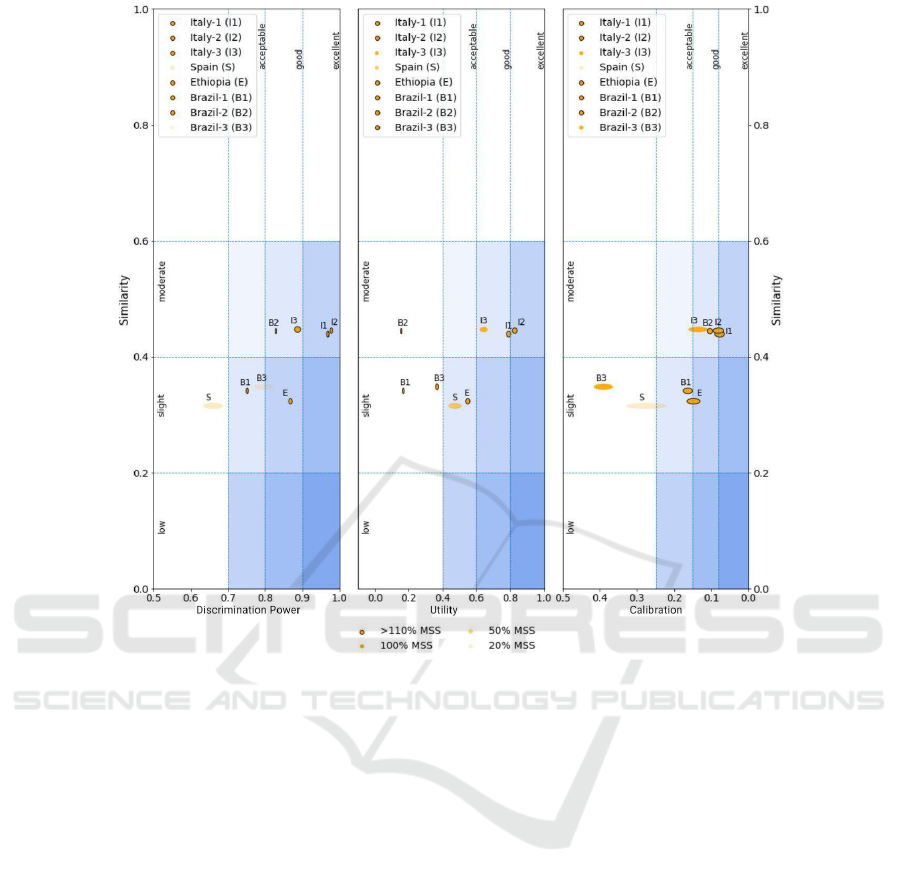
Figure 7: The external performance diagram for the COVID-19 study. The size of the ellipses reflect the width of the
confidence intervals for the performance metrics.
settings (see pragmatic utility and decision benefit),
and in terms of the correlation between common per-
formance metrics and the similarity between test data
and training data. We also illustrated the applica-
tion of these concepts by means of several case stud-
ies. Our main point is that AI quality is an intrinsi-
cally multi-factorial concept that should be appraised
by a number of perspectives and hence by alterna-
tive and complementary indicators and by graphical
tools that allow for a qualitative interpretation of how
good, and hence trustworthy, the tool is. Trust also
is a complex concept that is characterized by intrin-
sic characteristics of the tool, such as accuracy and
calibration, as well as extrinsic (that is user-related,
situation-specific, contextual) characteristics, which
invite researchers and practitioners to conduct a holis-
tic evaluation in vivo and where decision support sys-
tems are deployed and adopted in daily decision mak-
ing. Our contribution then aims to provide practition-
ers with tools to enact a responsible techno-vigilance
(Cabitza and Zeitoun, 2019) and continuous monitor-
ing of medical AI effectiveness, as well as of user ac-
ceptance and stakeholders’ satisfaction. To this pur-
pose, metrics (the degree of correspondence and min-
imum sample sizes) and visualizations (the benefit di-
agram and external performance diagram) described
in this article are made publicly available on GitHub
at https://github.com/AndreaCampagner/qualiMLpy.
Future work should focus on: 1) the extension of the
considered framework of measures to multi-class, re-
gression and multi-target problems; 2) the extension
of our framework so as to better encompass other rel-
evant dimensions of AI systems’ performance (cal-
ibration, user satisfaction, understandability and ex-
plainability). Furthermore, we believe that further ex-
emplificatory studies, also in settings other than the
medical one, could increase the awareness about the
considered dimensions for assessment.
REFERENCES
B
¨
ohning, D., B
¨
ohning, W., and Holling, H. (2008). Revisit-
ing youden’s index as a useful measure of the misclas-
sification error in meta-analysis of diagnostic studies.
HEALTHINF 2023 - 16th International Conference on Health Informatics
142

Statistical Methods in Medical Research, 17(6):543–
554.
Boughorbel, S., Jarray, F., and El-Anbari, M. (2017). Op-
timal classifier for imbalanced data using Matthews
Correlation Coefficient metric. PLOS ONE,
12(6):e0177678.
Bousquet, N. (2008). Diagnostics of prior-data agree-
ment in applied bayesian analysis. Journal of Applied
Statistics, 35(9):1011–1029.
Cabitza, F., Campagner, A., and Famiglini, L. (2022).
Global interpretable calibration index, a new metric
to estimate machine learning models’ calibration. In
International Cross-Domain Conference for Machine
Learning and Knowledge Extraction, pages 82–99.
Springer.
Cabitza, F., Campagner, A., and Sconfienza, L. (2020). As
if sand were stone. New concepts and metrics to probe
the ground on which to build trustable AI. BMC Med-
ical Informatics and Decision Making, 20(1).
Cabitza, F., Campagner, A., Soares, F., et al. (2021). The
importance of being external. methodological insights
for the external validation of machine learning mod-
els in medicine. Computer Methods and Programs in
Biomedicine, 208:106288.
Cabitza, F. and Zeitoun, J.-D. (2019). The proof of the pud-
ding: in praise of a culture of real-world validation for
medical artificial intelligence. Annals of translational
medicine, 7(8).
Campagner, A., Sternini, F., and Cabitza, F. (2022). De-
cisions are not all equal. introducing a utility met-
ric based on case-wise raters’ perceptions. Computer
Methods and Programs in Biomedicine, page 106930.
Carrington, A. M., Manuel, D. G., Fieguth, P., et al. (2022).
Deep ROC Analysis and AUC as Balanced Average
Accuracy, for Improved Classifier Selection, Audit
and Explanation. IEEE Transactions on Pattern Anal-
ysis and Machine Intelligence, pages 1–1.
Chicco, D. and Jurman, G. (2020). The advantages of the
Matthews correlation coefficient (MCC) over F1 score
and accuracy in binary classification evaluation. BMC
Genomics, 21(1):6.
Chicco, D., T
¨
otsch, N., and Jurman, G. (2021). The
Matthews correlation coefficient (MCC) is more re-
liable than balanced accuracy, bookmaker informed-
ness, and markedness in two-class confusion matrix
evaluation. BioData Mining, 14(1):13.
Coiera, E. (2016). A new informatics geography. Yearbook
of Medical Informatics, 25(01):251–255.
Friedman, C. P. (2009). A “fundamental theorem” of
biomedical informatics. Journal of the American
Medical Informatics Association, 16(2):169–170.
Hayes, A. F. and Krippendorff, K. (2007). Answering the
call for a standard reliability measure for coding data.
Communication methods and measures, 1(1):77–89.
Hoff, K. A. and Bashir, M. (2015). Trust in automation: In-
tegrating empirical evidence on factors that influence
trust. Human factors, 57(3):407–434.
Holstein, K., Wortman Vaughan, J., Daum
´
e III, H., et al.
(2019). Improving fairness in machine learning sys-
tems: What do industry practitioners need? In Pro-
ceedings of the 2019 CHI conference on human fac-
tors in computing systems, pages 1–16.
Huang, Y., Li, W., Macheret, F., et al. (2020). A tutorial on
calibration measurements and calibration models for
clinical prediction models. Journal of the American
Medical Informatics Association, 27(4):621–633.
Hutson, M. (2018). Artificial intelligence faces repro-
ducibility crisis. Science, 359(6377):725–726.
Kohn, S. C., De Visser, E. J., Wiese, E., et al. (2021). Mea-
surement of trust in automation: A narrative review
and reference guide. Frontiers in Psychology, 12.
Landis, J. R. and Koch, G. G. (1977). The measurement of
observer agreement for categorical data. biometrics,
pages 159–174.
Lee, J. D. and See, K. A. (2004). Trust in automation:
Designing for appropriate reliance. Human factors,
46(1):50–80.
Li, J., Liu, L., Le, T., et al. (2020). Accurate data-driven
prediction does not mean high reproducibility. Nature
Machine Intelligence, 2(1):13–15.
Matthews, B. (1975). Comparison of the predicted and
observed secondary structure of T4 phage lysozyme.
Biochimica et Biophysica Acta (BBA) - Protein Struc-
ture, 405(2):442–451.
Mayer, R. C., Davis, J. H., and Schoorman, F. D. (1995). An
integrative model of organizational trust. Academy of
management review, 20(3):709–734.
McDermott, M. B., Wang, S., Marinsek, N., et al. (2021).
Reproducibility in machine learning for health re-
search: Still a ways to go. Science Translational
Medicine, 13(586):eabb1655.
OECD Network of Experts on AI (2020). Tools for trust-
worthy ai. a framework to compare implementation
tools for trustworthy ai systems. Technical Report
DSTI/CDEP(2020)14/FINAL, OECD.
Rasch, G. (1980). Probabilistic models for some intelli-
gence and attainment tests. 1960. Copenhagen, Den-
mark: Danish Institute for Educational Research.
Riley, R. D., Debray, T. P., Collins, G. S., et al. (2021). Min-
imum sample size for external validation of a clinical
prediction model with a binary outcome. Statistics in
Medicine.
Saal, F. E., Downey, R. G., and Lahey, M. A. (1980). Rat-
ing the ratings: Assessing the psychometric quality of
rating data. Psychological bulletin, 88(2):413.
Tschandl, P., Rinner, C., Apalla, Z., et al. (2020). Human–
computer collaboration for skin cancer recognition.
Nature Medicine, 26(8):1229–1234.
Vickers, A. J., Van Calster, B., and Steyerberg, E. W.
(2016). Net benefit approaches to the evaluation of
prediction models, molecular markers, and diagnostic
tests. bmj, 352.
Youden, W. J. (1950). Index for rating diagnostic tests. Can-
cer, 3(1):32–35.
A Question of Trust: Old and New Metrics for the Reliable Assessment of Trustworthy AI
143
