
Environmental Pollution Assessment with Indicator Plant Under
Ozone Gas Atmosphere by Using OCT
Hayate Goto
a
and Tatsuo Shiina
b
Chiba University, YayoiCho, Inage-ku, Chiba-shi, Chiba, Japan
Keywords: Environmental Assessment, Ozone, OCT, Field Measurement, Transparency, Leaves, Laser.
Abstract: Measuring plants’ sensitivity to environmental stresses can help us understand the environmental and
ecological conditions in the area. Optical Coherence Tomography (OCT) can visualize and evaluate the
internal plant structure quantitatively. In this study, as a preliminary step to assess the atmospheric
environment by field measurements of plants using OCT, the influence of the ozone gas and the effect of the
plant-clearing agent in OCT measurement were evaluated. The plant-clearing agent makes the internal
refractive index uniform and allows evaluation of the extinction coefficient from the leaf’s full cross-section
image. The results showed an increase in the extinction coefficient and its palisade thickness. The extinction
coefficient significantly changed between before and after exposure to ozone gas to 16.9 ± 6.2 [/mm] from
12.6 ± 3.42 [/mm]. This result indicates that OCT can measure plant responses to environmental changes
quantitatively. Field measurement of plants by OCT will allow environmental assessment anywhere in a short
time.
1 INTRODUCTION
In recent years, toxic substances in the air have
become high enough to affect plants and animals in
some urban areas (Masui et al., 2021, Graham et al.,
1998). One method of environmental assessment is to
use “indicator plants” that are sensitive to changes in
the atmospheric environment. This method does not
need expensive equipment. In addition, indicator
plants can be evaluated by visual process or by using
the conventional technique. If the atmosphere
becomes dry, the chlorophyll content in plants’ leaves
decreases. Spectroscopic observation can observe
those decreases (Kwartiningsih et al., 2021).
However, the reduction of chlorophyll can also be
caused by nutrient deficiencies and insect damage.
Spectroscopic observations can also be used to
observe plants’ responses that lead to pigment
changes, biochemical changes, and inhibition of
photosynthesis. Because of the simultaneous
occurrence of different plant stressors, it is not easy
to elucidate the causal stress.
If a plant experiences environmental stresses, the
effect of this stress is often found in the changes in
a
https://orcid.org/0000-0001-5387-9109
b
https://orcid.org/0000-0001-9292-4523
the plant’s internal structure. For this reason, close-
range remote sensing for observing plant growth is a
practical approach to evaluating environmental
stressors by measuring plant conditions. Optical
Coherence Tomography (OCT) is a remote sensing
technique that uses near-infrared light to visualize the
internal structures of living organisms. It has the
advantage over other methods, such as MRI, X-ray,
etc., in obtaining internal structures by being
inexpensive, compact, and can be used in the field
(Wijesinghe et al., 2017, Lee et al., 2019). This
research discusses the feasibility of in-situ
observation of the atmospheric environmental stress
on plants by measuring the change in leaves’ internal
structure.
One problem with OCT is that the measurement
depth is limited due to light scattering due to the non-
uniformity of the refractive index of a plant leaf’s
tissue (Wit et al., 2020). To match the internal
refractive index, we used a plant-clearing agent with
a refractive index close to the plant tissue that can
penetrate inside the plant (Villani et al., 2013). We
discussed the advantages of tissue clearing in field
observations with OCT.
34
Goto, H. and Shiina, T.
Environmental Pollution Assessment with Indicator Plant Under Ozone Gas Atmosphere by Using OCT.
DOI: 10.5220/0011679400003408
In Proceedings of the 11th International Conference on Photonics, Optics and Laser Technology (PHOTOPTICS 2023) , pages 34-39
ISBN: 978-989-758-632-3; ISSN: 2184-4364
Copyright
c
2023 by SCITEPRESS – Science and Technology Publications, Lda. Under CC license (CC BY-NC-ND 4.0)
We focused on ozone gas as environmental stress
on plants. Ozone gas is relatively high near industrial
and urban areas. Since high ozone concentrations can
affect plants, quantifying the effect of ozone gas on
plants is an essential aspect that this work wants to
establish. In this work, we exposed white clovers, the
ozone indicator plant, under a high concentration of
ozone gas and measured changes in the leaf’s internal
structure by using our original OCT. These results can
be used to infer ozone concentration in a
measurement area.
This work aims to evaluate the plant growing
environment by using OCT in orchards or polluted
areas. The OCT that was developed in our laboratory
can evaluate quantitatively by only point
measurement with the discussion of their optical
properties. The proposed method has the advantage of
easy environmental assessment anywhere.
2 METHOD
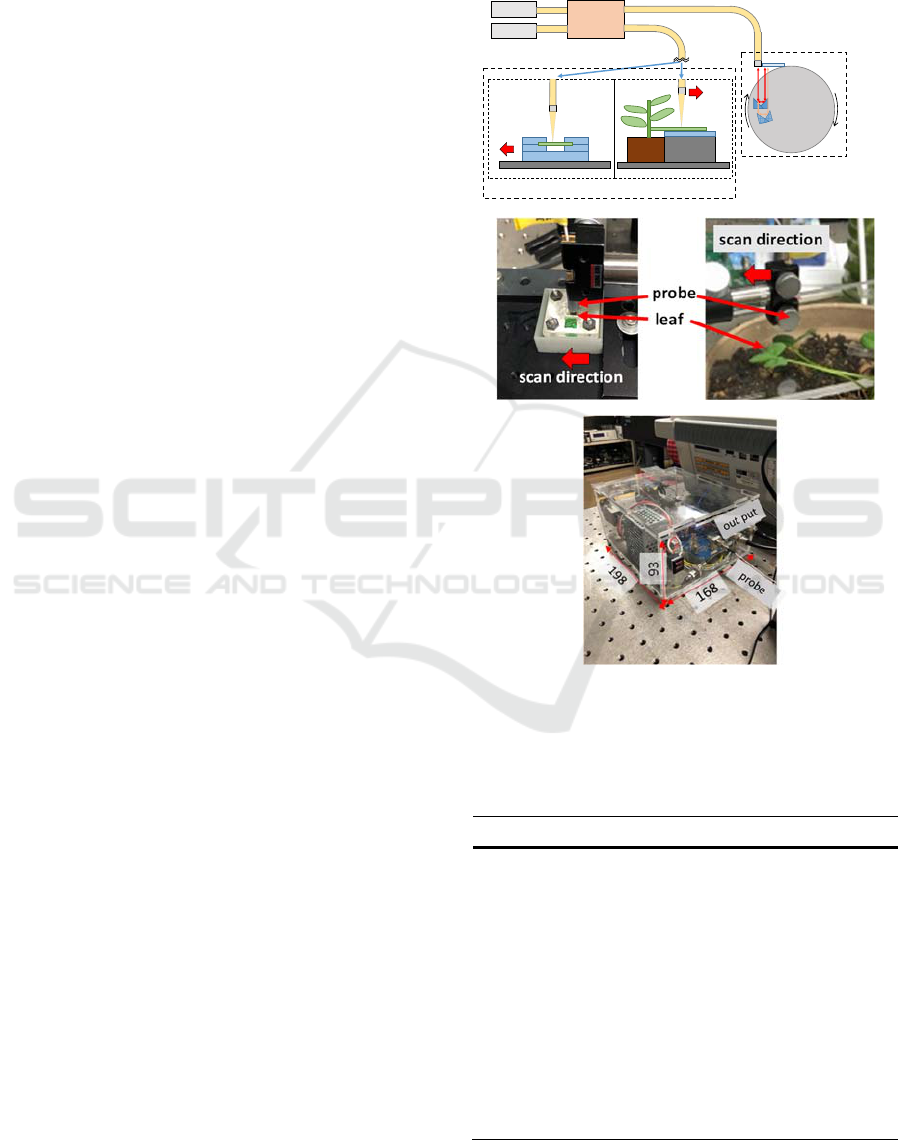
The OCT system used in this study is developed for
plant measurement in our laboratory, and its
configuration is shown in Fig.1(a). Fig.1(b) shows the
optical probe and its’ measurement scene. The size of
this OCT is shown in Fig.1(c), and it is small enough
to be easily taken it outside and runs on a DC battery.
This OCT, a TD-OCT, incorporates a rotation
mechanism in the reference optical path, and the
optical path length changes linearly with time. This
OCT is constructed to evaluate changes in the plant’s
internal structure by point measurement. Leaves are
quantitatively evaluated by acquiring A-scans in field
measurements. We select the wavelength of the light
source to be 1310 nm, which has a low absorbance for
chlorophyll and a local minimum absorbance for
water. The optical probe was designed to be small.
The probe is small enough to be positioned anywhere
near the leaf and at any angle during field
measurement. Table 1 shows the specification of the
OCT system. A-scan signals are acquired at 25 Hz,
and each A-scan is the average of 16 measurements
to reduce noises.
In the OCT measurement with a plant-clearing
agent, the leaves were placed between two acrylic
plates with a window in the measurement area (Fig.
1b). This method needs to measure the same position
of the leaf before and after the transparency process.
For this reason, the plant-clearing agent is filled into
the window, with the leaf in between two acrylic
plates. We used Visikol (Visiko Inc.) as the plant-
clearing agent, which has a refractive index
equivalent to plant tissue and makes the internal
refractive index uniform as it penetrates the interior
of the leaf. A uniform refractive index reduces
internal scattering and allows light to reach deeper
inside the plant tissue.
Figure 1: a) The configuration of the OCT system; b)
scanning of mounted transparent leaf (left) and probing of
leaves exposed to ozone (right); c) control box of the OCT
system.
Table 1: Specification.
Item specification
Center Wavelength
SLD Output
1310 nm
15 µW
FWHM 53 nm
Axial Resolution
Lateral Resolution
A-scan Rate
14.2 μm
10 µm
25 Hz
Average Times 16
Focal Length
NA
5.12 mm
0.13
Beam Diameter 0.65 mm
OCT Size 198 × 168 × 98 mm
Probe Size φ6 mm×9 mm
SLD
OS
Fiber coupler
Transparent leaves
Leaves exposed to ozone
Sample optical path
Reference optical path
Environmental Pollution Assessment with Indicator Plant Under Ozone Gas Atmosphere by Using OCT
35
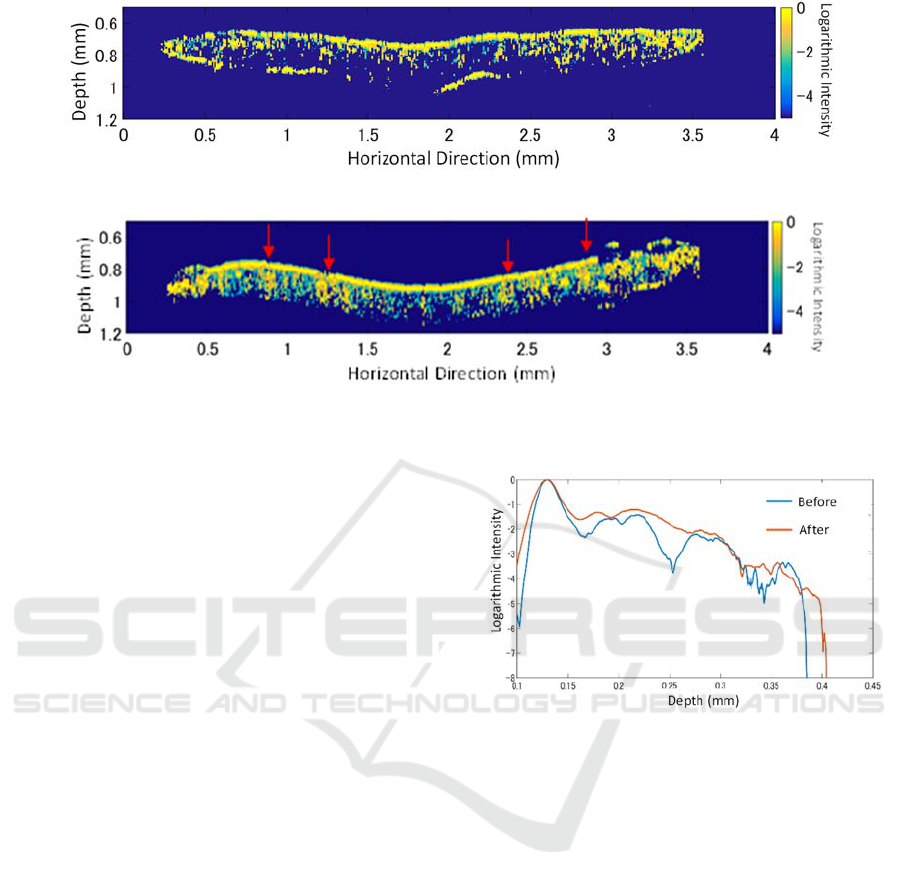
(a): Before transparency process.
(b): After transparency process.
Figure 2: Transparency of Dracena leaves.
In the case of white clover, measurements are made
without cutting the leaves and keeping the plants in
pots so that the temporal changes of the leaf’s internal
structure due to the effect of ozone gas can be
measured with the same leaf. White clover was grown
in an incubator at 20°C, and the ozone concentration
in the incubator was approximately 0.21 ppm. In
addition, the blue and red light of the cold-cathode
lamp is turned on 15 hours in a day. Leaf
measurements were taken every 12 hours after
exposure to ozone gas.
3 RESULTS
3.1 Transparency Process of Dracaena
Leaves
Figures 2 (a) and (b) show the results of Dracaena
leaves before and after the transparency process with
Visikol, respectively. The x-axis in the figure
represents the horizontal point (B-scan direction), and
the y-axis is the depth direction (A-scan). OCT light
is illuminated from the top of the leaf’s surface. The
intensity of interference light is indicated by the color
bar. Furthermore, the intensity of interference light is
obtained by subtracting the background light, and
performing focal length correction, distance squared
correction, and logarithmic transformation from the
obtained original OCT signals.
The result before the transparency process is shown
in Fig.2(a). The adaxial surface is visualized and a
part of the abaxial surface is visualized, too. In the
Figure 3: Averaged intensity change with depth in Figure 2.
leaf’s interior, the signal from the layer near the
adaxial surface is partially visualized, while the layer
on the abaxial surface is hardly visualized. In the
result after the transparency process with Visikol
shown in Fig. 2(b), the entire adaxial surface is
visualized, but the abaxial surface is not. In the leaf’s
interior, the signal is obtained throughout the leaf’s
full cross-section image. The area indicated by the red
arrow in Fig. 2(b) has the signal of the leaf veins, and
the signal is stronger than in the other areas. The
signal of the abaxial surface is only obtained at the
right end part, and the signal disappears to the left of
3.0 mm of the x-axis. Similarly, the signal also
disappears at both ends of the adaxial surface. This
disappearance of the abaxial surface is caused by
delaminating the surface due to the transparency
process.
The adaxial surface position in Fig. 2 is aligned at
the same depth, and then the intensity changes with
depth direction are averaged in the horizontal
direction. In this case, both ends of the leaf and the
PHOTOPTICS 2023 - 11th International Conference on Photonics, Optics and Laser Technology
36
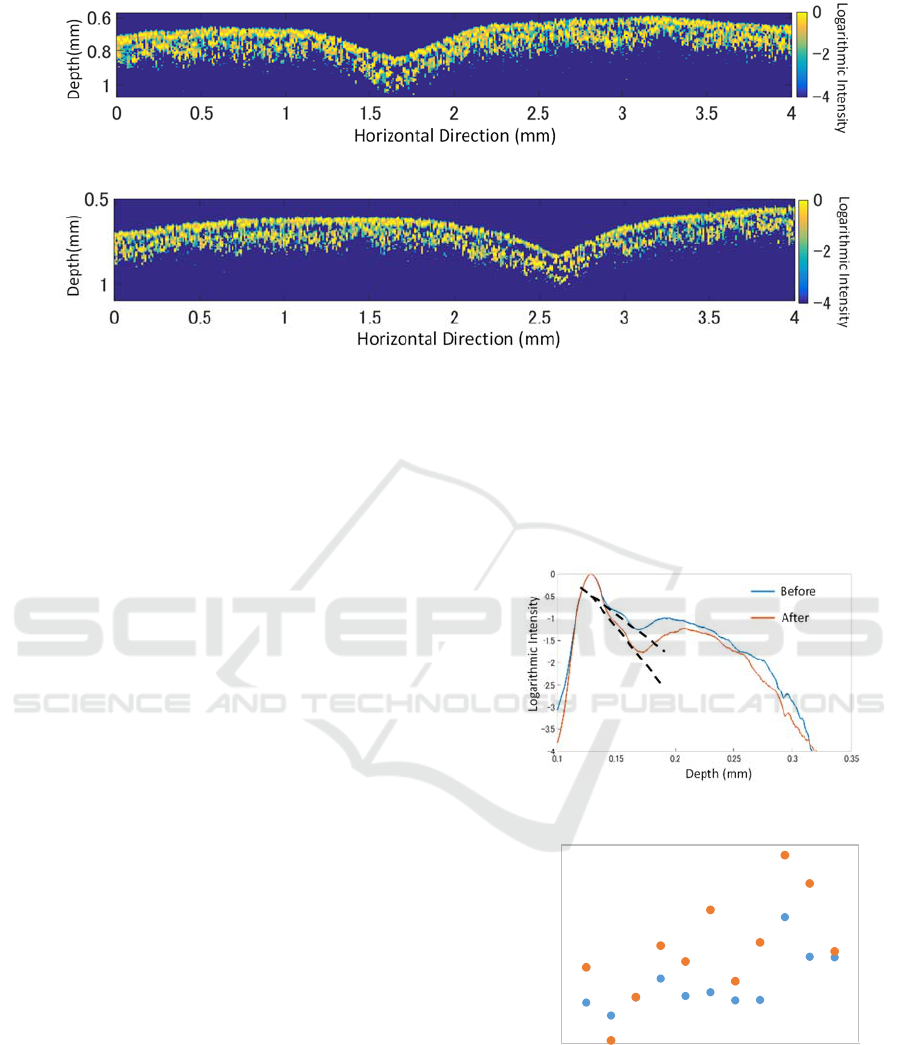
(a): Before exposure to the ozone gas.
(b): After exposure to the ozone gas.
Figure 4: White Clover under ozone gas.
veins are excluded from the averaging procedure.
Figure 3 shows these results. The y-axis shows the
average of the logarithmic intensity, and the x-axis
shows the depth. The blue line shows the results
before the transparency process, and the orange line
shows the results after the transparency process with
Visikol. Before the transparency process, the peak
intensities in the adaxial and abaxial surfaces can be
seen. After the transparency process, the abaxial
surface signal disappears. Inside peaks are obscure,
and its attenuation is monotonous.
The plant-clearing agent reduces the internal
refractive index differences. Since the plant-
clearing agent increases the light transmission of the
leaves’ interior, the veins’ location and thickness of
the layer become clear. In Fig.3, the transparency
process made the constant attenuation. Therefore,
the extinction coefficient can evaluate from the
leaf’s full cross-section signal. The use of the plnat-
clearing agent increases the OCT signal near the
abaxial axis side of the leaf. It can evaluate the
change of light transmission due to disease or
environmental stress in the field measurement.
3.2 Measurement of White Clover
Under Ozone Gas Atmosphere
Figure 4(a) shows the result before the white clover
was exposed to ozone gas, and Figure 4(b) shows
the result after 12 hours under ozone gas exposure.
In the same way as Fig.2, these figures show the
results of modified intensity by subtracting the
background light, applying focal length correction,
distance squared correction, and logarithmic
transformation from the obtained OCT signals. The
entire adaxial surface was visualized before and
after exposure to ozone gas, and the abaxial surface
was not visualized. The interface between the
epidermis layer and the palisade tissue became
clearer after exposure to ozone gas.
Figure 5: Intensity change with depth in Fig 4.
Figure 6: Extinction coefficient of multiple leaves in
palisade tissue.
Similar to Fig. 3, the surface in Fig. 4 is aligned
and the A-lines are averaged, except for the position
of the veins. Figure 5 shows these A-line average
results. The blue curve in the figure shows the result
5
10
15
20
25
30
024681012
Extinction Coefficient (/mm)
Leaf Number
Environmental Pollution Assessment with Indicator Plant Under Ozone Gas Atmosphere by Using OCT
37

before exposure to ozone gas, and the orange curve
shows the results after 12-hour exposure to ozone
gas. The interface of the palisade and spongy tissues
(at the 0.17 mm depth position in Fig.5) is almost
unchanged before and after exposure to ozone gas.
However, the attenuation of the signal in the
palisade tissue is increased by exposure to ozone
gas. The signal below the palisade tissue is
unchanged. The effect of ozone gas on plant leaves
appears in the palisade tissue (Thomson et al., 1966,
Hartikainen et al., 2020).
We measured 11 white clover leaves exposed to
ozone gas for 12 hours. Figure 6 shows extinction
coefficients in the palisade tissue. The extinction
coefficient is the slope of the black dotted line in Fig.
5. The x-axis in Fig. 6 indicates the leaf number, and
the y-axis shows the extinction coefficient. The blue
and orange circles in the figure represent the
measurement before and after 12 hours of exposure
to ozone gas. The two vertically aligned blue and
orange circles are the results of the same leaf.
The results show an increase in the extinction
coefficient of the palisade tissue in most leaves. The
mean value of the extinction coefficients before and
after exposure to ozone gas is 12.6 ± 3.42 [/mm] and
16.9 ± 6.2 [/mm], respectively. After exposure to
ozone gas, the extinction coefficient increased, and
the standard deviation is larger. A one-tailed t-test
was performed on this result as p = 0.003 (p<0.05).
These findings confirm that ozone destroys the
palisade tissue, and these changes can be evaluated
quantitatively from OCT signals.
4 CONCLUSIONS
In this study, we investigate the effect of the plnat-
clearing agent on the OCT images and the ozone gas
on the plant tissue to assess the environmental
contamination of ozone by OCT for the purpose of
future field measurements. The transparency
process increased and homogenized the internal
OCT signals from leaf measurements. The ozone
gas affects the epidermis tissue of white clover and
significantly increases the extinction coefficient
obtained by OCT in the palisade tissue.
Soaking the leaves in Visikol, the signal only
visible near the epidermis layer became uniformly
visible from the adaxial surface to the abaxial
surface. The position of the veins, which had
originally been unclear, could be confirmed, too. In
addition, the extinction coefficient inside the leaf
becomes uniform due to the decrease of the
refractive index difference by the penetration of the
plant-clearing agent. It makes it possible to evaluate
the change of extinction coefficient over the leaf’s
full cross-sectional signal. The transparency process
can confirm the disease or environmental stress,
which changes the transmittance of light. Since the
plant-clearing agent can make the leaf’s full cross-
sectional signal clear, diseases or environmental
stresses affecting the whole region of interest or
region of the leaf where we don’t know are affected
can be detected by the proposed method. Because
this method can detect by point measurement, OCT
can quantitatively and speedily assess
environmental conditions.
When plant leaves are exposed to high
concentrations of ozone gas, the palisade tissues are
destroyed. It has been difficult to clearly distinguish
these changes from mere OCT images. By
averaging each A-scan and comparing before and
after exposure to ozone gas, a clear difference in the
extinction coefficient in the palisade tissue appeared.
On the other hand, the spongy tissue was almost the
same before and after the ozone gas exposure. In
addition, we measured multiple leaves, which
confirmed that palisade’s extinction coefficients
predominantly changed before and after exposure to
the ozone gas by t-test.
In the leaf measurements with transparency
process and exposure to ozone, the changes can be
confirmed by A-scan, as shown in Figs. 3 and 5.
Thus, it is possible to confirm the effect of ozone
when white clover leaves from areas with high and
low concentrations of ozone are observed using
point measurements by this OCT method. Since this
result shows that our portable OCT can detect the
change in the leaf’s interior, OCT can estimate the
environmental conditions by measuring indicator
plants. In addition, the OCT with additional
functions can observe changes in the internal
structure of plants, and more accurate
environmental evaluation can be performed. For
example, polarized OCT, which can observe
separately p-polarization and s-polarization, can
capture changes in the internal polarization state of
plants, and b-OCT, which visualizes the speckle
variation with time, can evaluate plant activity
(Silva et al., 2021). If this method is established, this
portable OCT can be a useful instrument to assess
the identification or predict comprehensive
environmental stress.
PHOTOPTICS 2023 - 11th International Conference on Photonics, Optics and Laser Technology
38

ACKNOWLEDGEMENTS
This work was supported by JST, the establishment
of university fellowships towards the creation of
science technology innovation, Grant Number
JPMJFS2107.
REFERENCES
Masui, N. et al. (2021), Ozone disrupts the
communication between plants and insects in urban
and suburban areas: an updated insight on plant
volatiles, Journal of Forestry Research, 32, 1337-
1349
Graham, J.A. et al. (1998), Toxicology of ozone as
characterized by laboratory animals and extrapolated
to humans, Studies in Environmental Science, 72,
465-481
Kwartiningsih, E. et al. (2021), Chlorophyll Extraction
Methods Review and Chlorophyll Stability of Katuk
Leaves (Sauropus androgynous), Journal of Physics,
1858, 012015
Wijesinghe, R.E. et al. (2017), Optical coherence
tomography integrated, wearable (backpack-type),
compact diagnostic imaging modality for in situ leaf
quality assessment, Applied Optics, 56, 9, D108-
D1114
Lee, J. et.al (2019), On-Field In situ Inspection for
Marssonina Coronaria Infected Apple Blotch Based
on Non-Invasive Bio-Photonic Imaging Module,
IEEE Access, 7, 148684-148691 de Wit, J et.al (2020),
Quantification of plant morphology and leaf thickness
with optical coherence tomography, Applied Optics,
59, 33, 10304-10311
Villani, T.S. et.al (2013), An improved clearing and
mounting solution to replace chloral hydrate in
microscopic application, Applications in plant
sciences, 1(5), 1300016
Thomson, W.W. et.al (1966), EFFECTS OF OZONE ON
THE FINE STRUCTURE OF THE PALISADE
PARENCHYMA CELLS OF BEAN LEAVES,
Canadian Journal of Botany, 44, 12
Hartikainen, K. et.al (2020), Elevated temperature and
ozone modify structural characteristics of silver birch
(Betula pendula) leaves, Tree Physiology, 40, 4, 467-
483
Y.S.K De Silva et.al (2021), Positive and negative
phenotyping of increasing Zn concentrations by
Biospeckle Optical Coherence Tomography in
speedy monitoring on lentil (Lens culinaris) seed
germination and seedling growth, Plant Stress, 2,
100041.
Environmental Pollution Assessment with Indicator Plant Under Ozone Gas Atmosphere by Using OCT
39
