
NP-BERT: A Two-Staged BERT Based Nucleosome Positioning
Prediction Architecture for Multiple Species
Ahtisham Fazeel
1,2 a
, Areeb Agha
2 b
, Andreas Dengel
1,2 c
and Sheraz Ahmed
1 d
1
German Research Center for Artificial Intelligence, Kaiserslautern, Germany
2
Department of Computer Science, Technical University of Kaiserslautern, Germany
Keywords:
Nucleosome Position, DNA, Genomics, Language Models, Transformers, BERT, Masked Language
Modeling, Transfer Learning.
Abstract:
Nucleosomes are complexes of histone and DNA base pairs in which DNA is wrapped around histone proteins
to achieve compactness. Nucleosome positioning is associated with various biological processes such as DNA
replication, gene regulation, DNA repair, and its dysregulation can lead to various diseases such as sepsis, and
tumor. Since nucleosome positioning can be determined only to a limited extent in wet lab experiments, vari-
ous artificial intelligence-based methods have been proposed to identify nucleosome positioning. Existing pre-
dictors/tools do not provide consistent performance, especially when evaluated on 12 publicly available bench-
mark datasets. Given such limitation, this study proposes a nucleosome positioning predictor, namely NP-
BERT. NP-BERT is extensively evaluated in different settings on 12 publicly available datasets from 4 differ-
ent species. Evaluation results reveal that NP-BERT achieves significant performance on all datasets, and beats
state-of-the-art methods on 8/12 datasets, and achieves equivalent performance on 2 datasets. The codes and
datasets used in this study are provided in https://github.com/FAhtisham/Nucleosome-position-prediction.
1 INTRODUCTION
The organization of eukaryotic and prokaryotic life
is generally controlled by the presence and accessi-
bility of the genetic material inside the cells (Tsom-
pana and Buck, 2014). The genetic material is usu-
ally very long and is compacted by the presence of
specialized structures, nucleosomes. The nucleosome
is the core and fundamental unit of chromatin poly-
mer, which is formed by the combination of histone
proteins and DNA (Luger, 2003). Usually, there are
two copies of four different histones i.e., H2A, H2B,
H3, and H4, around which the DNA is wrapped. To
achieve a high degree of compactness and accessibil-
ity, 147-160 base pairs of DNA are wrapped around
a core octamer of histones, whereas the sequences
that are responsible to connect the nucleosomes are
approximately 20-30 bp in length and are often re-
ferred to as linker sequences. Furthermore, nucle-
osomes are considered the first organizational layer
a
https://orcid.org/0000-0002-7174-7676
b
https://orcid.org/0000-0003-2827-4129
c
https://orcid.org/0000-0002-6100-8255
d
https://orcid.org/0000-0002-4239-6520
of the eukaryotic genome, which lays the founda-
tion for chromatin fibers, topologically associated do-
mains (TADs), and active or inactive compartments
(Ulianov et al., 2016). A more comprehensive explo-
ration of the eukaryotic genetic material suggests that
the nucleosome positioning and higher-order chro-
matin structures act as control logic for DNA.
The packing of DNA around nucleosomes plays
important role in various processes like DNA repli-
cation, genome expression, DNA repair, and tran-
scription (Tsompana and Buck, 2014). Besides its
direct involvement, the genome-wide location of nu-
cleosomes is rudimentary for various biological pro-
cesses. For example, gene regulation is one of the
mechanisms that is influenced by its genome-wide
positioning, as the binding of protein for transcrip-
tion initiation is affected by the presence of nucle-
osomes. In addition, various studies have reported
a plethora of diseases associated with abnormal his-
tone modifications in the nucleosome structure, such
as sepsis, autoimmune diseases, thrombosis, cerebral
stroke, trauma, and tumors (Cho et al., 2004; Chen
et al., 2014).
Multiple experimental approaches are used
to identify or quantify nucleosome positioning,
Fazeel, A., Agha, A., Dengel, A. and Ahmed, S.
NP-BERT: A Two-Staged BERT Based Nucleosome Positioning Prediction Architecture for Multiple Species.
DOI: 10.5220/0011679200003414
In Proceedings of the 16th International Joint Conference on Biomedical Engineering Systems and Technologies (BIOSTEC 2023) - Volume 3: BIOINFORMATICS, pages 175-187
ISBN: 978-989-758-631-6; ISSN: 2184-4305
Copyright
c
2023 by SCITEPRESS – Science and Technology Publications, Lda. Under CC license (CC BY-NC-ND 4.0)
175

such as chromatin immunoprecipitation sequenc-
ing (ChiP-Seq) (Schmid and Bucher, 2007),
immunoprecipitation-chip (ChIP-chip) (Ozsolak
et al., 2007), assay for transposase-accessible chro-
matin with high-throughput sequencing (ATAC-Seq)
(Buenrostro et al., 2015), DNase-seq and FAIRE-seq,
and MNase-Seq(Chereji and Clark, 2018). Due to
the advent of next-generation sequencing methods,
multiple high-resolution genome-wide nucleosome
maps have been made available for multiple species,
such as Homo sapiens, Saccharomyces cerevisiae,
and Caenorhabditis elegans (Shtumpf et al., 2022).
In spite of the availability of large-scale datasets, the
determinants in the DNA sequences for nucleosome
positioning are not yet fully characterized. To
unveil such determinants and the understanding of
nucleosome positioning multiple approaches have
been proposed, yet more accurate tools/algorithms
can prove helpful in exploring the phenomenon of
nucleosome positioning, and the impact of gene
mutations on nucleosomes.
Existing studies opted for machine or deep
learning-based approaches to predict nucleosome po-
sitioning. Initially, a predictor iNuc-PseKNC was de-
veloped by Gou et al. for the classification of nu-
cleosome positioning (Peckham et al., 2007). Au-
thors converted discrete DNA sequences into statis-
tical vectors by incorporating the frequency of differ-
ent k-mers, ranging from k={1, ··· ,6}, and trained a
support vector machine (SVM) classifier on it. The
predictor proposed by Gou et al. managed to pro-
duce a reasonable performance on the dataset of Sac-
charomyces cerevisiae (Shtumpf et al., 2022). Chen
et al. proposed iNuc-PhysChem, where DNA se-
quences were first transformed into statistical vec-
tors based on 12 different physiochemical properties.
iNuc-PhysChem was evaluated against the genome of
Saccharomyces cerevisiae. In addition, the extension
of the work was done by incorporating deformation
energy for the prediction of nucleosome positioning
(Chen et al., 2016).
Cui et al. proposed a nucleosome positioning pre-
dictor namely, ZCMM (Cui et al., 2019). Authors
converted raw DNA sequences into statistical vec-
tors by incorporating Z-curve theory along with posi-
tion weight matrix (PWM). In addition, ZCMM used
SVM for classification of nucleosome positioning and
was trained and evaluated on the genomes of 3 dif-
ferent species, i.e, Homo sapiens (HS), Caenorhabdi-
tis elegans (CE), and Drosophila melanogaster (DM).
According to the performance evaluation of ZCMM,
it showed significant performance only across the
dataset of DM.
Gangi et al. proposed the deep learning predictor
DLNN, for the prediction of nucleosome positioning
(Di Gangi et al., 2018). The predictor was based on
one hot encoded sequence representation (OHE) for
the conversion of DNA sequences into statistical vec-
tors. The predictor proposed by them was based on
convolution and long short-term memory neural net-
works. DLNN was the first predictor that was evalu-
ated against 11 different datasets, belonging to diverse
species i.e., Homo sapiens (HM), Caenorhabditis ele-
gans (CE), Drosophila melanogester (DM), and Sac-
charomyces cerevisiae (YS).
Zhang et al. proposed a deep learning-based pre-
dictor namely, LeNup (Zhang et al., 2018). LeNup
made use of one hot encoding (OHE) to transform
DNA sequences into a statistical vectors and per-
formed classification by Google Inception and gated
convolutional neural network. In addition, LeNup
was evaluated on the genomic data of 4 different
species i.e., HM, CE, DM, and YS. Amato et al.
extended the idea of LeNup, and proposed another
nucleosome positioning predictor CORENup (Amato
et al., 2020). CORENup used OHE to represent DNA
nucleotides and used convolution neural networks and
long short-term memory units (LSTMs) for classifi-
cation. CORENup was evaluated on 10 diverse types
of benchmark datasets belonging to prior mentioned
species.
Han et al. proposed another deep learning-
based predictor namely, NP CBiR (Han et al., 2022).
NP CBiR exploited the lack of use of long-range
dependencies of the DNA nucleotides and designed
a predictor that incorporated contextual information
(embeddings) and nucleotide dependencies. The pre-
dictor was mainly based on two components, i.e.
embedding part that leads to the contextual infor-
mation and Bi-LSTM/Bi-GRU part that modeled the
long-range nucleotide dependencies. In particular,
NP CBiR followed the core concepts of Gangi et al.
(Di Gangi et al., 2018) to design a predictor that could
perform consistently well across various nucleosome
positioning datasets. NP CBiR was evaluated on 10
similar datasets that were provided in the study of
Gangi et al. (Di Gangi et al., 2018).
Taking into account the plethora of tools devel-
oped to predict nucleosome positioning, there are still
some challenges in terms of predicting nucleosome
positioning correctly. Firstly, existing predictors do
not have consistent performance across all the bench-
mark datasets for nucleosome positioning. In addi-
tion, these methods showed lower performance and
higher bias for positive and negative class samples.
Considering these limitations, the idea of predict-
ing nucleosome positioning is still considered crucial,
and there is a need for more robust tools to predict
BIOINFORMATICS 2023 - 14th International Conference on Bioinformatics Models, Methods and Algorithms
176

nucleosome positioning from the DNA sequences of
various species.
By contemplating the prior mentioned limitations,
the contributions of this study are multifarious and
listed below;
(I) We perform the classification of the benchmark
datasets by utilizing various feature extraction
methods, and a random forest (RF) classifier.
Then, we reason for the limited performance
of the statistical feature extraction methods by
visualizing them into the feature space.
(II) We pre-train and fine-tune the language model
(BERT) on the datasets of nucleosome posi-
tioning in three different settings and perform
evaluations on all the benchmark datasets.
(III) In addition, we propose a two-staged fine-
tuning mechanism for the pre-trained BERT
model and perform evaluation across all nucle-
osome positioning datasets.
(IV) We also present an ablation study to demon-
strate the performance gains obtained through
the two-stage fine-tuning as compared to
single-stage fine-tuning and MLM pre-training
settings.
(V) Finally, we compare the performance of the
proposed predictor (NP-BERT) with state-of-
the-art methods for nucleosome position pre-
diction, and evaluation results reveal that the
proposed (NP-BERT) achieves superior per-
formance over state-of-the-art methods across
8/12 datasets and shows equivalent perfor-
mance on 2 datasets.
2 BACKGROUND
The working paradigms of various DNA feature ex-
traction methods, transfer learning, BERT, and LSTM
are briefly discussed in this section.
2.1 Feature Extraction Methods For
DNA Sequences
Machine or deep learning models can not operate
on textual data due to their inherent dependency
on statistical vectors. Various DNA feature extrac-
tion methods are used to convert DNA sequences
into numerical vectors by retaining useful informa-
tion. These methods convert DNA sequences into sta-
tistical vectors by either computing the frequencies
of nucleotides or physicochemical properties based
on the correlation among nucleotides. DNA feature
extraction methods can be seen into three different
categories i.e., mathematical, gap-based, and phys-
iochemical properties-based methods (Chen et al.,
2021) and PyFeat (Muhammod et al., 2019).
As DNA sequences are comprised of nucleotides,
in the simplest way statistical representations of the
DNA sequences are generated by computing the dis-
tribution of k-mers (a combination of nucleotides).
Similarly, accumulated nucleotide frequency (ANF)
generates statistical representations of the DNA se-
quences by computing position-specific densities of
nucleotides. Pseudo-K-tuple nucleotide composition
(PseKNC) incorporates the distribution of k-mers of
various sizes to generate statistical representations of
the DNA sequences.
Certain feature extraction methods rely on the oc-
currence frequencies of nucleotides, i.e., ATCG ra-
tio, GC content. ATCG ratio generates 1-dimensional
representations of DNA sequences, by computing the
total occurrences of A and T, and then by normaliz-
ing them with the total occurrences of G and C. Sim-
ilarly, GC content produces statistical representations
by computing the ratio among total occurrences of nu-
cleotides G and C to the total occurrences of all nu-
cleotides. Cumulative skew is based on AT and GC
skew, where AT skew is the ratio of the difference be-
tween total occurrences of A and T to the sum of their
total occurrences, and GC skew can be computed in a
similar way but with the occurrences of G and C nu-
cleotides. A complex network follows the principle
of word2vec algorithm, in which an undirected graph
is constructed to represent the relations among the k-
mers. Further, an adjacency matrix is generated and
various topological measures are applied to generate
statistical representations of the DNA sequence i.e.,
minimum degree (MIN), average short path length
(ASPL), etc.
There are several other DNA feature extraction
methods that also incorporate the gaps along with the
k-mers of the DNA sequence i.e. gap k-mers A-G,
and A-C, etc. Such methods work in a three-step
process, first, a dictionary of the k-mers is generated
for size k, then k-mers are generated from the orig-
inal sequences. In the final step, by comparing and
counting the k-mers with both of these dictionaries,
statistical vectors are generated for DNA sequences.
Such methods include MonoMonoKgap, MonoDiK-
Gap, DiMonoKGap and so on which differ only in
terms of k-mers sizes and the number of gaps.
Inspired by the chemical and biological proper-
ties of DNA nucleotides, different methods tend to
encode such information in statistical vectors in an
efficient manner. Such physiochemical properties in-
clude twist, roll, bend, hydrophobicity, electron-ion
NP-BERT: A Two-Staged BERT Based Nucleosome Positioning Prediction Architecture for Multiple Species
177

potential, and polarity. The values of each nucleotide
against each property have been computed experi-
mentally and are provided in the literature. Electron-
ion interaction pseudopotentials (EIIP) transforms
raw sequences into statistical vectors by supplanting
each nucleotide with the pseudo-potentials specific
float value. PseEIIP is an extension of EIIP that com-
putes the mean distribution of free electron charge by
generating 3-mers of the sequence and adding pseu-
dopotentials for each nucleotide. The k-mers are first
generated, then in each k-mer, the pseudopotential
values corresponding to all nucleotides are added to
represent the k-mers with their statistical properties.
In Dinucleotide based auto covariance (DAC), sta-
tistical vectors of DNA sequences are generated in 3
steps. First, pairs of nucleotides are generated on the
basis of the lag value. Then two dinucleotide pairs
are selected and physiochemical information is in-
corporated by taking the difference of dinucleotide
pairs physiochemical values with the mean physio-
chemical values for all nucleotides. In the third step,
such values are computed for all the nucleotide pairs
and summed up, and then normalized with the dif-
ference in length of the sequence and lag value. In
this way, for each physiochemical property, there is
once a scalar value, and N×LAG dimensional vec-
tor is formed. Similarly, dinucleotide-based cross-
covariance (DCC) follows similar steps and differs
from DAC in one way. It compares two different
physiochemical indexes for dinucleotides pairs. Fur-
thermore, similar steps are modified along with some
additional steps in other feature extraction methods
such as, (TCC) and tri-nucleotide-based auto-cross
covariance (TACC), Pseudo dinucleotide composition
(PseDNC) and so on.
2.2 Transfer Learning
Transfer learning refers to the idea of using the infor-
mation learned from a model developed for one task
on a different yet related task. This leads to signifi-
cant performance gains, and better generalization in
spite of having a limited amount of training samples
(Koumakis, 2020). Transfer learning can be done in
two different ways i.e., supervised training, where a
model is trained along with the labels, and unsuper-
vised where the model is trained without the labels.
Formally, transfer learning considers a source do-
main D
S
= {X ,P(X )}, and source task T
S
, a target do-
main D
T
= {X ,P(X)} and a target task T
T
. The ob-
jective of transfer learning is to learn the target condi-
tional probability distribution P(Y
T
|X
T
) from the tar-
get domain D
T
with the features learned from D
S
and
T
S
.
2.3 Language Modeling and
Bidirectional Encoder
Representation From Transformers
For NLP tasks, word embeddings are commonly used
from larger pre-trained models for classification pur-
poses (Mikolov et al., 2013). Word embedding meth-
ods learn the contextual and syntactic relations of
words in a defined contextual window. In particu-
lar, many word embedding methods are used, such
as global vectors for word representations (Glove)
(Sakketou and Ampazis, 2020), common bag of
words (CBOW) (Word2vec and FastText), and skip-
gram model. Prior mentioned methods can be seen
in two main groups i.e., contextualized (W2vec), and
non-contextualized (Glove). Moreover, the concept
of self-attention and transformers opened new ven-
tures for more accurate predictions for natural lan-
guage tasks. The open-AI GPT model is based on
the decoder of the transformers, yet the embeddings
generated are just unidirectional (Floridi and Chiri-
atti, 2020). In comparison, BERT (Devlin et al., 2018)
is only based on the encoders where multiple trans-
former encoders are stacked on each other, and the
working paradigm of an encoder can be seen in 3
main steps. In the first step, word piece tokeniza-
tion is done on the input sentence and then the input
embedding is generated by incorporating three differ-
ent embeddings namely, token and segment embed-
dings, and positional encoding. In token embeddings,
each word or token is assigned a 768-dimensional
vector. Segment embeddings are used in the next sen-
tence prediction-based pre-training where the tokens
belonging to the first sentence are assigned a 0 in-
dex and for the second sentence 1 is used. As BERT
is able to process the whole sentence at once, there-
fore positional information related to each word is ob-
tained by sinusoidal and cosine waves in order to fuse
word order information. To learn the word associa-
tions, BERT utilizes the concept of multi-head atten-
tion where the first 3 different matrices are generated,
query, key, and value. They are passed to a function
such that attention filter could be learned, as shown
in equation 1. This step is followed by a skip con-
nection along with a layer normalization step and a
feed-forward layer.
Attention(Q,K,V ) = so f tmax
QK
T
√
d
k
V (1)
The pretraining of BERT is performed in an un-
supervised or self-supervised manner in two differ-
ent ways i.e., masked language modeling (MLM) and
next-sentence prediction. In masked language mod-
eling 15% of total tokens are masked in a sentence,
BIOINFORMATICS 2023 - 14th International Conference on Bioinformatics Models, Methods and Algorithms
178
DATA COLLECTION
4-Fold Training Dataset
Nucleosome vs Linker Sequences
1-Fold Testing Dataset
Nucleosome vs Linker Sequences
Check Dataset
Similarity
PSi-CD-HIT
Literature/
Databases
Individual
Dataset
12
Benchmark
Datasets
1
st
Stage Training
Training Dataset
Organism X
SIGMOID
NUCLEOSOME LINKER
2
nd
Stage Training
LSTM
LSTM
NUCLEOSOME LINKER
SIGMOID
EVALUATION
FINAL MODEL
Training Dataset
Organism Y
FEATURE EXTRACTION
>Nuc_Pos_Drosophila_1
GCATGCATGCTAGCTAGCTGAACGTAGCTGA..........CAGTCG
GCA
TGC
ATG
CTA
GCT
AGC
TGA
CTG
ACA
GTC
ENCODER
ENCODER
ENCODER
ENCODER
ENCODER
ENCODER
BERT OUTPUTLAST LAYER'S EMBEDDING
BERT
EMBEDDINGS
1
2
3
4
5
6
7
10
11
12
....
1
2
9 10 11
12
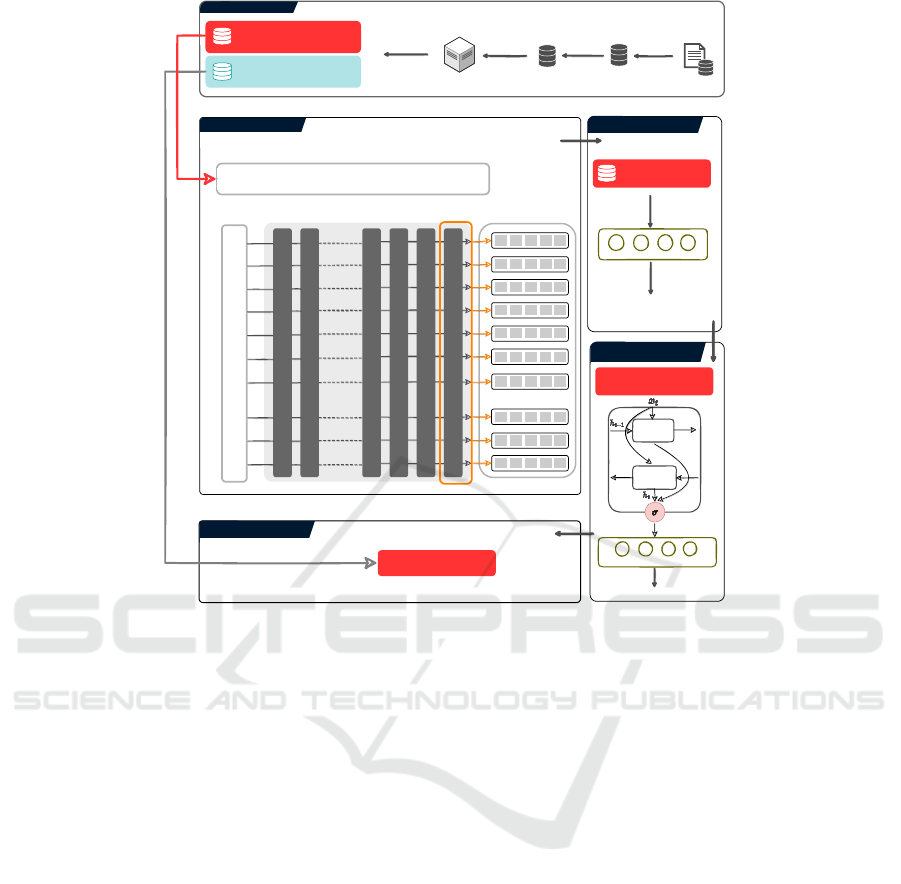
Figure 1: Overall methodology of the proposed study.
where out of total masked tokens 80% of the tokens
are replaced with [MASK], 10% are replaced with
a random token, and 10% tokens remain unchanged.
Due to the efficient use of attention mechanisms and
its training strategies, BERT obtained state-of-the-
art results in multiple natural language tasks, such
as speech recognition, text classification, question-
answering, and text summarization.
Google AI has released multiple versions of BERT
model, i.e., BERT-base with 12 encoder layers, 768
hidden units, and 12 attention heads. Similarly,
BERT-large has 24 encoder layers, 1024 hidden units,
and 16 attention heads. Similar models were used and
pre-trained on the human genome by Ji et al, (Ji et al.,
2021).
2.4 Long Short Term Memory (LSTM)
Long Short Term Memory (LSTMs) are a type of re-
current neural network (RNNs) that tackle the prob-
lems of long-range sequence dependencies in natural
language data (Di Gangi et al., 2018). LSTMs are
comprised of repeating units or cells, which contain
three different gates, i.e., input gate, forget gate, and
output gate (Yu et al., 2019). These gates are depen-
dent on their inputs, and hidden states followed by a
non-linear activation i.e., tanh or sigmoid.
The forget gate receives the current input x
t
, and
hidden state of the previous LSTM unit h
t−1
. This in-
formation is passed through a sigmoid function that
assigns a higher probability to the information that is
crucial and vice versa. Similarly, the input gate uses
sigmoid function to keep the important and relevant
information, followed by a tanh activation which nor-
malizes the inputs into a range of -1 to 1. The addi-
tion of forget and input produce the hidden state of the
LSTM unit h
t
. The output gate is also comprised of
sigmoid and tanh activation, where a point-wise mul-
tiplication is applied on the hidden state and normal-
ized inputs. LSTM efficiently tackles the long-range
dependency problem, by sharing the hidden and cell
state information with its underlying units.
3 NP-BERT: THE PROPOSED
APPROACH
Figure 1 shows the complete working paradigm of
NP-BERT for nucleosome positioning prediction.
NP-BERT is comprised of two main components i.e.
a backbone and a head. The backbone is based
NP-BERT: A Two-Staged BERT Based Nucleosome Positioning Prediction Architecture for Multiple Species
179

on a BERT model which is pre-trained on the hu-
man genome sequences with the length of the se-
quences between 5 and 510 with 3-mer of nucleotides.
Whereas, in the head of the overall architecture, a
bidirectional long short-term memory neural network
or a fully connected layer is used for the classification.
First, 12 different benchmark datasets are col-
lected from different sources and studies. Sec-
ondly, these datasets are passed through PSI-CD-HIT
(Huang et al., 2010) to find the redundant sequences
among all the datasets. The redundancy is checked
in order to avoid any bias during the two-stage fine-
tuning of NP-BERT. Then the datasets are encoded
and passed through the BERT backbone which has
12 encoder layers, to obtain statistical representations.
These representations are taken from the last encoder
layer of BERT and passed through a classifier for the
nucleosome positioning prediction. In this phase, a
two-stage fine-tuning strategy is opted to increase the
predictive capability of the model. The head of the
overall setup changes at both steps of fine-tuning i.e,
at the first stage a fully connected layer is used, and
in the second stage LSTM and a fully connected layer
are used in the head. The fine-tuning process of NP-
BERT is illustrated in Figure 2.
The overall architecture is trained with a two-stage
fine-tuning process. Consider, M as a pre-trained
model, that has been already trained in an unsuper-
vised manner on the DNA sequences of the human
genome. We take a dataset, D
1
from the set of nu-
cleosome positioning datasets and fine-tune the pre-
trained model M on it, which can be considered the
fine-tuned model M
1
for D
1
. We do fine-tuning of
the pre-trained model M individually on all the nu-
cleosome positioning datasets D = {D
1
,D
2
,··· , D
12
}
such that model M
1
is a fine-tuned model only on nu-
cleosome positioning dataset D
1
, model M
2
is a fine-
tuned model on nucleosome positioning dataset D
2
,
and so on. This first fine-tuning produces 12 differ-
ent models, i.e., M = {M
1
,M
2
,M
3
,··· , M
12
} that are
fine-tuned on individual datasets separately.
At the second stage of fine-tuning, we take again
a dataset D
i
and 11 out of 12 fine tuned-models such
that the fine-tuned model M
i
has not seen the nucle-
osome positioning dataset D
i
. So for dataset D
1
, 11
models will be taken i.e., M = {M
2
,M
3
,··· , M
12
}.
For D
1
, model M1 is not taken as it is already fine-
tuned on this dataset, and performing evaluation us-
ing this model will lead to biased results. Similarly,
for D
2
, M = {M
1
,M
3
,··· , M
12
} are taken and so on
for the other datasets. At this point, these models
are fine-tuned and evaluated once again. On the ba-
sis of maximum performance scores of various eval-
uation measures, a model is picked for that specific
dataset. For example, for dataset D
1
, out of 11 models
M = {M
2
,M
3
,··· , M
12
}, M
3
leads to the maximum
performance, thus it is considered the final model for
that specific dataset. The same process is repeated for
the other datasets which result in 12 models for nu-
cleosome positioning datasets.
Table 1: A toy example of two-stage fine-tuning on the HM
dataset.
Model Dataset 1st-Stage Dataset 2nd-Stage Accuracy AUC-ROC
G1
M
1
DM HM 83.94 91.13
M
2
CE HM 88.33 94.41
M
3
HM HM Dropped Dropped
M
4
YS HM 87.59 94.40
G2
M
5
DM-5UTR HM 86.51 92.06
M
6
DM-LC HM 50.0 54.86
M
7
DM-PM HM 50.04 49.44
M
8
HM-PM HM 87.77 92.88
M
9
HM-LC HM 50.04 49.91
M
10
HM-PM HM 50.04 56.41
M
11
YS-PM HM 82.42 89.12
M
12
YS-WG HM 50.04 50.0
To understand dual-stage fine-tuning, we incorpo-
rate an experimental example here over the dataset of
the human genome (HS). Consider that we pre-trained
a BERT-based model on the 3-mer of human genome
sequences as mentioned earlier. This specific model
is fine-tuned individually on the datasets of nucleo-
some positioning which produces 11 models, where
the fine-tuned model on the HS datasets is discarded
to avoid any bias and overfitting on HS dataset. All
the models are passed through the second stage of
fine-tuning where the models are fine-tuned and eval-
uated on the HS dataset. The performance of such
models is shown in table 1 based on the accuracy and
AUC-ROC values (for details see evaluation).
It can be seen from the table 1 that for dataset
HM, fine-tuning is performed on 11 different datasets.
Where among all the models and combinations of
fine-tuning, the combination CE-HM yields maxi-
mum performance in terms of AUC-ROC and ac-
curacy. To avoid any bias and overfitting from the
model, similar datasets are not used in the 1st and 2nd
stages of fine-tuning, which is also shown in the table
1, where the HM-HM combination is discarded.
3.1 Benchmark Datasets
In order to develop and evaluate nucleosome position-
ing predictors, several datasets have been developed
in the existing studies (Di Gangi et al., 2018; Am-
ato et al., 2020; Han et al., 2022). We have collected
12 different datasets from the study of Gangi et al.
(Di Gangi et al., 2018). The datasets belong to 4 dif-
ferent species, i.e., Homo sapiens (HM), Caenorhab-
BIOINFORMATICS 2023 - 14th International Conference on Bioinformatics Models, Methods and Algorithms
180
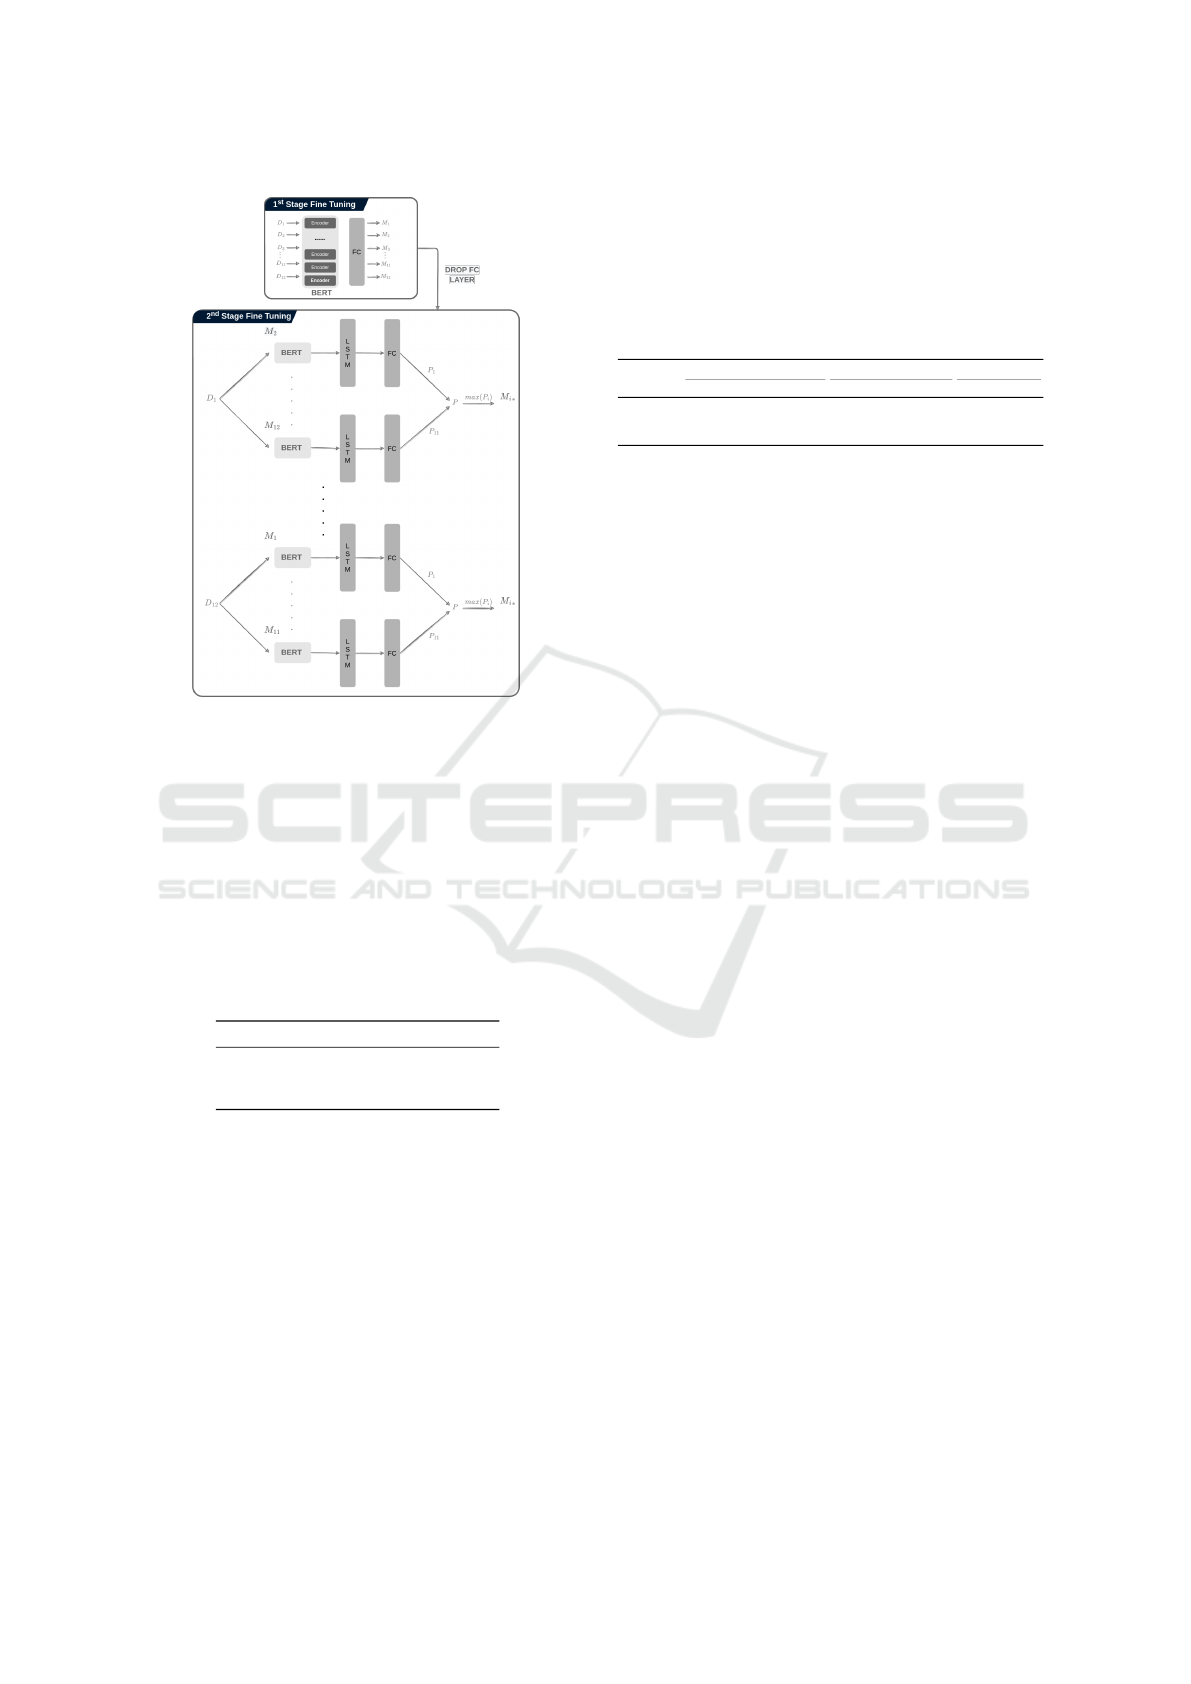
Figure 2: Fine-tuning strategy for the BERT model at two
different stages.
ditis elegans (CE), Drosophila melanogester (DM),
and Saccharomyces cerevisiae (YS).
The datasets are divided into two main groups i.e.,
G1, and G2. The first group has four datasets namely,
HM, DM, CE, and YS. The statistics of the datasets
from G1 are given in Table 2. The datasets of group 1
are balanced where the number of positive samples is
close to the number of negative samples.
Table 2: Statistics of 4 different benchmark datasets from
group 1.
Sequences HM DM CE YS
Positive 2273 2900 2567 1740
Negative 2300 2850 2608 1880
Total 4573 5750 5175 3620
The G2 contains 8 different datasets belonging to
3 species namely, Homo sapiens (HM), Drosophila
melanogester (DM), and Saccharomyces cerevisiae
(YS), and were originally developed by Liu et al. (Liu
et al., 2014). Group 2 contains a variety of datasets
from each specie, the largest chromosome (LC), pro-
moter (PM) and 5’UTR exon region (5U) sequences
from DM and HM, whole genome (WG), and pro-
moter (PM) sequences of YS. The statistics of the
datasets from G2 are given in table 3. The datasets in
group 2 are highly imbalanced in nature which makes
it more challenging to design a robust, and general-
izable that can perform consistently on both sets of
datasets. In addition, the datasets in group 1 and
2 have DNA sequences of 147 nucleotide bases, or-
ganized in two classes i.e., nucleosome forming se-
quences (positive) and nucleosome inhibiting linker
sequences (negative).
Table 3: Statistics of 8 different benchmark datasets from
group 2 belonging to three different species.
Sequences
HM DM YS
LC PM 5U LC PM 5U WG PM
Positive 97209 56404 11769 46054 48251 4669 39661 27373
Negative 65563 44639 4880 30458 28763 2704 4824 4463
Total 162772 101043 16649 76512 77014 7373 44485 31836
3.2 Implementation Details and
Hyper-parameters
The statistical DNA feature extraction methods are
implemented in Python using iLearnPlus library
(Chen et al., 2021). Machine learning classifiers
are implemented by utilizing scikit-learn (Pedregosa
et al., 2011). BERT-based models are also imple-
mented in Python using the Pytorch library. More-
over, different hyperparameter combinations are used
to find out the optimal set of hyperparameters, i.e.,
weight decay, epochs, and learning rate, for the train-
ing and fine-tuning of the BERT models at the first
and second stages.
In the pre-training of BERT, the model is trained
for 20000 steps with an attention dropout probabil-
ity of 0.1, intermediate size 3072, layer normalization
epsilon 1e
−12
, 12 attention heads in each BERT en-
coder, and embedding size 512. Adam is used as an
optimizer with a weight decay of 0.01, beta 0.9, and
0.098 with a learning rate of 4e
−4
.
In the first fine-tuning stage, the models are
trained with a batch size of 32, over 5 epochs with
a learning rate of 2e
−4
with a hidden dropout of 0.1,
weight decay 0.01, and Adam is used as an optimizer.
At the second stage of fine-tuning, the models are
fine-tuned over a batch size of 32, along with a learn-
ing rate of 2e
−5
with Adam as an optimizer across 3
epochs. In both of the fine-tuning stages, binary cross
entropy is used as the loss function.
4 EVALUATION METRICS
Following the evaluation criteria of existing nucleo-
some positioning predictors, to evaluate and perform
a performance comparison of the proposed predictor
with existing nucleosome positioning predictors, we
analyze the performance of the proposed predictor
by using 5 different evaluation measures. i.e, accu-
racy (ACC), sensitivity (SN), specificity (SP), Math-
NP-BERT: A Two-Staged BERT Based Nucleosome Positioning Prediction Architecture for Multiple Species
181

ews correlation coefficient (MCC), and area under the
receiver operating characteristic (AU-ROC) (Amato
et al., 2020; Han et al., 2022; Di Gangi et al., 2018).
ACC is the proportion of correctly predicted sam-
ples over all the predicted samples. SP is the fraction
of truly predicted negative samples over all the pre-
dictions of the negative samples. Similarly, sensitivity
(SN) is the ratio of the correct predictions made on the
positive class samples to the sum of correct and false
predictions made on the positive class samples. Area
under receiving operating curve (AU-ROC) measures
performance score using true positive and true nega-
tive rates calculated at various thresholds. Precision
(PR) is the ratio of true predictions made on the posi-
tive class samples over all the positive predicted sam-
ples. MCC computes the performance score of a clas-
sification model, by considering the real and predicted
classes of all the samples. The mathematical equa-
tions of aforestated evaluation measures are given as,
f (x) =
ACC = (T
P
+ T
N
)/(T
P
+ T
N
+ F
P
+ F
N
)
Specificity (SP) = T
N
/(T
N
+ F
P
)
Sensitivity (SN) or Recall (R) = T
P
/(T
P
+ F
N
)
Precision (P) = T
P
/(T
P
+ F
P
)
True Positive Rate (TPR) = T
P
/(T
P
+ F
N
)
False Positive Rate (FPR) = F
P
/(T
N
+ F
P
)
MCC = T
P
×T
N
−F
P
×F
N
/E
E =
p
(T
P
+ F
N
)(T
P
+ F
P
)(T
N
+ F
P
)(T
N
+ F
N
)
(2)
5 RESULTS
This section briefly illustrates the performance of
three different experimental settings of the BERT
models and explains which setting produces the max-
imum performance for nucleosome positioning pre-
diction. On the basis of maximum performance from
these settings, we perform a comparative performance
study of the proposed and existing approaches across
12 different nucleosome positioning datasets. In ad-
dition, this section comprehensively explains the per-
formances of various DNA feature extraction methods
and their intrinsic analyses across a randomly selected
dataset from nucleosome positioning datasets.
5.1 Ablation Study
We categorize the experimentation of NP-BERT into
three different settings i.e., i) NP-BERT (MLM Train-
ing) ii) NP-BERT (Single Stage), and iii) NP-BERT
(Two Stage). An ablation study is then carried out to
demonstrate the performance enhancements obtained
through a two-stage fine-tuning of NP-BERT.
Table 4: Performance values of 3 NP-BERT settings over
nucleosome positioning datasets.
Dataset/Species Method SN SP PR ACC MCC AUC-ROC
Group 1
CE
NP-BERT (MLM) 87.2 91.2 91.1 89.2 78.6 95.0
NP-BERT (Single stage) 86.12 91.47 91.30 88.80 76.92 94.28
NP-BERT (Two stage) 91.8 92.1 91.8 90.5 80.5 95.8
DM
NP-BERT (MLM) 79.2 87.5 86.4 83.5 67.2 90.9
NP-BERT (Single stage) 84.8 84.9 84.9 84.8 69.9 92.9
NP-BERT (Two stage) 84.8 85.6 85.3 85.1 70.5 92.4
YS
NP-BERT (MLM) 99.9 99.8 99.8 99.8 99.7 100
NP-BERT (Single stage) 99.8 99.91 99.91 99.9 99.82 100
NP-BERT (Two stage) 100 99.8 99.8 100 99.82 100
HM
NP-BERT (MLM) 79.3 86.8 86.5 83.1 66.9 91.4
NP-BERT (Single stage) 90.30 86.59 87.12 88.01 69.09 91.17
NP-BERT (Two stage) 88.3 88.4 88.5 88.3 76.8 94.4
Group 2
DM-5U
NP-BERT (MLM) 33.7 91.0 74.8 69.9 33.0 68.7
NP-BERT (Single stage) 42.2 84.9 62.6 69.2 30.4 68.2
NP-BERT (Two stage) 41.1 85.8 63.8 69.5 30.8 68.3
DM-PM
NP-BERT (MLM) 40.5 93.4 78.4 73.6 40.5 73.2
NP-BERT (Single stage) 47.0 88.0 71.6 72.7 39.7 72.2
NP-BERT (Two stage) 40.1 93.6 80.4 73.6 42.0 73.7
DM-LC
NP-BERT (MLM) 33.9 95.2 82.7 70.8 38.5 71.6
NP-BERT (Single stage) 48.2 85.5 69.0 70.6 36.8 71.3
NP-BERT (Two stage) 43.1 90.0 75.2 71.3 38.7 72.0
HM-5U
NP-BERT (MLM) 35.3 95.7 78.7 78.0 41.5 75.2
NP-BERT (Single stage) 55.4 92.3 75.4 81.0 52.8 80.0
NP-BERT (Two stage) 51.6 94.3 80.0 81.8 53.4 80.2
HM-LC
NP-BERT (MLM) 71.8 96.6 93.4 86.6 72.5 91.7
NP-BERT (Single stage) 85.4 94.4 91.2 90.8 80.8 94.8
NP-BERT (Two stage) 83.7 96.1 93.7 91.1 81.7 95.1
HM-PM
NP-BERT (MLM) 70.2 89.8 84.4 81.1 61.8 86.6
NP-BERT (Single stage) 74.5 91.5 87.0 83.5 69.0 89.6
NP-BERT (Two stage) 75.8 92.4 89.1 85.1 70.1 90.4
YS-PM
NP-BERT (MLM) 53.0 89.7 84.9 91.5 62.5 92.3
NP-BERT (Single stage) 61.3 97.6 81.1 92.4 66.0 93.1
NP-BERT (Two stage) 63.1 97.2 79.6 92.4 66.3 93.5
YS-WG
NP-BERT (MLM) 62.1 96.6 71.1 92.8 61.7 92.3
NP-BERT (Single stage) 62.0 97.6 77.4 93.0 65.3 93.7
NP-BERT (Two stage) 60.3 98.4 82.7 94.3 67.2 94.5
5.1.1 NP-BERT (MLM Training)
The very first setting is comprised of a backbone of
BERT model for extraction of statistical representa-
tions from the DNA sequences and the head is a lin-
ear or fully connected layer with a sigmoid function
for the purpose of classification. Initially, the BERT
backbone is trained in a self-supervised manner with
masked language modeling. The training is done on
the nucleosome positioning datasets, by combining
all 12 benchmark datasets to form a larger and more
appropriate dataset for BERT pre-training. After the
pre-training, NP-BERT is then fine-tuned on the indi-
vidual nucleosome positioning datasets and thus eval-
uated on the basis of 5-fold validation.
BIOINFORMATICS 2023 - 14th International Conference on Bioinformatics Models, Methods and Algorithms
182

5.1.2 NP-BERT (Single Stage)
In the second setting, a pre-trained BERT is used to
extract the statistical representations from the DNA
sequences, coupled with a linear layer for the purpose
of classification. The pre-trained DNABERT is then
fine-tuned on the datasets of nucleosome positioning
separately.
5.1.3 NP-BERT (Two Stage-Finetuning)
In the third setting, a pre-trained BERT model is fine-
tuned in two different stages. In the very first stage,
the model is fine-tuned on one dataset and in the sec-
ond stage, it is fine-tuned and evaluated on the second
dataset. Based on maximum performance such com-
binations are selected for further performance com-
parison and analyses.
Table 4 illustrates the performance scores across
6 different evaluation measures of three different NP-
BERT settings on 12 different nucleosome position-
ing datasets. Setting 2 (Single stage fine tuning) leads
to minimum performance across the CE in terms of
accuracy 88.80% and AUC-ROC 94.28%. Whereas,
setting 1 (MLM training) achieves higher perfor-
mance scores as compared to setting 2, with an accu-
racy score of 89.2%, and AUC-ROC score of 95.0%
over CE. Overall, setting 1 achieves better perfor-
mance scores as compared to setting 1 with a gain of
1.2% across accuracy and 0.72% across AUC-ROC.
Setting 3 yields maximum performance scores over
the CE dataset as compared to setting 1 and setting
2. Overall, it obtains performance enhancements of
1.3% over the accuracy and 0.8% over AUC-ROC in
terms of CE as compared to setting 1.
Over HM dataset, setting 1 produces the low-
est performance scores as compared to the other set-
tings i.e., 83.1% accuracy and 91.4% AUC-ROC. In
comparison, setting 2 outperforms setting 1 across
performance scores related to 4 different evaluation
measures, for instance, 4.91% in terms of accuracy.
Setting 3 obtains the maximum performance scores
across 5 different evaluation measures as compared
to setting 2 i.e., 0.3% in terms of accuracy and 3.23%
over AUC-ROC. For HS dataset, setting 3 shows more
robust and generalizable performance due to no dif-
ference in specificity and sensitivity scores, as com-
pared to setting 1 and 2 i.e., 7.5% and 3.71%.
On the dataset of DM, setting 3 shows maximum
performance scores across accuracy 85.1%, MCC
70.5%, and sensitivity 84.8%. In comparison setting 2
achieves comparable performance to setting 3, which
is better as compared to setting 1 across MCC, AUC-
ROC, accuracy, and sensitivity. Whereas, across the
dataset of YS, all three settings lead to similar per-
formance over all the evaluation measures. Overall
across G1 datasets, except for setting 1, both settings
2 and 3 show better generalizability and robustness
for the prediction of samples belonging to positive
and negative classes, whereas setting 3 achieves the
best and maximum performance on all the datasets.
On the other hand, to validate the claim that set-
ting 3 is the best among all for nucleosome position-
ing prediction, the evaluation is also performed on 8
different datasets from G2 through 5-fold validation.
For DM in G2, setting 1 achieves better performance
scores across accuracy and AUC-ROC only over DM-
5U dataset with scores of 69.9% and 68.7%, with per-
formance margins across accuracy and AUC-ROC of
0.4% respectively. For DM-LC, setting 3 outperforms
setting 1 and setting 2 across accuracy and AUC-ROC
i.e., 71.3% and 72.0%, with a gain of 0.5% across
accuracy, and 0.4% over AUC-ROC. Similarly, set-
ting 1 and 3 show similar performance over DM-PM
across accuracy i.e., 73.6%, yet setting 3 achieves bet-
ter AUC-ROC with a gain of 0.5%.
Across the datasets of YS, setting 3 achieves
maximum accuracy and AUC-ROC. For instance, it
achieves accuracy and AUC-ROC scores of 92.4%
and 93.5%. Similarly, over YS-WG dataset setting
3 obtains maximum performance across accuracy and
AUC-ROC i.e., 94.3% and 94.5%, which are 1.3%
and 0.8% better than the maximum accuracy and
AUC-ROC scores from setting 1 and setting 2.
Over HM-LC datasets, just like prior mentioned
cases, setting 3 gives maximum accuracy and AUC-
ROC, which are 0.3% better than that of setting 2.
Similarly, the performance scores of evaluation mea-
sures over HM-5U reveal that the accuracy and AUC-
ROC of setting 3 are 81.8% and 80.2% respectively,
which are 0.8% and 0.2% greater than setting 2, re-
spectively. The same trend is observed in the case of
HM-PM, where the accuracy of setting 3 is 1.6% bet-
ter than that of setting 2 while AUC-ROC shows only
0.8% improvement.
Overall, the performance of setting 3 is quite ro-
bust and better than setting 1 and 2 over both groups
of datasets, therefore it is used for the performance
comparison with state-of-the-art and further nucleo-
some positioning prediction. In addition, as setting
3 is based on two-stage fine-tuning, the additional
fine-tuning step helps the BERT model to learn di-
verse types of nucleosome-related features from the
datasets in a better way as compared to setting 1, and
2 of BERT-based architectures.
NP-BERT: A Two-Staged BERT Based Nucleosome Positioning Prediction Architecture for Multiple Species
183

Table 5: Performance values of 6 evaluation measures across G1 datasets for all nucleosome positioning predictors.
Dataset/Species Method ACC SP SN PR MCC AUC-ROC 1
st
stage training
DM
NP-BERT (Proposed) 85.1 85.6 84.8 85.3 70.5 92.4
YS
DLNN (Di Gangi et al., 2018) 85.6 83.33 87.0 - - -
ZCMM (Cui et al., 2019) 93.62 79.64 92.26 - 70.0 91.0
NP Cbir (Han et al., 2022) 85.55 83.37 87.69 - 71.19 92.51
CORENup (Amato et al., 2020) 87.0 86.0 87.9 86.1 74.0 93.4
CE
NP-BERT (Proposed) 90.5 92.1 88.1 91.8 80.5 95.8
YS
DLNN (Di Gangi et al., 2018) 89.62 86.34 93.04 - - -
ZCMM (Cui et al., 2019) 85.34 84.1 78.8 - 62.0 91.2
NP Cbir (Han et al., 2022) 89.39 84.59 94.27 - 79.24 95.3
CORENup (Amato et al., 2020) 89.5 87.4 93.5 87.4 80.0 95.0
HM
NP-BERT (Proposed) 88.3 88.4 88.3 88.5 76.8 94.4
CE
DLNN (Di Gangi et al., 2018) 85.37 82.29 88.3 - - -
ZCMM (Cui et al., 2019) 77.2 81.51 - - 56.0 86.1
NP Cbir (Han et al., 2022) 86.12 83.3 89.09 - 72.84 92.34
CORENup (Amato et al., 2020) 84.9 81.8 88.8 81.8 70.2 92.2
YS
NP-BERT (Proposed) 100 99.8 100 99.8 99.8 100
CE
CORENup (Amato et al., 2020) 99.9 99.8 99.9 99.8 99.8 99.9
ZCMM (Cui et al., 2019) 96.75 96.56 91.40 - 88 97.2
Table 6: Performance values of 6 different evaluation mea-
sures of the NP-BERT (Two stage) on the G2 datasets in
terms of 5-fold validation.
Datasets ACC SP SN PR MCC AUC-ROC 1
st
stage training
DM-5U 69.5 85.8 41.1 63.8 30.8 68.3 YS
DM-PM 73.6 93.6 40.1 80.4 42.0 73.7 YS-PM
DM-LC 71.3 90.0 43.1 75.2 38.7 72.0 YS-PM
HM-5U 81.8 94.3 51.6 80.0 53.4 80.2 YS
HM-LC 91.1 96.1 83.7 93.7 81.7 95.1 CE
HM-PM 85.1 92.4 75.8 89.1 70.1 90.4 YS
YS-PM 92.4 97.2 63.1 79.6 66.3 93.5 YS
YS-WG 94.3 98.4 60.3 82.7 67.2 94.5 YS-PM
5.2 NP-BERT vs State-of-the-Art
The two-stage fine-tuning leads to the maximum per-
formance over nucleosome positioning, so the perfor-
mance scores of different evaluation measures of 5
existing nucleosome positioning predictors are com-
pared only with the two-stage fine-tuned BERT. Ta-
ble 5, 6 and 7, show the performance comparison of
the proposed BERT for nucleosome position across
G1 and G2 datasets in terms of 6 different evaluation
measures i.e., accuracy, specificity, sensitivity, preci-
sion, MCC, and AUC-ROC
Table 5 contains the performance values of pro-
posed and existing predictors on G1, where the pro-
posed predictor beats the existing predictors in 3 out
of 4 datasets. In the case of DM the proposed predic-
tor shows inferior performance to 2 existing predic-
tors, namely ZCMM, and CORENup, where ZCMM
is prone to overfitting due to a difference of 12.62 % in
their specificity and sensitivity scores. In comparison,
CORENup and the proposed approaches are more
generalizable for samples belonging to both classes,
due to a lesser difference in specificity and sensitivity
scores. For the dataset of CE, the proposed predic-
tor beats all the existing approaches across 4 differ-
ent evaluation measures. Overall the proposed predic-
tor achieves performance gains of 0.88% across accu-
racy, 5.76% increase in terms of specificity, a 0.5%
increase in terms of MCC, and a 0.8% increase in
terms of AUC-ROC. The proposed predictor is more
generalizable for positive and negative samples due to
less difference in specificity and sensitivity, i.e., 1.6%
as compared to existing predictors i.e., 6.74%, 5.3%,
5%, and 2.1%.
Similarly, for the dataset of HS, the proposed
method gains performance improvements across 4
different evaluation measures, overall it achieves a
performance improvement of 2.2% in terms of ac-
curacy, 5.1% in specificity, 3.96% over MCC, and
2.06% over AUC-ROC. In addition, the proposed pre-
dictor has approximately no difference in specificity
and sensitivity scores, which again reveals the robust-
ness and generalizability of the model as compared
to other predictors where the difference in specificity
and sensitivity is comparatively high. For the dataset
of YS, CORENup and the proposed predictor reach
up to 100% in terms of accuracy and AUC-ROC
which means that both the approaches are more suit-
able for nucleosome positioning across YS datasets.
Table 6 and 7 contain the performance values
BIOINFORMATICS 2023 - 14th International Conference on Bioinformatics Models, Methods and Algorithms
184

Table 7: Performance comparison with state-of-the-art nucleosome positioning predictors across G2 datasets in terms of
5-fold validation.
Dataset/Species Best for Liu (Liu et al., 2014) DLNN (Di Gangi et al., 2018) CORENup (Amato et al., 2020) NP CBIR (Han et al., 2022) NP-BERT (Proposed)
DM-5U 70.0 68.0 69.6 78.0 68.3
DM-PM 70.0 71.0 74.0 74.0 73.8
DM-LC 70.0 71.0 72.0 72.0 72.0
HM-5U 70.0 68.0 76.6 78.0 80.2
HM-LC 65.0 81.0 90.0 92.0 95.1
HM-PM 67.0 77.0 86.0 86.0 90.4
YS-PM - 83.0 92.9 - 93.5
YS-WG - 83.0 93.2 - 94.5
of proposed and existing predictors on G2 datasets,
where the proposed predictor beats the existing pre-
dictors in 5 datasets, shows equivalent performance
in 2 datasets, and shows inferior performance across
only 1 dataset. Across the datasets of DM, the pro-
posed predictor achieves similar performance on DM-
PM and DM-LC datasets and inferior performance
on DM-5UT datasets. Whereas, for the datasets of
HM, the predictor achieves a performance improve-
ment of 2.2% in terms of AUC-ROC for HM-5UT,
a gain of 3.51 % across HM-LC, and an increase of
4.4% over AUC-ROC in HM-PM dataset. Similarly,
in terms of YS datasets, the predictor achieves perfor-
mance enhancement of 0.6% for YS-PM, and 1.3%
for the dataset of YS-WG. Overall, the AUC-ROC of
the proposed remains comparatively higher than ex-
isting methods, which provides evidence for lower
bias of the model toward the positive and negative
class samples.
The better performance of the proposed approach
is associated with efficient and discriminative rep-
resentations learned from the two-stage fine-tuning.
This is evident from the feature space as well, the
clusters of positive and negative class samples are in-
dependent of each other with some outliers. Due to
the superior performance of NP-BERT as compared
to multiple SOTA methods across different nucleo-
some positioning datasets, and low bias for positive
and negative samples, therefore it can be considered
a more definitive method to predict nucleosome posi-
tioning from raw DNA sequences.
5.3 Tradtional DNA Feature Extractors
VS NP-BERT
In order to analyze the performance of feature extrac-
tion methods on nucleosome prediction, an extrinsic
performance analysis is performed on all datasets of
nucleosome prediction by training and evaluating a
random forest (RF) classifier with the obtained statis-
tical feature representations over 5-fold validation.
Table 8 shows, the maximum performance ob-
tained by a feature extraction method and RF clas-
sifier. For each dataset only the top-performing fea-
Table 8: Performance values of top performing feature ex-
traction methods for nucleosome positioning datasets.
Dataset/Species Metthod SN SP PR ACC MCC AUC-ROC AUPRC
Group 1
DM ENAC 79.89 78.476 78.60 79.18 58.4 86.28 85.98
HM CKSNAP 81.13 87.68 87.24 84.38 69.09 91.17 91.50
CE PS2 86.006 85.43 85.762 85.718 71.46 91.9 93.18
YS DACC 99.88 99.94 99.94 99.91 99.83 100 100
Group 2
DM-5U PseEIIP 35.6 90.61 68.85 70.46 32.29 69.0 61.93
DM-PM Mismatch 44.6 91.04 74.9 73.71 41.51 72.93 69.08
DM-LC CKSNAP 44.82 89.88 74.63 71.94 39.84 72.95 70.94
HM-5U CKSNAP 39.44 95.66 79.55 79.18 45.35 76.9 67.44
HM-PM K-MER 66.634 92.076 87.09 80.83 61.71 85.84 87.21
HM-LC RCK-MER 75.10 94.4 90.10 86.62 72.27 91.85 91.53
YS-PM ENAC 4.05 99.67 67.06 86.274 14.11 81,67 44.67
YS-WG K-MER 14.05 99.44 75.55 90.18 29.83 86.23 51.09
ture extraction method is shown. The performance
achieved by the statistical feature extraction methods
is comparatively low as compared to the contextual
information dependent i.e., DLNN (Di Gangi et al.,
2018), Np CBir (Han et al., 2022), and also to the pro-
posed NP-BERT model in terms of all 12 benchmark
datasets. In addition, none of the feature extraction
methods has consistent performance across multiple
nucleosome positioning datasets. This suggests that
these feature extraction methods might not be suitable
enough to be used to identify nucleosome positioning
across multiple species precisely.
As per the performance scores on the G2 datasets,
the statistical feature extraction methods along with
RF, yield poor performance as the datasets are highly
imbalanced. Such imbalanced datasets make the
model more biased towards the samples of one class
which is obvious from huge sensitivity and specificity
differences i.e., >50%. Therefore, using such fea-
tures becomes more problematic to gain consistent
performance across a series of datasets belonging to
different species.
To complement the extrinsic performance anal-
ysis of the various feature extraction methods, Fig-
ure 3 shows the feature space of the statistical repre-
sentations obtained by applying t-distributed stochas-
tic neighbor embedding (TSNE). Most of the fea-
ture extraction methods show heavily dependent clus-
ters among nucleosome forming and linker sequences
NP-BERT: A Two-Staged BERT Based Nucleosome Positioning Prediction Architecture for Multiple Species
185
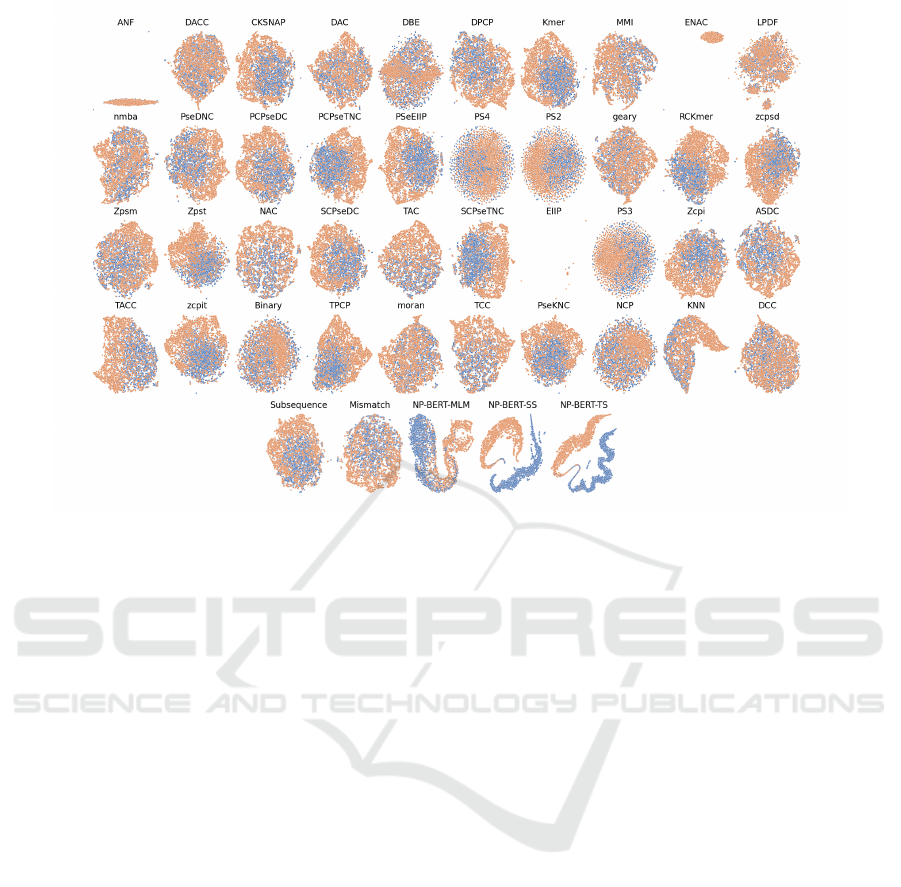
Figure 3: TSNE visualization of different DNA feature extraction methods. NP-BERT-SS represents features from single-
stage fine-tuned BERT model, NP-BERT-TS shows features two-stage fine-tuned BERT model, and NP-BERT-MLM shows
features from BERT model with MLM training.
(positive and negative samples), which suggests that
these methods are unable to encode discriminatory
information in the statistical representations. In addi-
tion, methods like PseKNC, CKSNAP, Z curve, DAC,
and TAC show unique yet dependent clusters which
means that overall these methods deliver reasonable
performance over nucleosome positioning datasets,
yet the performance is lower than the current state-
of-the-art nucleosome positioning predictors. This is
also apparent from the performance values that are al-
ready discussed earlier. In comparison, the features
obtained by the BERT-based models (NP-BERT) pro-
duce independent and unique clusters for the sam-
ples belonging to positive and negative classes, which
prove the discriminatory power and efficiency of the
proposed approach for nucleosome positioning pre-
diction.
6 CONCLUSION
In this research, a transformers-based deep learning
model for the identification of nucleosome position-
ing across multiple species is presented. The pro-
posed approach is tested in three different experimen-
tal settings to explore the potential of transfer learning
and BERT pre-training for nucleosome positioning.
Comparative performance analysis is performed that
shows that setting 3 leads to maximum performance
on nucleosome positioning datasets. Moreover, the
performance produced by setting 3 is then compared
with state-of-the-art deep learning models and mul-
tiple statistical feature extraction methods. The pro-
posed predictor beats the statistical DNA feature ex-
traction methods across all the datasets, whereas it
beats the state of art deep learning models across 3
out of 4 nucleosome positioning G1 datasets, 5 out
of 8 G2 datasets across 5-fold validation, and shows
equivalent performance on 2 G2 datasets. Overall, the
performance gains obtained by the proposed predictor
range from 0.88% to 2.2% across accuracy, 0.10% to
2.1% in terms of AUC-ROC, over G1 datasets. Sim-
ilarly, for G2 datasets the gains vary from 0.6% to
4.4% in terms of AUC-ROC over 5-fold validation.
In addition, NP-BERT shows consistent performance
across the majority of the datasets which makes it
more suitable than other approaches for the prediction
of nucleosome positioning. The proposed approach
can help the scientific community with more accurate
analyses of nucleosome positioning and gene regula-
tion. Furthermore, this work can be extended by in-
corporating an ensembling strategy at setting 3 which
can provide further performance gains, and also this
methodology can be tested out for multiple other chal-
lenging genome classification tasks.
BIOINFORMATICS 2023 - 14th International Conference on Bioinformatics Models, Methods and Algorithms
186

REFERENCES
Amato, D., Bosco, G., and Rizzo, R. (2020). Corenup: a
combination of convolutional and recurrent deep neu-
ral networks for nucleosome positioning identifica-
tion. BMC bioinformatics, 21(8):1–14.
Buenrostro, J. D., Wu, B., Chang, H. Y., and Greenleaf,
W. J. (2015). Atac-seq: a method for assaying chro-
matin accessibility genome-wide. Current protocols
in molecular biology, 109(1):21–29.
Chen, R., Kang, R., Fan, X., and Tang, D. (2014). Release
and activity of histone in diseases. Cell death & dis-
ease, 5(8):e1370–e1370.
Chen, W., Feng, P., Ding, H., Lin, H., and Chou, K.-C.
(2016). Using deformation energy to analyze nucle-
osome positioning in genomes. Genomics, 107(2-
3):69–75.
Chen, Z., Zhao, P., Li, C., Li, F., Xiang, D., Chen, Y.-Z.,
Akutsu, T., Daly, R. J., Webb, G. I., Zhao, Q., et al.
(2021). ilearnplus: a comprehensive and automated
machine-learning platform for nucleic acid and pro-
tein sequence analysis, prediction and visualization.
Nucleic acids research, 49(10):e60–e60.
Chereji, R. V. and Clark, D. J. (2018). Major determi-
nants of nucleosome positioning. Biophysical journal,
114(10):2279–2289.
Cho, K. S., Elizondo, L. I., and Boerkoel, C. F. (2004).
Advances in chromatin remodeling and human dis-
ease. Current opinion in genetics & development,
14(3):308–315.
Cui, Y., Xu, Z., and Li, J. (2019). Zcmm: A novel method
using z-curve theory-based and position weight ma-
trix for predicting nucleosome positioning. Genes,
10(10):765.
Devlin, J., Chang, M.-W., Lee, K., and Toutanova, K.
(2018). Bert: Pre-training of deep bidirectional trans-
formers for language understanding. arXiv preprint
arXiv:1810.04805.
Di Gangi, M., Lo Bosco, G., and Rizzo, R. (2018). Deep
learning architectures for prediction of nucleosome
positioning from sequences data. BMC bioinformat-
ics, 19(14):127–135.
Floridi, L. and Chiriatti, M. (2020). Gpt-3: Its nature,
scope, limits, and consequences. Minds and Ma-
chines, 30(4):681–694.
Han, G.-S., Li, Q., and Li, Y. (2022). Nucleosome posi-
tioning based on dna sequence embedding and deep
learning. BMC genomics, 23(1):1–11.
Huang, Y., Niu, B., Gao, Y., Fu, L., and Li, W. (2010). Cd-
hit suite: a web server for clustering and comparing
biological sequences. Bioinformatics, 26(5):680–682.
Ji, Y., Zhou, Z., Liu, H., and Davuluri, R. V. (2021).
Dnabert: pre-trained bidirectional encoder represen-
tations from transformers model for dna-language in
genome. Bioinformatics, 37(15):2112–2120.
Koumakis, L. (2020). Deep learning models in genomics;
are we there yet? Computational and Structural
Biotechnology Journal, 18:1466–1473.
Liu, H., Zhang, R., Xiong, W., Guan, J., Zhuang, Z., and
Zhou, S. (2014). A comparative evaluation on predic-
tion methods of nucleosome positioning. Briefings in
bioinformatics, 15(6):1014–1027.
Luger, K. (2003). Structure and dynamic behavior of nucle-
osomes. Current opinion in genetics & development,
13(2):127–135.
Mikolov, T., Sutskever, I., Chen, K., Corrado, G. S., and
Dean, J. (2013). Distributed representations of words
and phrases and their compositionality. Advances in
neural information processing systems, 26.
Muhammod, R., Ahmed, S., Md Farid, D., Shatabda,
S., Sharma, A., and Dehzangi, A. (2019). Pyfeat:
a python-based effective feature generation tool for
dna, rna and protein sequences. Bioinformatics,
35(19):3831–3833.
Ozsolak, F., Song, J. S., Liu, X. S., and Fisher, D. E.
(2007). High-throughput mapping of the chromatin
structure of human promoters. Nature biotechnology,
25(2):244–248.
Peckham, H. E., Thurman, R. E., Fu, Y., Stamatoyannopou-
los, J. A., Noble, W. S., Struhl, K., and Weng, Z.
(2007). Nucleosome positioning signals in genomic
dna. Genome research, 17(8):1170–1177.
Pedregosa, F., Varoquaux, G., Gramfort, A., Michel, V.,
Thirion, B., Grisel, O., Blondel, M., Prettenhofer, P.,
Weiss, R., Dubourg, V., et al. (2011). Scikit-learn:
Machine learning in python. the Journal of machine
Learning research, 12:2825–2830.
Sakketou, F. and Ampazis, N. (2020). A constrained op-
timization algorithm for learning glove embeddings
with semantic lexicons. Knowledge-Based Systems,
195:105628.
Schmid, C. D. and Bucher, P. (2007). Chip-seq data reveal
nucleosome architecture of human promoters. Cell,
131(5):831–832.
Shtumpf, M., Piroeva, K. V., Agrawal, S. P., Jacob, D. R.,
and Teif, V. B. (2022). Nucposdb: a database of nucle-
osome positioning in vivo and nucleosomics of cell-
free dna. Chromosoma, 131(1):19–28.
Tsompana, M. and Buck, M. J. (2014). Chromatin acces-
sibility: a window into the genome. Epigenetics &
chromatin, 7(1):1–16.
Ulianov, S. V., Khrameeva, E. E., Gavrilov, A. A., Flyamer,
I. M., Kos, P., Mikhaleva, E. A., Penin, A. A., Lo-
gacheva, M. D., Imakaev, M. V., Chertovich, A., et al.
(2016). Active chromatin and transcription play a key
role in chromosome partitioning into topologically as-
sociating domains. Genome research, 26(1):70–84.
Yu, Y., Si, X., Hu, C., and Zhang, J. (2019). A review of
recurrent neural networks: Lstm cells and network ar-
chitectures. Neural computation, 31(7):1235–1270.
Zhang, J., Peng, W., and Wang, L. (2018). Lenup: learning
nucleosome positioning from dna sequences with im-
proved convolutional neural networks. Bioinformat-
ics, 34(10):1705–1712.
NP-BERT: A Two-Staged BERT Based Nucleosome Positioning Prediction Architecture for Multiple Species
187
