
EGFR Mutation Prediction of Lung Biopsy Images Using Deep Learning
Ravi Kant Gupta
1
, Shivani Nandgaonkar
1
, Nikhil Cherian Kurian
1
, Tripti Bameta
2
, Subhash Yadav
2
,
Rajiv Kumar Kaushal
3
, Swapnil Rane
2
and Amit Sethi
1
1
Department of Electrical Engineering, Indian Institute of Technology, Bombay, India
2
Tata Memorial Centre-ACTREC, HBNI, Mumbai, India
3
Tata Memorial Centre-TMH, HBNI, Mumbai, India
rajiv.kaushal@gmail.com
Keywords:
Histology, Classification, EGFR, WSI, Deep Learning.
Abstract:
The standard diagnostic procedure for targeted therapies in lung cancer treatment involve cancer detection,
histological subtyping, and subsequent detection of key driver mutations, such as epidermal growth factor
receptor (EGFR). Even though molecular profiling can uncover the driver mutation, the process is expensive
and time-consuming. Deep learning-based image analysis offers a more economical alternative for discov-
ering driver mutations directly from whole slide images (WSIs) of tissue samples stained using hematoxylin
and eosin (H&E). In this work, we used customized deep learning pipelines with weak supervision to identify
the morphological correlates of EGFR mutation from hematoxylin and eosin-stained WSIs, in addition to de-
tecting tumor and histologically subtyping it. We demonstrate the effectiveness of our pipeline by conducting
rigorous experiments and ablation studies on two lung cancer datasets – the cancer genome atlas (TCGA)
and a private dataset from India. With our pipeline, we achieved an average area under the curve (AUC) of
0.964 for tumor detection and 0.942 for histological subtyping between adenocarcinoma and squamous cell
carcinoma on the TCGA dataset. For EGFR detection, we achieved an average AUC of 0.864 on the TCGA
dataset and 0.783 on the dataset from India. Our key findings are the following. Firstly, there is no particular
advantage of using feature extractor layers trained on histology if there are differences in magnification. Sec-
ondly, selecting patches with high cellularity, presumably capturing tumor regions, is not always helpful, as
the sign of a disease class may be present in the tumor-adjacent stroma. And finally, color normalization is still
an alternative worth trying when compared to color jitter, even though their origins lie in opposing approaches
to dealing with stain color variation.
1 INTRODUCTION
Lung cancer is a leading cause of death worldwide
(can, ). Non-small cell lung cancer (NSCLC) and
small-cell lung cancer (SCLC) are two major types
of lung cancer of which the former is more common.
NSCLC usually arises in a outer region of the lung
and may look like pneumonia on chest X-ray. NSCLC
has two major histologic variants – lung adenocar-
cinoma (LUAD) and lung squamous cell carcinoma
(LUSC) – and one less prevalent subtype – large cell
carcinoma. Identification of lung cancer subtype is
a key diagnostic step, because the major lung cancer
subtypes – LUAD and LUSC – have different treat-
ment regimens. Treatments also differ by major driver
mutations, including epidermal growth factor recep-
tor (EGFR) mutations that are present in about 20%
of LUAD, and anaplastic lymphoma receptor tyrosine
kinase (ALK) rearrangements that are present in less
than 5% of LUAD (Terra et al., 2016). Lung biopsies
stained using hematoxylin and eosin (H&E), which
are inexpensive and available in most pathology labs,
are used to determine lung cancer subtype and stage.
For EGFR mutation detection, the EGFR immunohis-
tochemical (IHC) stain is not very reliable, and the
molecular test is expensive, time consuming, and not
widely available.
By solving image classification and prediction
tasks, deep learning is poised to revolutionize the
analyses of medical images, even though working
with whole slide images (WSIs) is very challenging.
Deep learning-based computational pathology meth-
ods require either manually annotated WSIs for full
supervision or large datasets with slide-level labels
102
Gupta, R., Nandgaonkar, S., Kurian, N., Bameta, T., Yadav, S., Kaushal, R., Rane, S. and Sethi, A.
EGFR Mutation Prediction of Lung Biopsy Images Using Deep Learning.
DOI: 10.5220/0011678600003414
In Proceedings of the 16th International Joint Conference on Biomedical Engineering Systems and Technologies (BIOSTEC 2023) - Volume 2: BIOIMAGING, pages 102-109
ISBN: 978-989-758-631-6; ISSN: 2184-4305
Copyright
c
2023 by SCITEPRESS – Science and Technology Publications, Lda. Under CC license (CC BY-NC-ND 4.0)
for weak supervision. Slide-level labels may corre-
spond to only small regions of a large gigapixel im-
age. Consequently, numerous methods depend on an-
notation at pixel-level, patch-level, or region of in-
terest (ROI)-level. These large WSIs are oftentimes
challenging to inspect manually, which makes accu-
rate interpretation a tedious task. Not all mutations
are equally easy to detect in H&E stained pathology
images. Published mutation detection accuracies in
held-out cases range from 1.000 for BRAF mutation
in thyroid cancer (Anand et al., 2021) to 0.632 for
NF1 mutation in Lung cancer (Coudray et al., 2018).
Detecting EGFR mutation in lung cancer has been
done with 0.826 AUC in whole slide images (WSIs)
of formalin fixed paraffin embedded tissue (Coudray
et al., 2018). In this study, we share how we pushed
that accuracy higher, and what still needs to be done
before such pipelines can be used in clinical settings,
even if only for triaging. For instance, the distinc-
tion between LUAD and LUSC is not always clear,
especially in scenarios where tumors are poorly dif-
ferentiated. To predict the gene mutation manually
is even more difficult and inconsistent even among
experienced pathologists, because there are no reli-
able morphological signs to identify these mutations
in H&E. .
To handle aforementioned challenges, we propose
a deep learning pipeline combined with weakly super-
vised learning. This pipeline is a step towards usher-
ing inexpensive and timely tumor detection, histologi-
cal subtyping, and mutation identification. We present
our findings from developing convolution neural net-
works (CNNs) for such tasks based on TCGA WSIs
from the US as well as an Indian dataset from the
Tata Memorial Centre (TMC) in Mumbai. The work
on TMC data was approved by the TMC Institu-
tional Ethics Committee. These datasets contain gi-
gapixel sized WSIs of formalin-fixed paraffin embed-
ded (FFPE) tissue sections that are stained using in-
expensive and ubiquitous H&E stains and scanned at
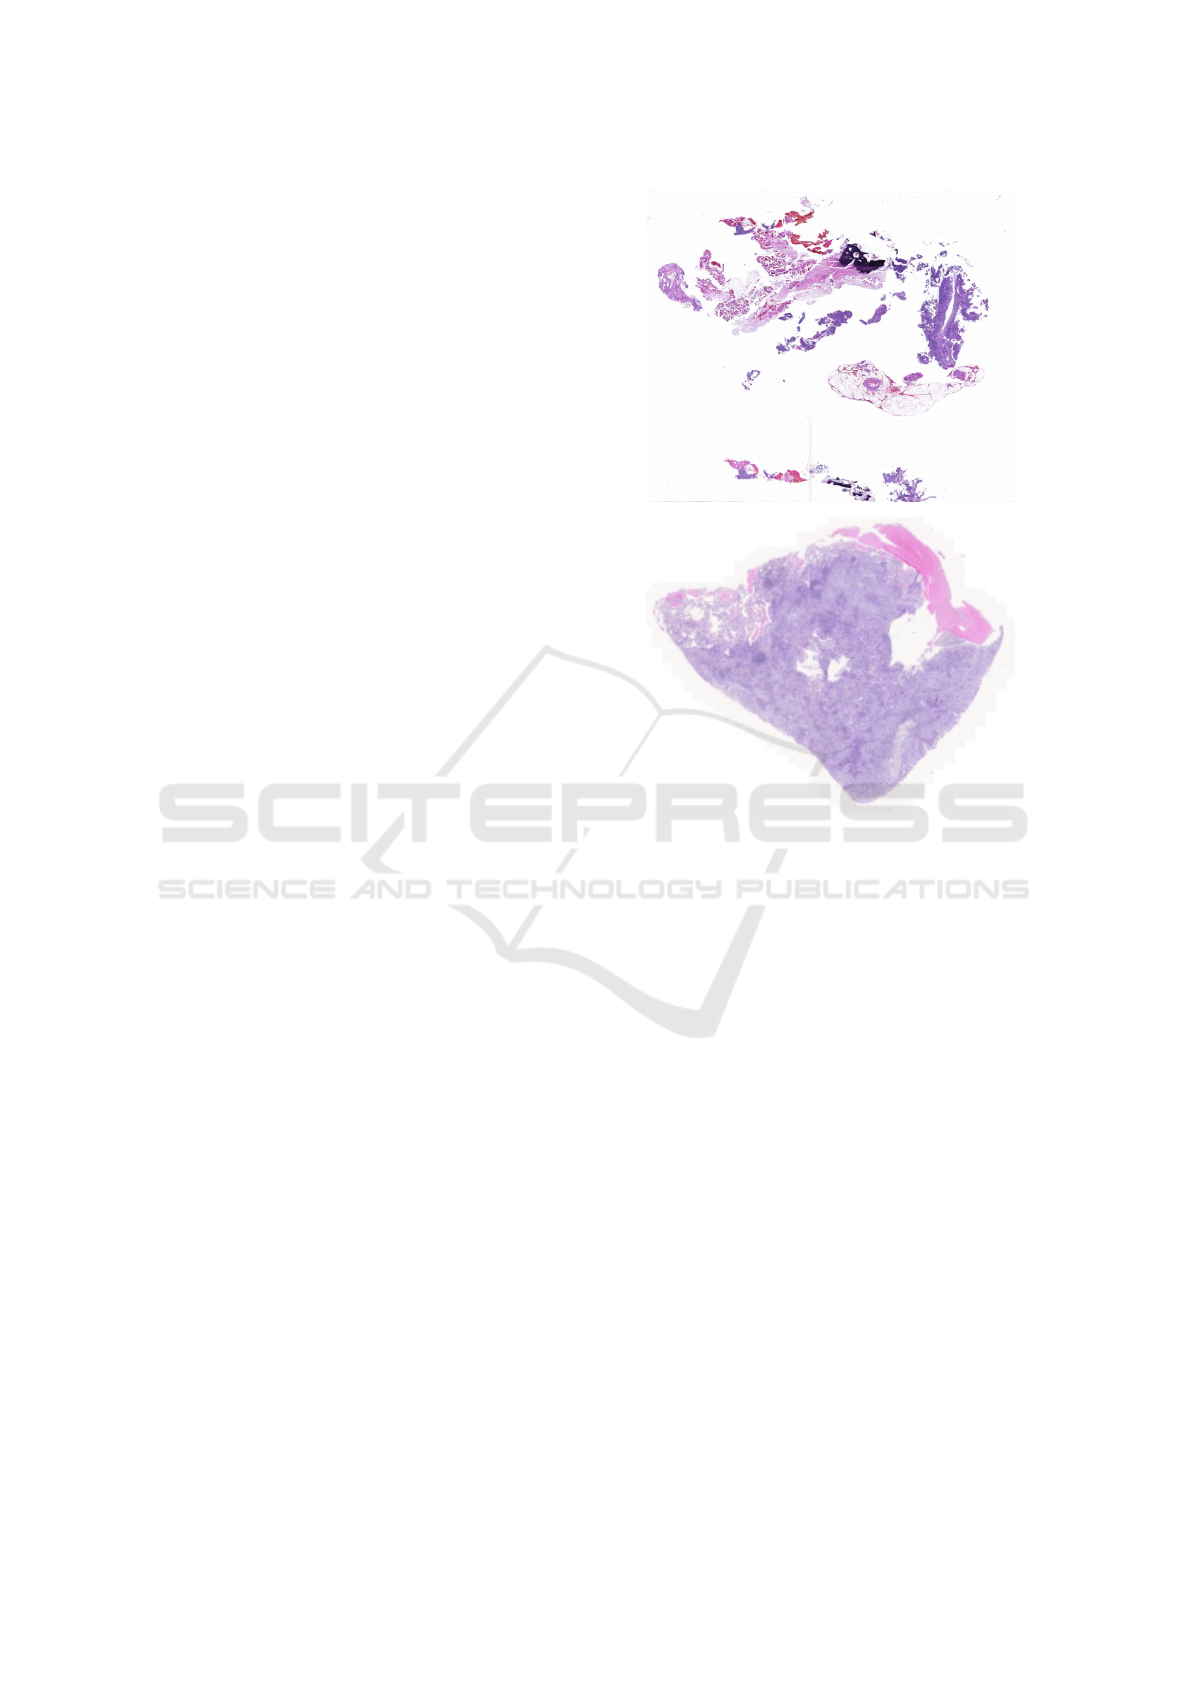
40× magnification. Figure1 shows some snapshots of
slides from both datasets.
Our pipeline is based on several practical con-
siderations. Firstly, to handle large size of WSIs,
we segmented the tissue region of each WSI. Then
we extracted patches from the segmented tissue of
each WSI. We found a huge colors variations among
extracted patches. This variation is due to staining
protocols, habit of technician, reagent brands and
color response of scanner. To mitigate this varia-
tion, we performed color normalization on extracted
patches as shown in Figure 2. All the color nor-
malised tissue patches of each WSI served as input
to the CNN to create a set of low-dimensional fea-
Figure 1: Snapshot of one whole slide image each of H&E
stained FFPE lung cancer tissue from TMC (top) and TCGA
(bottom) datasets.
ture embedding (Figure 3). Low-dimensional fea-
ture spaces are more suitable for faster training and
reduced computational cost. By projecting patches
to a low-dimensional space, the volume of data is
reduced nearly 200 times and led to subsequent re-
duction of computational requirements to train deep
learning models. These embeddings were used for
all three tasks – tumor detection, histological sub-
typing, and EGFR mutation prediction. Since visual
features associated with the mutation cannot be reli-
ably annotated by a pathologist, a weakly supervised
learning technique was used for the third task. At
a high-level during training and inference both, the
model examines and ranks all patches in the tissue
regions of WSI for their relevance in EGFR muta-
tion prediction. An attention score is assigned to each
patch on the basis of importance or contribution to
the collective slide-level representation for a particu-
lar class. This attention score is used for the slide-
level aggregation based on attention-based pooling,
which computes the slide-level representation as the
average of all patches weighted by their respective at-
tention score, as shown in Figure 4.
EGFR Mutation Prediction of Lung Biopsy Images Using Deep Learning
103

We obtained high accuracy for the first two tasks
in line with a previous study (Coudray et al., 2018).
For EGFR mutation, the manual data filtering of
TCGA data in the previous studies is not clear, and
yet we were able to obtain a higher AUC of 0.864.
To do so, we performed extensive ablations studies
that are listed in Section 4. Among our key find-
ings, we found that color normalization is still an
effective domain generalization technique for histol-
ogy compared to color jitter. Additionally, using only
the highly cellular regions does not improve results,
perhaps because the surrounding cells also reorga-
nize in response to the mutated cells. Furthermore,
using feature extraction pipelines trained on other
histology data need not give better results. Finally,
Among weakly supervised learning techniques, we
got the best results with Clustering-constrained Atten-
tion Multiple Instance Learning (CLAM) (Lu et al.,
2021). Lastly, since the TCGA data was collected
under controlled conditions, we tested our technique
data collected during clinical practice in Tata Memo-
rial Centre in India, and obtained an AUC of 0.783,
which suggests that this technique can generalize well
if one has access to data for training from the same
hospital on which it will be used.
Models trained on TCGA dataset did not perform
well on the TMC dataset right out of the box, which
suggests that stronger domain generalization tech-
niques are needed for clinically deployable models.
2 RELATED WORK
Obtaining pixel-level annotations for medical images
is very difficult; this drastically reduces number of
available data instances. However, obtaining a la-
bel for the entire image is easier by mining medical
records. Therefore, it is appealing to divide a med-
ical image into smaller patches, collectively consid-
ered as a bag with a single label (Quellec et al., 2017).
This idea has attracted a great interest in the compu-
tational pathology. However, this approach leads to
label noise where some patches marked with the dis-
ease class label may actually be a healthy or unin-
volved tissue in the same WSI that contains diseased
tissue.
Weakly supervised learning has shown to be use-
ful in annotation-free training of deep learning mod-
els on WSIs. Multiple instance learning (MIL) is a
form of weakly supervised learning where instance
are arranged in bag and levels are provided for en-
tire bag. Typically, most MIL approaches use max
pooling or mean pooling (Feng and Zhou, 2017; Pin-
heiro and Collobert, 2015; Zhu et al., 2017). Both of
these operations are non-trainable, which limits the
their applicability. In the classical work on MIL it
is assumed that instances are represented by features
that can be obtain using pre-trained networks (Riasa-
tian, 2020; Russakovsky et al., 2015; Chen et al.,
2020; Anand et al., 2021). (Anand et al., 2021)
used a weakly supervised learning technique to train a
DNN to predict BRAF V600E mutational status, de-
termined using DNA testing, in H&E stained images
of thyroid cancer tissue without regional annotations.
Recent work utilizes fully-connected neural networks
(NN) in MIL and shows that it could still be benefi-
cial (Wang et al., 2018). For instance, (Pappas and
Popescu-Belis, 2014) proposed attention based MIL
but attention weights were trained as parameters of an
auxiliary linear regression model. This form of MIL
seems to particularly suitable for medical imaging
where processing a WSI consisting of billions of pix-
els is a bottleneck for computation. Other noteworthy
MIL approaches that have been used for histopathol-
ogy data include Gaussian processes (Kandemir et al.,
2016) and a two-stage approach with neural networks
with an EM algorithm to determine instance classes
(Hou et al., 2016). Additionally, attention MIL with
clustering (Lu et al., 2021) framework has been pro-
posed for multi-class classification.
3 PROPOSED METHOD
Patch extraction is one of the first steps while deal-
ing with histopathology images. We extracted patches
of size 512x512 pixels at 40x zoom level using
OpenSlide library. The slides with a low amount of
information were removed; i.e., all the patches (tiles)
where greater than 50% of the surface was covered by
background, for which all the values are above 220 in
the RGB color.
Variations in staining protocols, reagent brands,
habits of technicians, and scanner color response lead
to color variation in digital histopathology images,
which degrades the performance of deep learning
models drastically. Therefore, the extracted patches
were color normalized (Vahadane et al., 2016; Anand
et al., 2019).
From the color normalized patches we extracted
features using ResNet50 trained on ImageNet (Rus-
sakovsky et al., 2015).
Weakly supervised classification task for pathol-
ogy often involves a training set with known labels for
each WSI, but no class-specific information or anno-
tation is available for any pixel or region. Attention-
based MIL (Ilse et al., 2018) with clustering builds
on the MIL framework (Maron and Lozano-P
´
erez,
BIOIMAGING 2023 - 10th International Conference on Bioimaging
104
Figure 2: A color normalization on representative WSIs patches of H&E stained WSIs.
Figure 3: A pre-trained CNN extracts descriptive features from patches of H&E stained WSIs.
Figure 4: Feature vectors are fed to the model where an attention network aggregates patch-level information into slide-level
representation, which are used to make final prediction.
1997) that is suitable for multi-class classification (Lu
et al., 2021). MIL uses non-trainable aggregation
function of max pooling, in which slide level pre-
diction is based on the patch with the highest predic-
tion probability, while attention MIL with clustering
uses trainable and interpretable attention-based pool-
ing function to aggregate slide level representation
from patch level representation. In attention-based
pooling, the attention network predicts two distinct
sets of attention scores corresponding to the binary
classification problem (in our case, EGFR versus non-
EGFR). Because of this, our CNN learns which mor-
phological features should be considered as positive
evidence versus negative evidence for each class and
computes two unique slide-level representations. We
implemented CLAM (Lu et al., 2021) as a weakly su-
pervised learning technique of choice (described be-
low) but changed some of default hyperparameter set-
tings based on our experiments. For a particular WSI
represented as a bag of P instances or patches, we
denote instance level embedding for p
th
patch using
e
p
∈ R
1024
. After that e
p
is further compressed to
512-dimensional vector k
p
=W
1
e
p
using the first fully
connected layer W
1
∈ R
512x1024
. Considering the first
two layers A
a
∈ R
256x512
and B
a
∈ R
256x512
of the at-
tention network (stacked fully connected layer) along
EGFR Mutation Prediction of Lung Biopsy Images Using Deep Learning
105

with W
1
as a part of attention backbone shared by both
the classes, this attention network splits into two par-
allel attention branches W
a,1
, W
a,2
∈ R
1x256
. To score
class specific slide level representation two parallel
independent classifiers (W
c,1
, W
c,2
) are trained. Atten-
tion score of p
th
patch for the i
th
class, denoted by a
i,p
is given by equation 1 and slide-level representation
aggregated per the attention score distribution for the
i
th
class, denoted k
slide,i
∈ R
512
, is given by equation
2,
a
i,p
=
exp{W
a,i
(tanh(B
a
k
p
) ⊙ sigm(A
a
k
p
))}
P
∑
j=1
exp{W
a,i
(tanh(B
a
k
j
) ⊙ sigm(A
a
k
j
))}
(1)
k
slide,i
=
P
∑
p=1
a
i,p
k
p
(2)
The slide level score is s
slide,i
= W
c,i
k
slide,i
(Lu
et al., 2021). For regularization dropout is used af-
ter every layer in the attention backbone.
To improve the learning of class-specific features,
binary clustering is used (Lu et al., 2021). For each
of the two classes, we planted a fully connected layer
after the first layer W
1
. The cluster assignment scores
prediction for the p
th
patch as given by equation 3:
q
i, p
= W
inst,i
k
p
(3)
Since we do not have patch-level labels the output
of the attention network produces pseudo labels to su-
pervise the clustering with the help of high and low
attention scores. Therefore clustering is done by con-
straining patch level feature space k
p
in such a way
that there is a linear separation between strong char-
acterizing evidence and negative evidence for each
class (Lu et al., 2021). For instance level clustering
smooth support vector machine (SVM) loss (based on
multi-class SVM) is used. If the difference between
the prediction score for the ground truth class and the
maximum prediction score for the remaining class is
greater than the specified margin, SVM loss penal-
izes the classifier linearly to the difference (Lu et al.,
2021).
During training a randomly sampled slide is pro-
vided to the model. To mitigate the class imbalance
while training sampling probability of each slide is
inversely proportional to the frequency of its ground
truth class. Total loss for a slide L
sum
is composed of
two-loss functions: (1) slide level classification loss
L
slide
and (2) instance level clustering loss L
instance
, as
given by equation 4:
L
sum
= aL
slide
+ bL
instance
(4)
where a and b are scaling hyperparameters. Here,
L
slide
is standard cross entropy loss that compares
the prediction score of a slide with ground truth
slide-level label and L
instance
is binary SVM loss that
compares instance level clustering prediction scores
for each sampled patches with their corresponding
pseudo-cluster labels (Lu et al., 2021).
We have used the constraint a+b = 1 with c = 0.7.
Additionally, we have examined the performance of
our training methods using a 10-fold testing set up.
We report the mean ± standard deviation as well as
the maximum value of the area under receiver operat-
ing characteristic curve (AUC) in our results. We used
Adam optimizer to update the model parameters with
learning rate 4 × 10
−4
and weight decay of 1 × 10
−5
.
In all experiments, the running average of the first and
the second moment of the gradient are computed with
default coefficient (β
1
= 0.9 and β
2
= 0.999) and for
numerical stability ε is set to 1 × 10
−8
. All models
are trained for between 50 and 200 epochs with an
early stop criterion. When validation loss does not
decrease from the previous low value over 20 consec-
utive epochs, the early stopping criterion is met and
the model for the epoch with the best validation loss
is used for evaluation on the test data.
4 EXPERIMENTS AND RESULTS
We evaluated slide-level classification performance of
our pipeline for three clinical diagnostic tasks: tumor
versus non-tumor classification, LUAD versus LUSC
histological sub-typing, and EGFR mutation detec-
tion in LUAD using 10-folds. That is, we divided the
data into ten folds with roughly the same proportion
for each class. In each of the ten rounds, one fold was
used for testing while the other nine folds were ran-
domly split into training and validation sets. During
training, we created a batch of 512 patches sampled
randomly from slide in the training set. To get slide-
level prediction, the pipeline first makes patch-level
predictions and then averages their probability score.
We validated our model after every 100,000 patches
with an early stopping criteria on model when valida-
tion loss does not decrease for 20 consecutive valida-
tion epochs. The model with the minimum validation
loss was evaluated on the test set. We report the mean,
standard deviation, and maximum of the area under
receiver operating characteristic curve (AUC) for the
ten test folds for all our experiments.
Table 1 summarizes the results of our approach for
cancer detection. The TCGA dataset was split in the
ratio of 80:10:10 for training, validation and testing,
respectively, for our all tasks. We achieved average
BIOIMAGING 2023 - 10th International Conference on Bioimaging
106
Table 1: Results from using ResNet50 as a feature extractor for tumor detection and histological subtyping.
Task Trained on Tested on Avg. Test AUC ± STD Max Test AUC
Tumor vs Non-Tumor TCGA TCGA 0.964±0.064 0.985
LUAD vs LUSC TCGA TCGA 0.942±0.014 0.971
Table 2: Results from using ResNet50 as a feature extractor for detecting EGFR mutation with and without color normalization
(CN) (Vahadane et al., 2016; Anand et al., 2019) or nuclei filtering (NF), and CLAM (Lu et al., 2021) versus attention
MIL (Ilse et al., 2018).
Model Trained on Tested on Avg. Test AUC ± STD Max Test AUC
CN + NF + Attention MIL TCGA TCGA 0.663±0.083 0.792
CN + CLAM (recommended) TCGA TCGA 0.865±0.060 0.955
Attention MIL TMC TMC 0.767±0.043 0.836
CN + CLAM (recommended) TMC TMC 0.781±0.063 0.924
Table 3: Results from testing the proposed pipeline on different datasets.
Task Trained on Tested on Avg. Test AUC ± STD Max Test AUC
EGFR vs Non-EGFR TCGA TMC 0.531 ± 0.037 0.588
EGFR vs Non-EGFR TMC TCGA 0.583 ± 0.067 0.631
Table 4: Results from testing different feature extractors.
Task Dataset Feature Extractor Avg. Test AUC ± STD Max Test AUC
EGFR vs Non-EGFR TMC KimiaNet 0.759 ± 0.037 0.852
EGFR vs Non-EGFR TMC SimCLR 0.753 ± 0.037 0.853
test AUC of 0.964 ± 0.064 for the task of tumor ver-
sus non-tumor classification for over 1500 patients’
frozen slide available with labels by using cross en-
tropy loss as a bag loss. Model parameters were op-
timized using the Adam optimizer with a learning
rate of 5 × 10
−4
and weight decay of 1 × 10
−5
, with
β
1
= 0.9 and β
2
= 0.999 with ε value of 1 × 10
−8
.
We performed other experiments for formalin-
fixed paraffin embedded (ffpe) slides with the same
experimental setup. For sub-typing of lung cancer,
LUAD versus LUSC, we achieved average test AUC
of 0.942 ± 0.014 over 1045 patients slides available
with labels, as shown in Table 1.
Our results for EGFR mutation detection are sum-
marized in Table 2 for slides, where we examine the
use of color nomralization, nuclei filtering, and two
weakly supervised learning methods – CLAM (Lu
et al., 2021) with attention-based multiple instance
learning (Ilse et al., 2018). For EGFR mutation pre-
diction the average test AUC achieved is 0.865 ±
0.060 over 179 patients slides whose labels were
available. We trained our model for EGFR mutation
prediction for Indian dataset from TMC and achieved
0.781 ± 0.063 average test AUC over 544 patients
slides with the same value of parameters used for
TCGA dataset.
To confirm our model’s suitability for indepen-
dent cohorts, we tested our model on the TMC dataset
after training on the TCGA dataset, and found rel-
atively poor performance as an average AUC of
0.531 ± 0.037. In a similar manner when we tested
our model on the TCGA dataset after training on
the Indian dataset, we obtained an average AUC of
0.583 ± 0.067 as summarized in the Table 3. These
results and visual inspection point to significant visual
differences between the two datasets. Besides having
different stain colors for H&E, higher cancer grade
and significant tar deposits were much more frequent
in lung tissue from India, indicating a stronger preva-
lence of smoking-related lung cancer. Additionally,
TMC is known to have a skew towards late stage can-
cers as there are no screening programs for lung can-
cer in India as opposed to the US, and it is a hospital
of last resort for a large section of the population.
We conducted a set of ablation studies to un-
derstand the impact of the other components of our
model as well. Informative features are the key to
weakly supervised method for classification. There-
fore we trained our model with feature extractors
other than ResNet50 trained using ImageNet (Rus-
sakovsky et al., 2015), such as those trained specif-
ically on histology images using self-supervised con-
trastive learning SimCLR (Chen et al., 2020) and
KimiaNet (Riasatian, 2020). A summary of these re-
EGFR Mutation Prediction of Lung Biopsy Images Using Deep Learning
107

sults is shown in Table 4 for TMC dataset. Features
from KimiaNet were fed to the attention MIL with
clustering, attaining an average test AUC of 0.759.
When SimCLR was used as an feature extractor we
achieved average test AUC of 0.753. These results
show that using feature extractors trained on pathol-
ogy data is not always advantageous, especially if
the feature extractor is trained on a different magni-
fication and for an easier task – KimiaNet is trained
on 20x for organ and histological subtype detection,
while we were performing mutation detection at 40x.
5 CONCLUSION AND
DISCUSSION
We demonstrated our pipeline’s effectiveness for tu-
mor biomarker discovery from WSIs. The tumor
classification model in our pipeline predicts whether
the examined tissue is tumorous or normal with very
high accuracy in line with previous results. Fur-
ther, the histological subtype detection model in our
pipeline can differentiate lung cancer sub-types of
the TCGA dataset with high accuracy as well, again
in line with previous results. Although no morpho-
logical signal is directly visible to a pathologist for
detecting EGFR mutation, we show that appropriate
pipelines with color normalization and weakly super-
vised deep learning models can predict EGFR muta-
tion with an encouraging AUC for both TCGA and
the TMC datasets. For the TCGA dataset, we were
able to outperform previous studies on EGFR detec-
tion (Coudray et al., 2018). Our ablation study found
that KimiaNet pre-trained feature extractor models
do not outperform conventional ResNet50 models
pre-trained on ImageNet. The observation remained
unchanged for the SimCLR-based feature extractor
model as well.
We also performed a few additional experiments.
In one of our experiments, we explicitly filtered out
patches with fewer nuclei from our framework to en-
hance the feature learning in our training scheme.
However, the performance in these cases was worse
compared to our reported results. Further, we also
tried to apply our model, trained on TCGA, on the
TMC dataset and vice versa for EGFR prediction. We
observed substantial performance degradation in both
cases, affirming strong distribution shift between the
datasets. Between the two datasets, we noticed sig-
nificant differences due to variations in tissue prepa-
ration and staining, tar deposits, and cancer stage.
Although we employed color jitter and normaliza-
tion methods to reduce the distribution differences be-
tween the datasets, the performance did not improve
much. In the future, we would like to experiment with
and develop domain adaptation and domain general-
ization techniques to counter this problem.
REFERENCES
American Cancer Society — Information and Resources
about for Cancer: Breast, Colon, Lung, Prostate, Skin.
Anand, D., Ramakrishnan, G., and Sethi, A. (2019). Fast
gpu-enabled color normalization for digital pathology.
In 2019 International Conference on Systems, Sig-
nals and Image Processing (IWSSIP), pages 219–224.
IEEE.
Anand, D., Yashashwi, K., Kumar, N., Rane, S., Gann,
P. H., and Sethi, A. (2021). Weakly supervised learn-
ing on unannotated h&e-stained slides predicts braf
mutation in thyroid cancer with high accuracy. The
Journal of pathology, 255(3):232–242.
Chen, T., Kornblith, S., Norouzi, M., and Hinton, G. (2020).
A simple framework for contrastive learning of visual
representations. In International conference on ma-
chine learning, pages 1597–1607. PMLR.
Coudray, N., Ocampo, P. S., Sakellaropoulos, T., Narula,
N., Snuderl, M., Feny
¨
o, D., Moreira, A. L., Raza-
vian, N., and Tsirigos, A. (2018). Classification and
mutation prediction from non–small cell lung cancer
histopathology images using deep learning. Nature
medicine, 24(10):1559–1567.
Feng, J. and Zhou, Z.-H. (2017). Deep miml network. In
Thirty-First AAAI conference on artificial intelligence.
Hou, L., Samaras, D., Kurc, T. M., Gao, Y., Davis, J. E., and
Saltz, J. H. (2016). Patch-based convolutional neural
network for whole slide tissue image classification. In
Proceedings of the IEEE conference on computer vi-
sion and pattern recognition, pages 2424–2433.
Ilse, M., Tomczak, J., and Welling, M. (2018). Attention-
based deep multiple instance learning. In Interna-
tional conference on machine learning, pages 2127–
2136. PMLR.
Kandemir, M., Haußmann, M., Diego, F., Rajamani, K. T.,
Van Der Laak, J., and Hamprecht, F. A. (2016). Vari-
ational weakly supervised gaussian processes. In
BMVC, pages 71–1.
Lu, M. Y., Williamson, D. F., Chen, T. Y., Chen, R. J., Bar-
bieri, M., and Mahmood, F. (2021). Data-efficient
and weakly supervised computational pathology on
whole-slide images. Nature biomedical engineering,
5(6):555–570.
Maron, O. and Lozano-P
´
erez, T. (1997). A framework for
multiple-instance learning. Advances in neural infor-
mation processing systems, 10.
Pappas, N. and Popescu-Belis, A. (2014). Explaining the
stars: Weighted multiple-instance learning for aspect-
based sentiment analysis. In Proceedings of the 2014
Conference on Empirical Methods In Natural Lan-
guage Processing (EMNLP), pages 455–466.
Pinheiro, P. O. and Collobert, R. (2015). From image-level
to pixel-level labeling with convolutional networks. In
BIOIMAGING 2023 - 10th International Conference on Bioimaging
108

Proceedings of the IEEE conference on computer vi-
sion and pattern recognition, pages 1713–1721.
Quellec, G., Cazuguel, G., Cochener, B., and Lamard, M.
(2017). Multiple-instance learning for medical image
and video analysis. IEEE reviews in biomedical engi-
neering, 10:213–234.
Riasatian, A. (2020). Kimianet: Training a deep network for
histopathology using high-cellularity. Master’s thesis,
University of Waterloo.
Russakovsky, O., Deng, J., Su, H., Krause, J., Satheesh, S.,
Ma, S., Huang, Z., Karpathy, A., Khosla, A., Bern-
stein, M., et al. (2015). Imagenet large scale visual
recognition challenge. International journal of com-
puter vision, 115(3):211–252.
Terra, S. B., Jang, J. S., Bi, L., Kipp, B. R., Jen, J., Yi, E. S.,
and Boland, J. M. (2016). Molecular characterization
of pulmonary sarcomatoid carcinoma: analysis of 33
cases. Modern Pathology, 29(8):824–831.
Vahadane, A., Peng, T., Sethi, A., Albarqouni, S., Wang,
L., Baust, M., Steiger, K., Schlitter, A. M., Esposito,
I., and Navab, N. (2016). Structure-preserving color
normalization and sparse stain separation for histolog-
ical images. IEEE transactions on medical imaging,
35(8):1962–1971.
Wang, X., Yan, Y., Tang, P., Bai, X., and Liu, W. (2018).
Revisiting multiple instance neural networks. Pattern
Recognition, 74:15–24.
Zhu, W., Lou, Q., Vang, Y. S., and Xie, X. (2017).
Deep multi-instance networks with sparse label as-
signment for whole mammogram classification. In In-
ternational conference on medical image computing
and computer-assisted intervention, pages 603–611.
Springer.
EGFR Mutation Prediction of Lung Biopsy Images Using Deep Learning
109
