
Addressing Privacy and Security Concerns in Online Game Account
Sharing: Detecting Players Using Mouse Dynamics
Yimiao Wang
a
and Tasmina Islam
b
Department of Informatics, King’s College London, London, U.K.
Keywords: Mouse Dynamics, Game Account Sharing, Cybersecurity, User Authentication, Behavioural Biometrics.
Abstract: As the internet has taken a huge part of people’s life, the personal information an online account can hold has
increased as well, resulting in many concerns related to cybersecurity and privacy. Children as a vulnerable
group could participate in risky actions unconsciously causing privacy leakage, like sharing a game account.
This paper discusses the possible security and privacy risks caused by game account sharing and proposes a
countermeasure based on user authentication to detect the true owner of the game account using their mouse
dynamics. Support Vector Machine and Random Forest have been used for classification of the true owner
and the intruder using players’ mouse dynamics data captured from “Minecraft” game. This paper also
investigates the effect of different feature sets in detecting the players using feature ranking algorithms.
1 INTRODUCTION
With the rapid development of the internet, online
games have become an important part of children’s
entertainment and social life. According to the
gamers’ distribution data in the US released by The
Entertainment Software Association (ESA) in 2021,
76% of American kids are online game players, and
among all players, the percentage of underaged
children is 20% (ESA, 2020). However, as the variety
and entertainment of online games increase, the risks
related to cyber security and privacy have become a
serious problem. Online game accounts nowadays
store more personal information than before since
most of them are connected to other social network
accounts, such as Twitter and Gmail. Meanwhile, the
in-game purchase function makes online game
account itself more valuable as well. Willingly or
unwillingly account sharing actions, like MMR
(Match Making Rating) boosting, phishing and social
engineering, has become a general phenomenon for
all age group player. Since the age of player is getting
younger, more and more children and adolescents
have become the victim or participants of account
sharing. Moreover, compared with adults, children
and adolescents lack vigilance and knowledge of the
a
https://orcid.org/0000-0002-6395-3031
b
https://orcid.org/0000-0002-6437-8251
possible danger on the internet, which makes them a
vulnerable place. Therefore, it is important to have a
proactive way to avoid personal information leakage
through account sharing.
Even though account sharing is strictly prohibited
in every game company’s policy, there lacks an
efficient way to identify the sharing action.
Behavioural biometrics, such as, mouse dynamics of
the players can be used to identify account sharing
action. To address possible security and privacy risks
caused by this account sharing, this paper aims to
identify whether the person (player) using the account
is the true account holder or not, by analysing the
mouse movement patterns of the players.
The remainder of this paper is organised as
follows. Section 2 gives a brief review of existing
literature on account sharing and user authentication
using behavioural biometrics. in related area.
Experimental set-up is described in Section 3, which
includes, the data acquisition and pre-processing,
feature extraction, design of algorithms and metrices
for evaluation. Section 4 will present the
experimental results and analysis. Finally, Section 5
will summarise and conclude the paper.
864
Wang, Y. and Islam, T.
Addressing Privacy and Security Concerns in Online Game Account Sharing: Detecting Players Using Mouse Dynamics.
DOI: 10.5220/0011678300003411
In Proceedings of the 12th International Conference on Pattern Recognition Applications and Methods (ICPRAM 2023), pages 864-871
ISBN: 978-989-758-626-2; ISSN: 2184-4313
Copyright
c
2023 by SCITEPRESS – Science and Technology Publications, Lda. Under CC license (CC BY-NC-ND 4.0)

2 LITERATURE REVIEW
The following sections will give a brief literature
review over two aspects: the prevalence of account
sharing and existing studies on user authentication
using behavioural biometrics.
2.2.1 Account Sharing
Online account as a kind of personal asset is not
designed to be shared in the first place. However,
people are constantly sharing their accounts as a sign
of trust in a family or a romantic relationship, to take
advantage of the company or simply for convenience
(Obada-Obieh, Huang, & Beznosov, 2020). The
statistics show that in the US, 54% of Americans have
taken part in the account sharing behaviour, of which
the sharing rate of streaming applications like Netflix
and Hulu is up to 75% (Financial country, 2022;
Obada-Obieh, Huang, & Beznosov, 2020). With the
rise of e-sports and live-streaming, online game
players with excellent performance could gain fame
and sponsorship. This trend arouses some players’
vanity and further gives rise to another industry called
“MMR boosting” (Match Making Rating), which
means hiring someone to play their account to
improve their rank (Beserra, Camara, & Da Costa-
Abreu, 2016; League of Legends Support, 2022).
This involves many young people who are chasing
their careers of becoming professional e-sports
players offering this kind of service to provide for
themselves. Another common case is that some
agency websites are built to make it easier for the
clients to get customized services. The Riot games
company published an announcement in January
2022 banning one of its professional players from any
match because of participating in MMR boosting
(Riot games, 2022), and this is not a single case. The
prevalence of the MMR boosting service had push the
South Korean government to amend the law to punish
this kind of action (Milella, 2022). However,
technically there is not an effective way to identify
the massive account sharing actions caused by MMR
boosting.
Another study reported in (Matthews et al, 2016),
confirmed that passive sharing (e.g. accidental or
unsupervised sharing) did exist, but it is not the main
component of the sharing action, most of the sharing
actions were intentional. In fact, people had the
knowledge that sharing could endanger their privacy
and security, and they did the sharing after weighing
(Matthews et al.., 2016; Obada-Obieh et al., 2020).
Although the start of the sharing action could be
voluntary, the ending of account sharing might not be
as easy as it starts. People might not realize they have
reused the same password or similar passwords for
multiple accounts, and it has been found that with a
pre-known password, an attacker can successfully
predict the variant passwords in 41% of accounts in
under 3 seconds in an offline attack (Obada-Obieh et
al., 2020).
Moreover, since it is theoretically not legal for
two people to use the same game account, the
boundary and ownership of personal content are hard
to identify, which could lead to unexpected privacy
leakage and financial loss (Obada-Obieh et al., 2020).
2.2.2 User Authentication
Keyboard and mouse are the two essential
components of online gaming. In respect of safety
considerations, keystroke dynamics analysis is
inevitable to record users’ personal information
directly (e.g., account number, password, chat logs),
while mouse dynamics have less problem with this.
Moreover, the result from previous research on game
data has shown that the mouse movement data
contained more information gain than keystrokes
with respect to user identification and authentication
(Beserra et al., 2016).
Initially, Gamboa and Fred (2004) proposed
serials of features that could be used to define a mouse
movement in their research. In another study of
mouse movement curves reported in (Hinbarji,
Albatal, & Gurrin, 2015), nine features were defined
and extracted to characterize a single mouse action
which achieved an EER of 5.3%. The authors also
reported that with the increase of threshold, FRR
increases and FAR decreases respectively (Hinbarji,
Albatal, & Gurrin, 2015). A similar conclusion was
proposed in the Minecraft mouse movement study
(Siddiqui, Dave and Seliya, 2021), in which the
authors argued that they had achieved a lower FPR
with the cost of increased FNR, but this did not
include the effect of threshold changing. They also
delivered an opinion that, in practice, achieving
minimal FAR should be one of the priority tasks of a
user authentication system, since falsely accepting an
imposter as a true user could be more harmful than
falsely rejecting a true user (Siddiqui et al., 2021).
However, excessive FRR due to the pursuit of
minimal FAR could also cause a poor user
experience. Therefore, finding a balance between
these two values is important.
Another finding reported in (Hinbarji, Albatal, &
Gurrin, 2015), is that the authentication system can
achieve a lower EER in a lower threshold with a
longer session length, but a longer session length also
Addressing Privacy and Security Concerns in Online Game Account Sharing: Detecting Players Using Mouse Dynamics
865
means the attackers could have more time to take their
actions before getting detected.
Antal and Egyed-Zsigmond (2019) proposed two
evaluation scenarios in their study, which is using
duplicated data to test the classifiers or not. The
research came back with almost perfect results when
using duplicated data, while the results tested on non-
duplicated data were more ordinary. The possible
reasons for causing this problem were not discussed
in this research but were brought later up in the
Minecraft mouse movement study, that it could be
because the classifiers have difficulty processing
never-seen-before data (Siddiqui et al., 2021).
A more relevant study (da Silva & Da Costa-
Abreu, 2018) was conducted using a similar
approach, but it is more targeted to online games
since it applied the users’ mouse usage data when
playing League of Legends collected in a previous
study (Beserra et al., 2016). Their results indicated
that the MLP classifiers have the best accuracy, and it
is possible to further improve the results with higher
data collection frequency (da Silva & Da Costa-
Abreu, 2018). However, it has been proved that an
algorithm cannot be judged only by accuracy and this
research provided no further metrics. Meanwhile,
since the game data cannot be made public and there
was no detailed description of data processing or any
examples, the research has no reproducibility.
Besides, the authors (da Silva and Da Costa-
Abreu, 2018) pointed out a possible future research
direction, which is, the effect of the users’ mouse
dynamics variation on the classification algorithm’s
accuracy and adaptability when playing with different
roles and in different periods of a game.
3 EXPERIMENTAL SETUPS
This section introduces the dataset used in this paper,
along with the background theories and
implementation used on the extracted features, the
selected algorithms, and the evaluation metrics.
3.1 Dataset
Minecraft Mouse Dynamics Dataset (Siddiqui, Dave,
& Seliya, 2021), published in GitHub (Siddiqui,
2022) is used in this paper for experiment. It was
originally collected from 20 users while they were
playing Minecraft on the same computer for 20
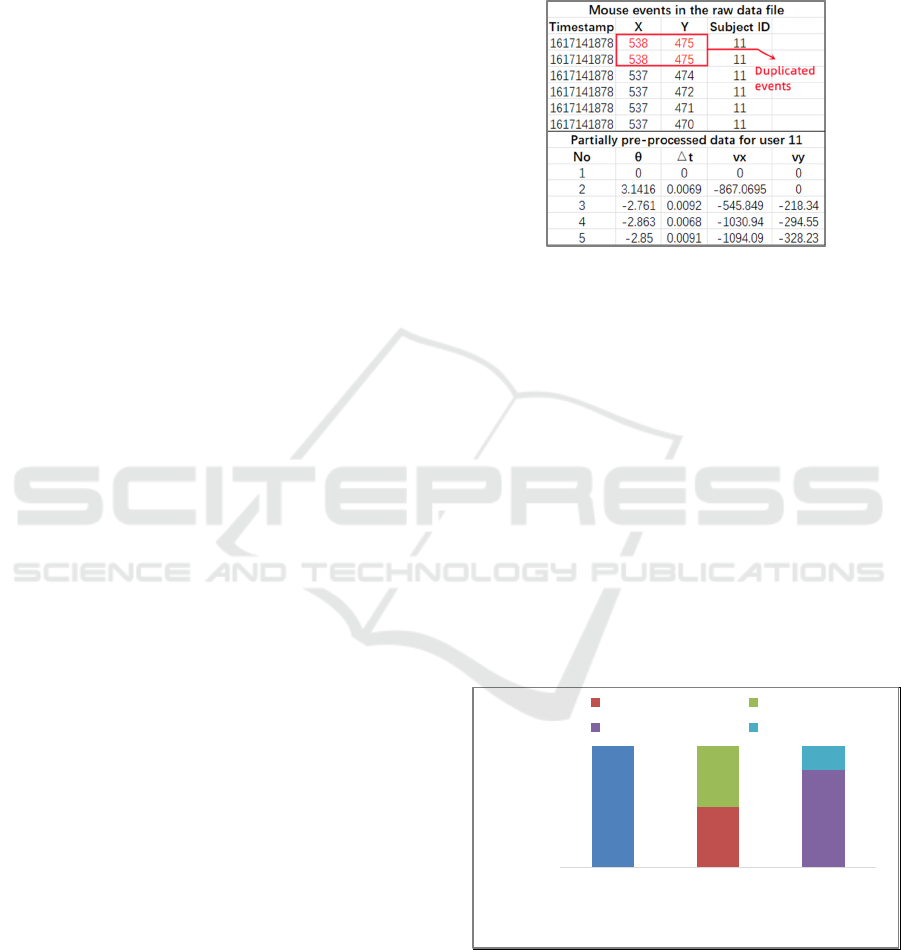
minutes. In the raw data file (shown in Figure 1), each
line represents a mouse event, which is defined by a
timestamp for that event, its x-coordinate, y-
coordinate, and the ID of the user.
According to study reported in (Antal & Egyed-
Zsigmond, 2019; Siddiqui et al., 2021), a mouse
action is composed of several consecutive and non-
duplicated mouse events. In this study, one mouse
action is comprised of 10 consecutive mouse events.
Figure 1: An example of the raw data file.
Before extracting the features, the raw data needs
to be pre-processed. Firstly, the duplicated entities
must be filtered out. Secondly, some basic features
such as the velocity, the acceleration, the jerk, and the
angular velocity are extracted from the raw data. An
example of the pre-processing is shown in Figure 1 as
well.
Because the number of mouse actions extracted
from each user is different, to make all the dataset
follow the same standard, the minimal value must be
taken into consideration. Therefore, a normalisation
procedure is performed using the filter “resample” in
Weka (Weka, 2022), which could produce a random
subsample of a dataset. During the resampling, the
option “with replacement” is turned on to make sure
an instance will not be selected twice.
Figure 2: Instances distribution for each user dataset.
When designing the dataset for each user, each
dataset is divided into two classes: genuine user and
imposter user. Despite that there are 19 intruders in
each dataset, the aim of the paper is to detect if the
current user is the true owner of this account. The
5890
2945
2945
4712
1178
0
1000
2000
3000
4000
5000
6000
7000
A complete
dataset
Distribution
of different
instances
Split of
training and
testing sets
Number of instances
Genuine instances Imposter instances
Training Testing
ICPRAM 2023 - 12th International Conference on Pattern Recognition Applications and Methods
866

identity of the intruder is not the critical point of this
problem as long as it is not the true owner. Therefore,
a binary classifier is used in this paper. The number
of mouse actions from the two classes is set to equal
to mitigate bias during classification. The actions of
the imposters’ class are extracted from the rest 19
users equally. The distribution of the instances in each
dataset can be seen in Figure 2.
To avoid the false high accuracy caused by
repetitive using of data, and in the meantime keep
enough data building training the classifiers, this
paper applied user-specified dataset split offered in
Weka (Weka, 2022), where each dataset is divided
into two parts, 80% of the instances are used for
training and the rest 20% of the instances are
submitted to testing as shown in Figure 2.
3.2 Feature Extraction
Features extraction has been conducted following the
procedures described in (Antal and Egyed-Zsigmond,
2019). Each mouse event is represented by a triplet
(x
i
, y
i
, t
i
), where i is the sequence of the event in a
mouse action, ranges from 1 to 10. The angle θ,
between the line formed by two points with the
positive x-axis, is used for further feature calculation.
A summary of the 33 extracted features is shown in
Table 1.
Table 1: A summary of the extracted features.
Name Description Number
v
x
Horizontal velocity 4
v
y
Vertical velocity 4
v Velocity 4
a Acceleration 4
j Jerk 4
ω Angular velocity 4
traj_length (s) Travelled length 1
curve (c) Curvature time 4
critical_points Number of critical
points in curvature
time
1
elapsed_time Duration of each
mouse action
1
a_beg_time The first segment of
each mouse action
with positive
acceleration
1
sum_of_angles Sum of angles in each
action
1
Total 33
Next, a series of features related to kinematics are
calculated, which are velocity, acceleration, jerk and
angular velocity. Their maximal, minimal, mean and
standard deviation values are counted as extracted
features that are valuable for training and testing the
classifier. The use of these features in user
identification with behavioural biometrics was firstly
introduced by Gamboa and Fred (2004) in their
research.
Further, s is defined as the length of the trajectory
from the starting point of the action to the ith point.
The travelled length s can then be used to calculate
the curvature time series c. Similarly, the maximal,
minimal, mean and standard deviation values of the
curvature time series c are extracted features.
Based on the curvature time series obtained and a
certain threshold (TH), the number of critical points
can be counted where c
i
< TH
C
. Given by the
experience in the intrusion detection, the threshold
TH
C
is set to 0.0005 in this paper.
The duration of each mouse action and the sum of
angles in each mouse action are included in the
extracted features. As well as the feature a_beg_time,
which calculate the time for the first segment of an
action with the positive acceleration.
3.3 Classification Algorithm Design
The paper applied two machine learning algorithms
to test possibility of user verification through mouse
dynamics and compare their performance. A brief
introduction for each algorithm and the
implementation of the classifier design are illustrated
as follows.
3.3.1 Random Forest
Random forest is an ensemble learning algorithm
which is constructed by a large number of decision
trees (Noble, 2006). In each decision tree, features are
used in a certain order based on some criterions (e.g.
information gain, information gain ratio, Gini index)
to split the data. For each input data, the final
classification result of the random forest would be the
class with the highest number from the results of the
decision trees (Kulkarni & Sinha, 2012).
This paper tested the random forest classifiers
with 100 decision trees. Information gain and
information gain ratio methods are used to rank the
features. In general, after splitting based on a feature,
the more uniform the dataset is, the higher
information gain it has, and information gain ratio is
the information gain divided by intrinsic information,
which is introduced to reduce the bias of preferring to
Addressing Privacy and Security Concerns in Online Game Account Sharing: Detecting Players Using Mouse Dynamics
867
select a feature with more values in the information
gain method. Two evaluators “Gain Ratio Attribute
Eval” and “Info Gain Attribute Eval” in Weka (Weka,
2022) are used for this ranking. Both evaluators give
a rank list of features based on the contribution of the
features with respect to the class marked as R1 and
R2 respectively, which are presented in Table 2.
Table 2: Rank lists of the evaluators.
Features R1 R2 Features R1 R2
min_acc 1 2 max_v 18 23
min_jerk 2 1 max_v
x
19 18
max_jerk 3 5 max_v
y
20 14
min_ang 4 3 std_ang 21 15
mean_j 5 4 traj_length 22 24
mean_curve 6 10 mean_v
y
23 22
mean_ang 7 6 max_curve 24 19
numCritPoints 8 8 min_curve 25 26
std_curve 9 9 std_v
x
26 29
max_acc 10 20 min_v 27 28
max_ang 11 7 std_v
y
28 25
min_v
y
12 12 mean_v
x
29 27
mean_acc 13 11 elapsed_time 30 30
min_v
x
14 13 sum_of_angles 31 31
mean_v 15 16 std_v 32 32
std_j 16 17 a_beg_time 33 33
std_acc 17 21
The attribute rank list is the key to feature
selection. By trimming off some low-ranked features,
it is possible to improve the performance of the
classifier. Another scenario is to only select some of
the top-ranked features. If the threshold is chosen
appropriately, it is possible for the classifier to
maintain the same level of performance while saving
time consumption.
3.3.2 Support Vector Machine
Support vector machine is an algorithm that looks for
the maximal value of a specific function with respect
to the provided data (Noble, 2006). In spatial, support
vector machine is about finding the hyperplane that
separates the data points. The specialty of support
vector machine is that it would choose the hyperplane
with the maximal margin, which is an important
feature that maximizes the ability of a SVM to
classify never-be-seen data successfully (Noble,
2006).
In Weka, the optimization of the SVM can be
done through choosing kernel tricks and the penalty
parameter. The penalty parameter (C) represents the
weight of the influences that are brought by the
misclassified points (Misra, 2020). In general, the
selection of penalty parameter is a trade-off between
the size of the margin and how valuable the designer
thinks the outlier points mean to the model (Misra,
2020; Noble, 2006). In this paper, the penalty
parameter is set to 1 constantly. The kernel tricks are
another important influence factor that is designed to
solve the problem of linear inseparability by
projecting the data to a higher dimension (Noble,
2006). Among all the kernel tricks, the RBF kernel
has the strongest adaptability to unknown datasets.
Therefore, since the characteristics of the data used in
this paper are unclear, the RBF kernel is selected.
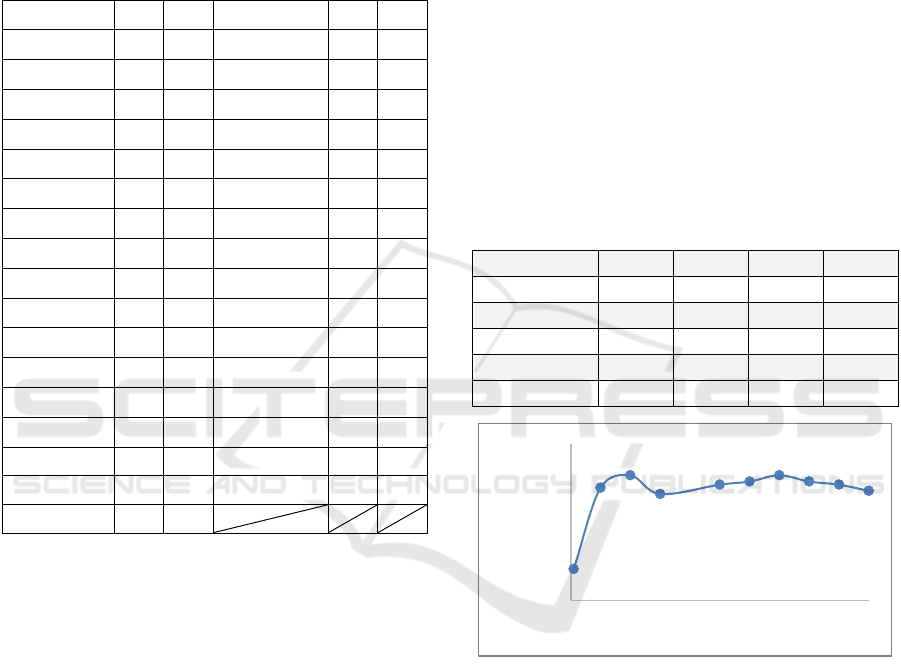
Table 3: The accuracy results of the SVM with different
gamma values.
Gamma 0.1 1 2 3
Accuracy 0.760 0.786 0.790 0.784
Gamma 5 6 7 8
Accuracy 0.787 0.788 0.790 0.788
Gamma 9 10 100 500
Accuracy 0.787 0.785 0.752 0.644
Figure 3: The changing curve of the accuracy of the SVM
over the gamma value.
When using the RBF kernel, gamma is the critical
parameter to the performance of an SVM. There is a
negative proportional relation between the gamma
and the radius of the influence of the support vector
(Sphinx-gallery, 2022). If the gamma is too large, the
radius of influence would become too small, which
leads to an overfitting result. Thus, the model would
be overly dependent on the training data and is unable
to classify unseen data successfully. On the other
hand, if the gamma is too small, the radius of
influence would be too large, resulting in forming a
hyperplane that is similar to the boundary of a linear
model (Sphinx-gallery, 2022), which means that the
0,75
0,76
0,77
0,78
0,79
0,8
0246810
Accuracy
Gamma
ICPRAM 2023 - 12th International Conference on Pattern Recognition Applications and Methods
868
model would be underfitting. To find a suitable
gamma for this research, a set of values are tested
initially, from 0.1 to 500.
The accuracy decreased significantly when the
gamma reached 100 and 500 (shown in Table 3).
Thus, 100 and 500 are obviously not the suitable
gamma. The rest of the gamma gave feedback of
fluctuations in the accuracy. In Figure 3, there are two
peaks corresponding to the gamma equal to 2 and 7.
Despite the two peaks are equal, the change rate of
accuracy around gamma equal to 2 is larger than the
change rate around gamma equal to 7. Therefore, 7 is
selected as the gamma of the RBF kernel for further
tests.
3.4 Evaluation Metrics
The performance of a classifier in this paper can be
evaluated through the following criteria, which are
accuracy, false positive rate (FPR) and false negative
rate (FNR).
Accuracy is the most intuitive criterion to evaluate
a classifier’s performance, which is defined as the
percentage of the correctly classified instances over
all instances. Indeed, higher accuracy does mean
better performance, but it depends on the design of
the dataset. If a dataset is extremely unbalanced with
a 99:1 ratio of positives to negatives, a classifier could
reach 99% accuracy but is unable to identify the
negative. Therefore, accuracy cannot be the only
standard to evaluate a classifier.
FPR and FNR are two important factors for the
practical application of a classifier. In this paper, FPR
is the reflection of whether a classifier can serve its
purpose, which is successfully identifying the
intruder log-in. A high FPR indicates that the system
is repeatedly recognizing the intruder as the true
owner, which would make the system pointless even
if it could achieve high overall accuracy. As for FNR,
high FNR would give the users a bad experience, as
it has a large chance of rejecting the users to access
their own accounts.
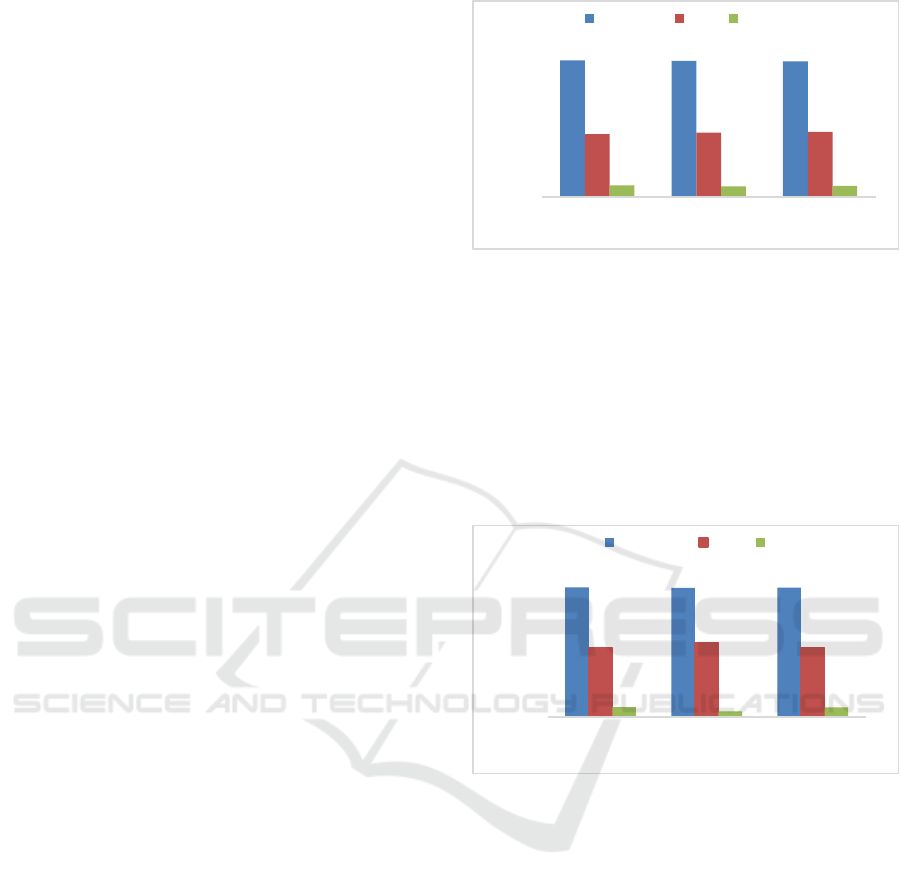
4 RESULTS AND ANALYSIS
The comparison of the results with different numbers
of features for Random Forest and Support Vector
Machine classifiers can be seen in Figure 5 and 6
respectively.
For the random forest algorithm, under the
circumstance of the accuracy stabilising around 78%,
as the number of features decreased from 33 to 21, the
Figure 5: The comparison of accuracy and FPR of the RF
classification with different numbers of features.
FNR reduced by 0.49% as well. Even though the
average FPR increased by 0.88%, this can still be
considered as an acceptable trade-off. On the
contrary, the performance of the classifiers with 17
features was relatively poor compared with the other
two scenarios. Not only the accuracy dropped to the
lowest, but the average FNR did not improve further.
Therefore, it is not suitable for real application.
Figure 6: The comparison of accuracy and FPR of the SVM
classification with different numbers of features.
For the support vector machine algorithm, there
was a 43% drop in the FNR, when the number of
features was cut down from 33 to 20. However, the
FPR experienced a 7.62% increase, which
compromised the performance of the classifier. The
reason for this could be the information loss was too
severe when filtering out a large number of features.
Thus, a classification with 31 features was tested by
only dropping the last two valuable features. The
results were not satisfying compared with the 33
feature classification, the average FNR had a minor
decrease of 0.09% with some sacrifices on the
performance of the average accuracy and FPR.
Overall, the SVM classifier with 33 features could be
the most suitable one for further development.
78,42%
78,20%
77,90%
36,04%
36,92%
37,27%
6,49%
6,00%
6,29%
0%
20%
40%
60%
80%
100%
33 21 17
Number of features
Accuracy FPR FNR
76,46%
76,15%
76,34%
40,49%
43,58%
40,81%
5,82%
3,30%
5,73%
0%
20%
40%
60%
80%
100%
33 20 31
Number of features
Accuracy FPR FNR
Addressing Privacy and Security Concerns in Online Game Account Sharing: Detecting Players Using Mouse Dynamics
869
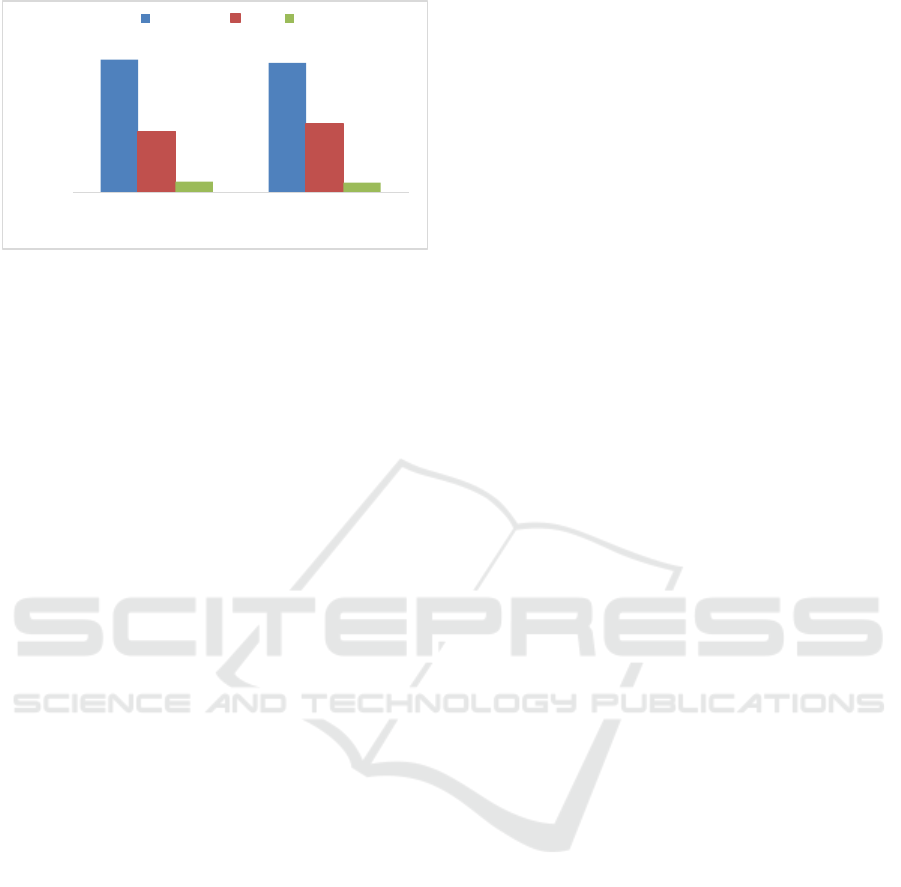
Figure 7: The comparison of accuracy and FPR from
different classifiers with 33 features.
The comparison of the results of the two
algorithms is shown in Figure 7. The random forest
classifier had better results in accuracy and FPR, and
its weakness is the FNR. On the contrary, the SVM
classifier had an advantage on the FNR, but the FPR
of it is also 4.45% higher than that of the random
forest classifier, which affects the SVM classifier’s
overall performance badly.
A common feature of the two classifiers is that
their average FPR were at a higher level compared
with the results from Siddiqui, Dave and Seliya’s
research (2021), even for random forest
classification, which was used in both studies. The
reasons for this gap could be the differences in the
number of instances in the datasets and the number of
imposters. The datasets in the previous research had
more genuine instances, which could offer more
information for the classifier to build the model.
Another difference is that the past research used a
dataset of 10 users for their classification including 1
genuine user and 9 imposters, while this paper
adopted a dataset of 20 users with 1 genuine user and
19 imposters. To keep a balance between the number
of genuine instances and the imposter instances, the
number of mouse actions taken from each imposter
would be fewer as the number of imposters increased.
Therefore, the class formed by the imposters would
be more complicated. All those factors could lead to
an increase in the FPR. Except for the not ideal value
of the average FPR, the two classifiers have
advantages over the one used in the past research in
accuracy and FNR. Therefore, it is reasonable to say
that the potential of these two classifers for user
authentication using mouse dynamics has been
proven.
However, the design of the dataset could be
further investigated to improve the performance of
the classifiers. In this paper, a mouse action is
composed of 10 mouse events, the number that has
been proven usable in past research. For now, there is
no research on the influence of the number of mouse
events composing a mouse action. It is possible that
different number settings would affect the calculation
of the features, which could further influence the
building of the classification model.
Moreover, to control the variables and mitigate
bias, the datasets are designed to be in a balanced
state, where the number of genuine actions and
imposters’ actions are equal. In practice, the number
of imposter actions that can be captured is much less
than that of the owner of the account. As mentioned
in the previous literature, a longer collection time
could help improve the performance of the classifier,
but also gives the intruder more time to operate on the
account, which leads to a failure of the mission of
preventing privacy leakage. Thus, the performance of
those classifiers using unbalanced datasets could be
the one of the future research targets.
Another aspect that requires further investigation
is the change in the mouse movement pattern of a
person. Teenagers are in a stage where their physical
fitness and neural responsiveness are gradually
growing, hence there is a large chance that the mouse
movement pattern of underaged children would
evolve rapidly as they grow up. On the other hand,
regardless of age, people’s mouse movement patterns
would evolve as they become more familiar with a
game. A person’s gaming skills would go from rookie
to expert with the increased playing time. Thus, it is
reasonable to deduce that the features of the mouse
movement would change as well. However, no matter
in this paper or the previous literature, only short-term
observations on the participants were conducted.
Therefore, to advance the practice application, further
research is needed on the classfiers’ adapting ability
to the changing user profiles.
5 CONCLUSIONS
In this paper, a user verification method was proposed
to detect account sharing action, which is using
machine learning classifiers to identify the identity of
the user from the input mouse actions. The tests have
shown that the random forest classifier is the most
suitable one for this task since it has the best accuracy
and lowest false positive rate. The SVM classifier has
an advantage in the false negative rate, and with
further parameter tuning, the SVM classifier could
still have the potential to achieve the authentication
task.
Another finding is that feature selection is
important for the performance of the classifiers. By
filtering out the proper features, it is possible to
78,42%
76,46%
36,04%
40,49%
6,49%
5,82%
0%
20%
40%
60%
80%
100%
RF SVM
Types of classifiers
Accuracy FPR FNR
ICPRAM 2023 - 12th International Conference on Pattern Recognition Applications and Methods
870

improve the performance of a classifier. However,
filtering off the wrong feature could cause too much
information loss, which makes the classifier unable to
do the job.
Overall, machine learning classifiers have been
proved to be able to identify whether the current user
is the true owner of a game account through mouse
dynamics. Although the results showed that it is not
suitable for real application for now, it can be a useful
tool to stop the game account sharing behaviour in the
future working with current countermeasures like
two-factor authentication.
REFERENCES
Antal, M., & Egyed‐Zsigmond, E. (2019). Intrusion
detection using mouse dynamics. IET Biometrics, 8(5),
285-294.
Beserra, I. D. S., Camara, L., & Da Costa-Abreu, M. (2016,
November). Using keystroke and mouse dynamics for
user identification in the online collaborative game
league of legends. In 7th International Conference on
Imaging for Crime Detection and Prevention (ICDP
2016) (pp. 1-6). IET.
Da Silva, V. R., & Da Costa-Abreu, M. (2018, July). An
empirical biometric-based study for user identification
with different neural networks in the online game
League of Legends. In 2018 International Joint
Conference on Neural Networks (IJCNN) (pp. 1-6).
IEEE.
ESA. (2020). 2020 essential facts About the video game
industry. Entertainment Software Association.
Retrieved 31 October 2022, from https://
www.theesa.com/resource/2021-essential-facts-about-
the-video-game-industry/
Financial COUNTRY (2022). Your Ride Is on the Way:
More than Half of Americans Are Using Shared
Services Like Uber, Lyft and Airbnb. Retrieved 5
August 2022, from https://www.prnewswire.
com/news-releases/your-ride-is-on-the-way-more-
than-half-of-americans-are-using-shared-services-like-
uber-lyft-and-airbnb-300719189.html
Gamboa, H., & Fred, A. (2004, August). A behavioral
biometric system based on human-computer
interaction. In Biometric Technology for Human
Identification (Vol. 5404, pp. 381-392). SPIE.
Hinbarji, Z., Albatal, R., & Gurrin, C. (2015, January).
Dynamic user authentication based on mouse
movements curves. In International Conference on
Multimedia Modeling (pp. 111-122). Springer, Cham.
Kulkarni, V. Y., & Sinha, P. K. (2012, July). Pruning of
random forest classifiers: A survey and future
directions. In 2012 International Conference on Data
Science & Engineering (ICDSE) (pp. 64-68). IEEE.
League of Legends Support. (2022). MMR / Elo Boosting.
Retrieved 5 August 2022, from https://support-
leagueoflegends.riotgames.com/hc/en-us/articles/2017
51834-MMR-Elo-Boosting
Misra, R. (2020). Support Vector Machines-Soft Margin
Formulation and Kernel Trick.
Matthews, T., Liao, K., Turner, A., Berkovich, M., Reeder,
R., & Consolvo, S. (2016, May). " She'll just grab any
device that's closer" A Study of Everyday Device &
Account Sharing in Households. In Proceedings of the
2016 CHI Conference on Human Factors in Computing
Systems (pp. 5921-5932).
Milella, V. (2022). Boosting is a crime: $18k fine and 2
years of jail in South Korea | Esports Tales. Retrieved
5 August 2022, from https://www.esportstales. com/
overwatch/boosting-is-a-crime-18k-fine-2-years-jail-
south-korea
Noble, W. S. (2006). What is a support vector machine?.
Nature biotechnology, 24(12), 1565-1567.
Obada-Obieh, B., Huang, Y., & Beznosov, K. (2020,
April). The burden of ending online account sharing. In
Proceedings of the 2020 CHI Conference on Human
Factors in Computing Systems (pp. 1-13).
RIOT GAMES. (2022). COMPETITIVE RULING: IAN
“CHRYSANIA” CHIN. Retrieved 4 August 2022,
from https://playvalorant.com/en-sg/news/esports/
competitive-ruling-ian-chrysania-chin/
SPHINX-GALLERY. (2022). RBF SVM parameters.
Retrieved 4 August 2022, from https://scikit-
learn.org/stable/auto_examples/svm/plot_rbf_paramet
ers.html
Siddiqui, N. (2022, April 6). Minecraft-mouse-dynamics-
dataset: Repository for data collected from the paper
"Continuous user authentication using mouse
dynamics, Machine Learning, and Minecraft ".
Retrieved October 28, 2022, from https://github.
com/NyleSiddiqui/Minecraft-Mouse-Dynamics-Dataset
Siddiqui, N., Dave, R., & Seliya, N. (2021). Continuous
Authentication Using Mouse Movements, Machine
Learning, and Minecraft. arXiv preprint
arXiv:2110.11080.
Witten, I. (2014). More Data Mining with Weka (5.2:
Multilayer Perceptrons) [Video]. YouTube:
WekaMOOC.
Weka 3: Machine Learning Software in Java. (n.d.).
Retrieved October 31, 2022, from https://www.
cs.waikato.ac.nz/ml/weka/.
Addressing Privacy and Security Concerns in Online Game Account Sharing: Detecting Players Using Mouse Dynamics
871
