
Simulation and Experiment of Ghost Imaging-OCT Target Imaging in
Scattering Media
Decai Huyan
a
, Nofel Lagrosas
b
and Tatsuo Shiina
c
Graduate School of Science and Engineering, Chiba University, Chiba-shi, Japan
Keywords:
OCT, Ghost Imaging, Scattering Media.
Abstract:
Conventional optical coherence tomography (OCT) target imaging is easily affected by scattering media and
gets error results in optical properties about transmittance and absorbance of the target. We propose a new
system for this problem by combining the Ghost Imaging(GI) technique and OCT on the measurement path.
Even if the modulated images by scatterers under its low signal-to-noise ratio, the GI technique can recon-
struct the images in the situation. Our system uses a single detector in the 2D dimensions to get the target
images in the scattering media by getting rid of the modulation. In this paper, we introduce the concept and
demonstrate the experimental method of Ghost Imaging-OCT, we call GI-OCT. We get the same shape in the
binarized images by comparing the GI-OCT experimental image with corrected modulation and the original
image without modulation. In the simulation we obtained the PSNR value of 47dB at 10% noise rate. In the
experiment we got the PSNR value of 18.89dB.The results prove our system is helpful for target imaging in
the scattering media.
1 INTRODUCTION
Optical coherence tomography (OCT) is an imag-
ing technique that can produce high-resolution to-
mographic images using a non-contact, non-invasive
method on a non-homogeneous medium(Huang et al.,
1991). Based on the principle of low coherence inter-
ference, OCT combines reflected light from the mea-
surement and reference paths to recover the optical
property distribution of an object at a depth direction.
OCT systems have been used in commercial cases and
have achieved great success in ophthalmology by pro-
viding detailed images from the inner retina. It has
recently been used to diagnose cases in cardiology
and dermatology(Gambichler et al., 2005). Moreover,
OCT is also used in many biomedical multilayer scat-
tering media, such as organs and skin(Spaide et al.,
2018). This imaging technique is very important in
early skin cancer detection and others.
This paper aims to detect no modulation target im-
age in a scattering media. This modulation repre-
sents the scattering in the OCT image. No modula-
tion means the OCT image is without the scattering.
a
https://orcid.org/0000-0002-2490-0439
b
https://orcid.org/0000-0002-8672-4717
c
https://orcid.org/0000-0001-9292-4523
In OCT measurements in scattering media, the tar-
get signal is always affected due to light attenuation
and scattering in the scattering media as the measured
light propagates in the depth direction. Such scat-
tering attenuation of the OCT signal can be reduced
by multi-angle incidence measurement and increas-
ing the number of measurements. However, in un-
known scattering media, these methods cannot elim-
inate the influence of the media on the target signal.
The scattering media may change the direction of the
measured light and cause a time delay. This makes it
difficult to get an accurate shape of the target and to
obtain an adequate image of the target in the scatter-
ing media.
Ghost imaging (GI) techniques have attracted at-
tention because they distinguish between signal and
noise. GI has been used in many fields since the
publication of the paper ”ghost imaging using a sin-
gle detector”(Bromberg et al., 2009). In this paper,
they presented that a single probe can illuminate a
sample with different patterns of light multiple times,
and reconstructed an image based on the relationship
between the reflected light total intensity and the il-
luminated light pattern. We propose a new method
to obtain target images in scattered media by com-
bining Ghost Imaging and TimeDomain-OCT (GI-
OCT)(Huyan et al., 2022). The proposed method
Huyan, D., Lagrosas, N. and Shiina, T.
Simulation and Experiment of Ghost Imaging-OCT Target Imaging in Scattering Media.
DOI: 10.5220/0011677400003408
In Proceedings of the 11th International Conference on Photonics, Optics and Laser Technology (PHOTOPTICS 2023), pages 67-73
ISBN: 978-989-758-632-3; ISSN: 2184-4364
Copyright
c
2023 by SCITEPRESS – Science and Technology Publications, Lda. Under CC license (CC BY-NC-ND 4.0)
67

in this paper can reconstruct images even when the
signal-to-noise ratio is low due to scattering, using the
ability of GI. By using this method, target images can
be obtained without scattering effects.
2 DIFFERENT OF
CONVENTIONAL OCT AND
GI-OCT
Unlike conventional OCT, the OCT probe light from
GI-OCT does not focus on a point but illuminates the
light on an area, as in full field-OCT(FF-OCT). This
method can take two-dimensional images with a sin-
gle probe. FF-OCT enables imaging of target dis-
tribution because the camera directly takes a cross-
sectional two-dimensional image perpendicular to the
optical axis. However, FF-OCT cannot obtain tar-
get distribution without the effect of scattering. FF-
OCT uses a megapixel camera to achieve cellular-
level imaging. Each pixel in an FF-OCT image is a
point measurement of the target, the same as conven-
tional OCT(Vabre et al., 2002).
For ease of understanding, we show the target
(scattered sample) in the scattering media in two parts
on the OCT measurement. The former is the scat-
ter layer before the light hits the target, and the latter
is the target layer. When measuring the target layer
in the scatter media with conventional OCT, a three-
dimensional image can be constructed by changing
the reference light path (A scan) and orthogonal mo-
tion of the probe (B scan) as shown in Figure 1(a).
However, the reflected signal does always have scat-
tering from the scatter layer, so the target layer dis-
tribution had modulated by scattering. For example,
when measuring the optical properties (transmittance
and absorbance) of a target layer with OCT, the dis-
tribution of the front scatter layer may change the di-
rection of the light or delay the received signal of the
target layer due to scattering. As a result, the modu-
lated image of the optical properties of the target layer
is detected.
Figure 1(b) illustrates the concept of GI-OCT, in
which GI-OCT probe light passes through an ex-
pander and spatial light modulator (SLM), and the
generated light patterns illuminate the target layer be-
hind the scatter layer. Reflected light from the tar-
get and scatter layers are focused on a point detec-
tor. The A-scan signal of GI-OCT is a series of light
intensities separated in the depth direction for each
light illuminated pattern. Every A-scan signal can be
separated as the sum of the illuminate pattern inten-
sities for each layer distribution with the axial resolu-
tion of OCT. After repeated measurements with dif-
ferent light patterns, the correlation between those il-
luminated patterns and the sum of interference inten-
sities of each separated layer is calculated by using
the GI method to obtain each layer distribution. Each
separated layer is reconstructed in a multilayer sam-
ple(3D).
Compared to conventional OCT measurements,
GI-OCT acquires a two-dimensional image in the
plane perpendicular to the optical axis with a sin-
gle detector. Light misalignment to other directions
and time delay in scattering media can be simultane-
ously summed and detected as OCT interference sig-
nals. The misalignment and delay are constructed as a
scatter layer distribution. The target layer distribution
and the former scattering layer distribution can be re-
constructed using the same procedure. By the scatter
layer distribution, the optical properties of the target
layer can be corrected, and the target distribution is
obtained without the scatter layer effects.
3 EXPERIMENT
Figure 3(a) shows the GI-OCT experiment setup.
The GI-OCT uses the superluminescent diodes (SLD)
light source with a central wavelength of 860 nm,
Gaussian distribution, and an axial resolution of
10.1µm. The reference path consists of a steady ro-
tating motor and a fixed mirror to complete the axial
scanning (A-scan)(Shiina et al., 2003). The measure-
ment path of GI-OCT has the optical probe, which
is composed of a collimator and two lenses to make
the beam diameter expand. The DMD chip (DLP2000
DMD) is placed in the measurement area. The sample
is set between the DMD chip and the optical probe.
There is a matrix corresponding to 640 × 360
and a total size of 4.84 × 2.72mm micromirrors ar-
ranged inside the DMD chip. Each mirror size is
7.56 × 7.56 µm, and the deflection angle is ±12 de-
grees on the diagonal axis, divided into ”on” and ”off”
states. Then, the DMD chip in our experiments is ori-
ented towards the vertical optical axis 12 degree to
obtain the reflected light from the DMD. DMD chips
are rotated 45 degrees counterclockwise in the verti-
cal plane against the optical axis to make the diagonal
axis vertical too. Moreover, the DMD is tilted 12 de-
gree against the optical axis when the micromirrors
state is ”on”. Because of these tilts, this DMD ori-
entation causes a series of interference signals in the
time domain, as shown in Fig 3(b). In GI-OCT ex-
periment, the DMD chip displays 10 × 10 speckles
patterns in the area, which is 2 × 2mm in size.
We prepare a sample with the target in the scatter-
PHOTOPTICS 2023 - 11th International Conference on Photonics, Optics and Laser Technology
68
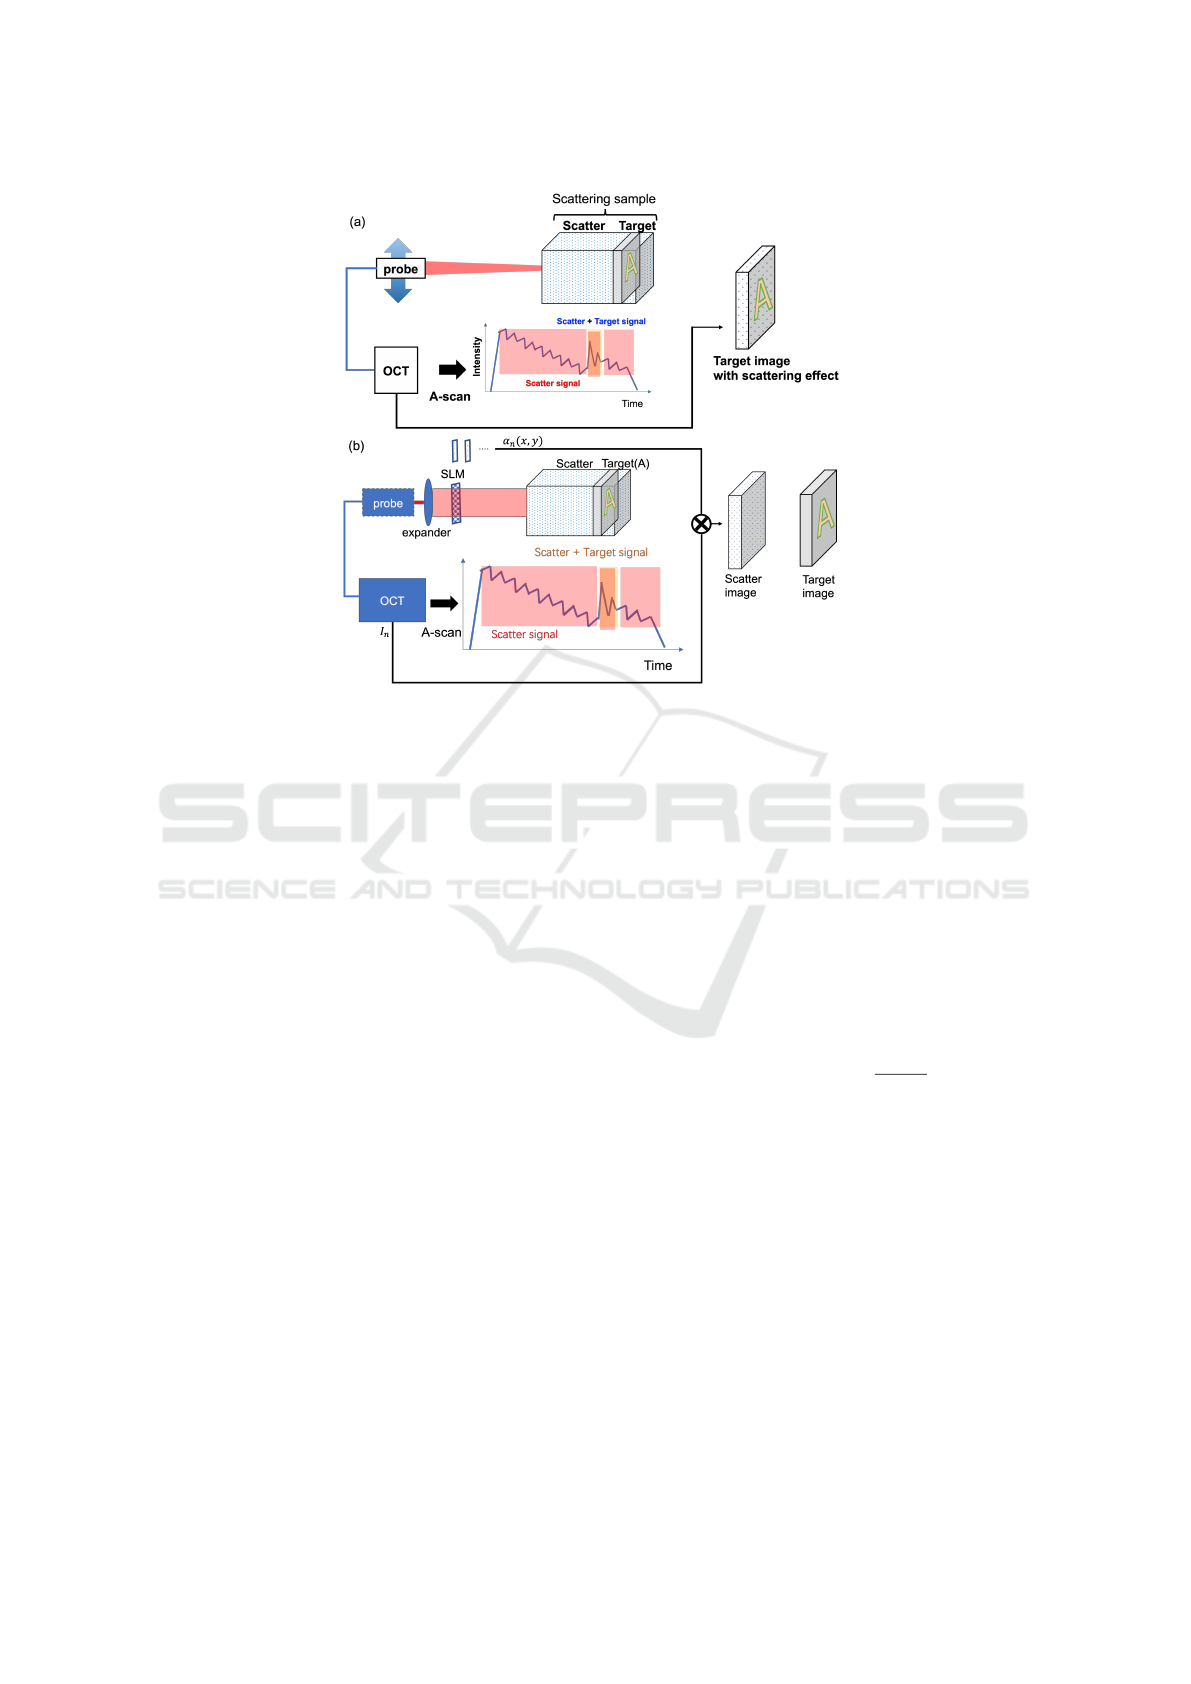
Figure 1: Setup of (a) a conventional OCT, that produces the target image with scattering influence. (b) GI-OCT, that produces
the scatter image that can be used to generate the target image without the scattering influence. The difference between (a)
and (b) is the presence of the beam expander and SLM in the GI-OCT setup.
ing media, and it has two layers: the first layer is the
scatter layer, and the second layer is the target layer.
Both layers are painted with water-based pigments on
a slide glass. The target layer has the character ”F”,
and the scatter layer was half-covered on the diagonal
axis with paint. The water-based pigment adhered to
the slide glass uniformly, and the pigment attenuation
rate was 53%.
In our experiments, we set the DMD chip in the
GI-OCT measurement area, and the reflected light
from the DMD chip passes through the sample and
returns to the probe. With this setup, the concept of
GI-OCT about eliminating modulation becomes clear.
Because the DMD chip is located in the measurement
area, its reflection efficiency is high, resulting in more
stable light intensity. This setup eliminates the influ-
ence from many different layers and focuses on re-
constructing the target layer with one scattering layer.
However, we used four separate experiments for
this experimental design to achieve our purpose. Ex-
periment 1: OCT beam distribution measurement (not
any layers); Experiment 2: target layer measurement;
Experiment 3: scatter layer measurement; Experi-
ment 4: target layer overlapping scatter layer mea-
surement.
4 SIMULATION
To validate our proposed GI-OCT technique, we per-
formed simulation experiments on the reconstruction
of target imaging. First, we explain the evaluation
method for the quality of the reconstructed image,
which is the peak signal-to-noise ratio (PSNR) used
for comparing the reconstructed of original image. It
approximates human perception of reconstruction im-
age quality and is calculated using Eq.(1).
PSNR = 10 · log
10
(
MAX
2
MSE
) (1)
MSE is the mean squared error of the original and
reconstructed picture. MAX is the maximum possible
pixel value in the image. In an 8-bit image, accep-
tance values for the PSNR in the original and recon-
structed pictures should be over 30 dB to achieve a
higher reconstruction quality.
In the OCT measurements, the quality of the OCT
image is degraded by noise, due to the slight move-
ment of the sample, limited light bandwidth, phase
aberrations of propagating beam, the aperture of the
detector, and multiple scattering within the coherence
length. So we evaluate noise influence on the recon-
structed image.
We implemented multiple GI methods, includ-
ing computational ghost imaging (CGI), differential
Simulation and Experiment of Ghost Imaging-OCT Target Imaging in Scattering Media
69
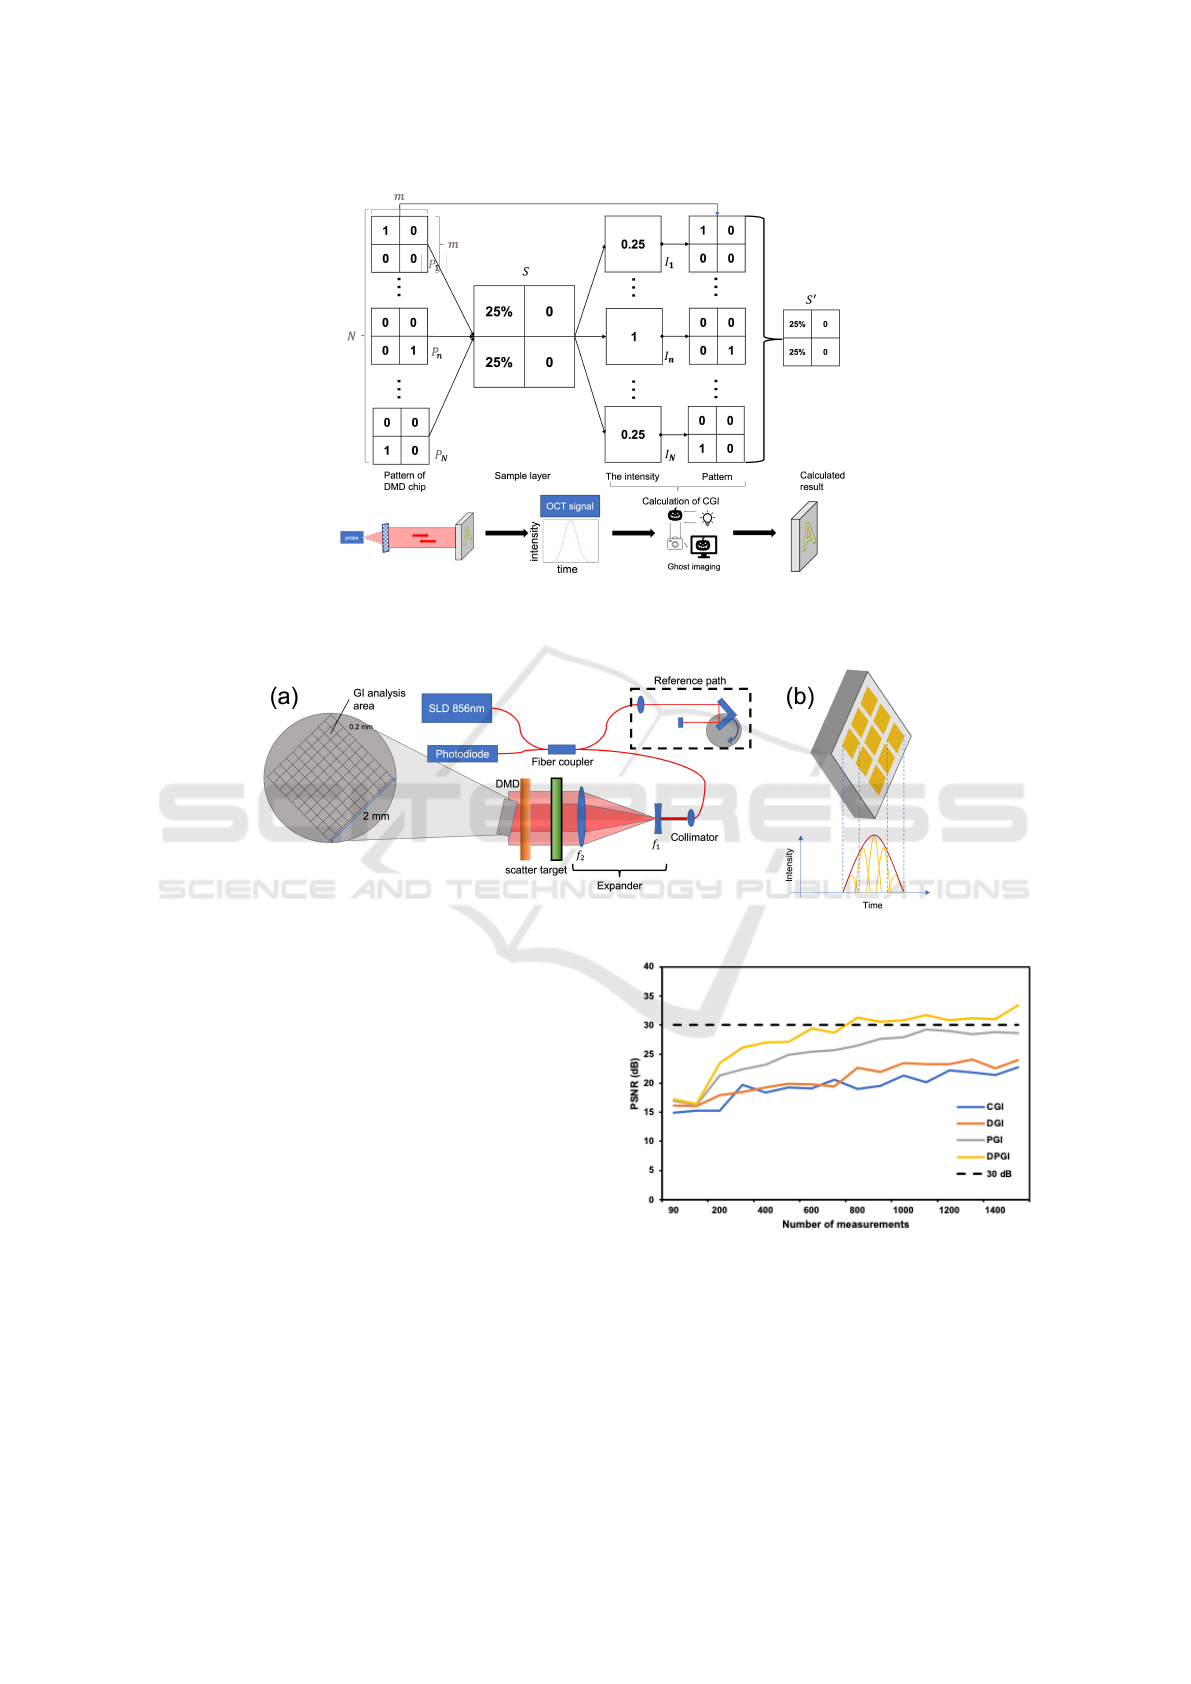
Figure 2: The steps of GI-OCT measurement: light pattern from the probe and SLM illuminates the sample to obtain the
intensity of the OCT signal (intensity vs time graph) which can be calculated together with the pattern to produce the GI-OCT
result. The matrices show the visualization of calculation process.
Figure 3: (a) Experiment set-up of GI-OCT. (b) The DMD micromirrors reflected signals in the time domain.
ghost imaging (DGI), pseudo-inverse ghost imaging
(PGI), and differential pseudo-inverse ghost imaging
(DPGI), to determine which one was appropriate for
GI-OCT.(Ferri et al., 2010; Zhang et al., 2014) CGI
is the calculation of pattern and light intensity, DGI
is the difference between pattern and light intensity,
PGI is the inverse matrix calculation of pattern and
light intensity, and DPGI is the inverse matrix differ-
ence between pattern and light intensity. Between 90
and 1500 OCT measurements, we set noise at 10%
of signal intensity in the OCT simulation (signal to
noise ratio ≈ 10%). The simulation results with noise
effects of reconstruction image quality are shown in
Figure 4. The noise is the random value on each pat-
tern in the gradation −25 ∼ 25, which is 10% image
value in the 8 bits image.
In Figure 4, starting with the number of measure-
ments from 200 to 1500, the DPGI results are the best,
and the PSNR value is beyond the acceptance value
of 30 dB at the 800 measurements. PSNR’s values
of PGI, DGI and CGI are all below 30dB. It can be
Figure 4: PSNR values derived from GI simulation with
10% noise.
concluded that the DPGI has the best reconstruction
efficiency for our OCT application.
As shown in Figure 5, we simulated the scatter and
target layers in the experiment. Based on the experi-
ment, we used a 10 × 10 pixel resolution in this simu-
lation. Figure 5 (a) shows the simulated scatter layer.
PHOTOPTICS 2023 - 11th International Conference on Photonics, Optics and Laser Technology
70
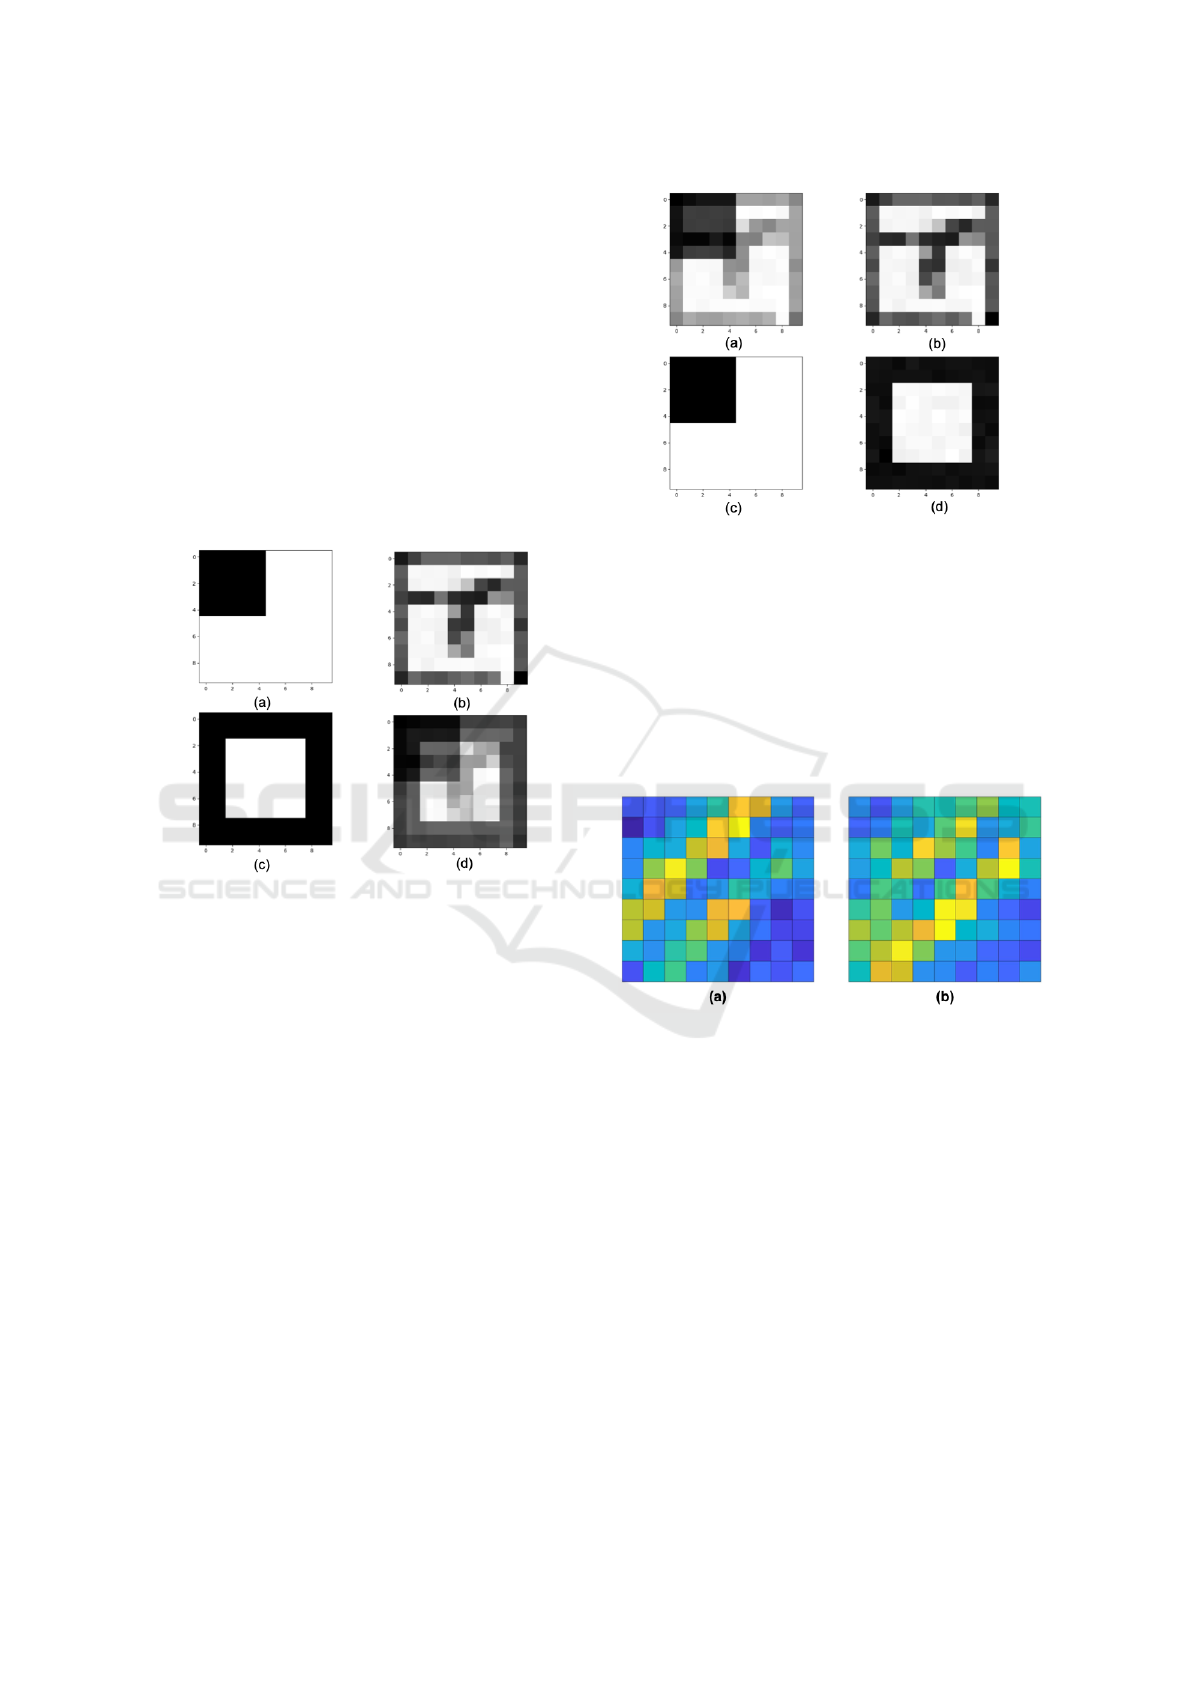
To simplify the calculation and to easily distinguish
the effect of the scatter layer, we masked 1/4 of the
area as a scatter layer. Figure 5 (b) shows the target
layer obtained from the photograph of the letter ’T’.
By loading a photograph with the letter ’T’ and resiz-
ing it to 10 × 10 pixel image. Because the OCT beam
is expanded in the GI-OCT measurement, causing the
light intensity distribution affects the target result, we
added the OCT beam to the simulation experiment, as
shown in Figure 5 (c). By using the DPGI method
on the 800 measurements with 10% random noise,the
image from the GI-OCT measurement is obtained and
shown in Figure 5 (d). Figure 5 (d) shows the image
of target layer overlapping the scatter layer and OCT
beam distribution with 10% random noise.
Figure 5: Simulation images. (a)scatter image. (b)light dis-
tribution. (c)target image. (d)overlaps (a), (b) and (c).
After correcting layer by layer with Figure 5 (d),
we obtain the results of GI-OCT, as shown in Fig-
ure 6. Figure 6 (a) shows the simulation results after
correcting the OCT beam distribution. This result is
corrected in Figure 5 (d) using the OCT beam distri-
bution in Figure 5 (c). Figure 6 (b) shows the result of
the corrected target layer, which can be successfully
identified as the letter ’T’. By calculating the PSNR
value for the reconstructed image in Figure 6 (b) with
the original image in Figure 5 (b), we get 47dB, which
is acceptable. Not only that, but we also reconstructed
the scatter layers and obtained Figure 6 (c). The re-
constructed scatter layers have the same distribution
as the original scatter layers in Figure 5 (c). Mean-
while, the OCT beam distribution(Figure 6c) is also
reconstructed with the same result of Figure 5 (c).
Figure 6: Simulation results. (a)target and scatter image
corrected light distribution. (b)target image corrected scat-
ter effect. (c)scatter image. (d)light distribution.
5 RESULTS
The distribution of the OCT beam, target layer, scat-
ter layer, and the target layer overlapping the scatter
layer was obtained from Experiments 1, 2, 3, and 4,
respectively.
Figure 7: The results of GI-OCT. (a) target layer distribution
overlapped beam distribution. (b) target layer distribution
overlapped beam distribution and scatter layer distribution.
Figure 7 (a) is the target layer distribution. It is
the result overlapped with the OCT probe beam dis-
tribution. A diagonal stroke can be seen from right
upper to left bottom, similar to the vertical stroke of
the character ”F”. It is difficult to identify the two
horizontal strokes of the character ”F.”. Figure 7 (b)
is target layer overlapped by the scatter layer. This
result have the OCT probe beam and the scatter layer
distributions, too. No stroke of the character ”F” can
be recognized.
We normalize each image of GI-OCT results from
four experiments. First, we remove the OCT beam
distribution from the target layer distribution to ob-
tain Figure 8 (a). One stroke on the diagonal and two
vertical strokes can be clearly identified, forming the
Simulation and Experiment of Ghost Imaging-OCT Target Imaging in Scattering Media
71
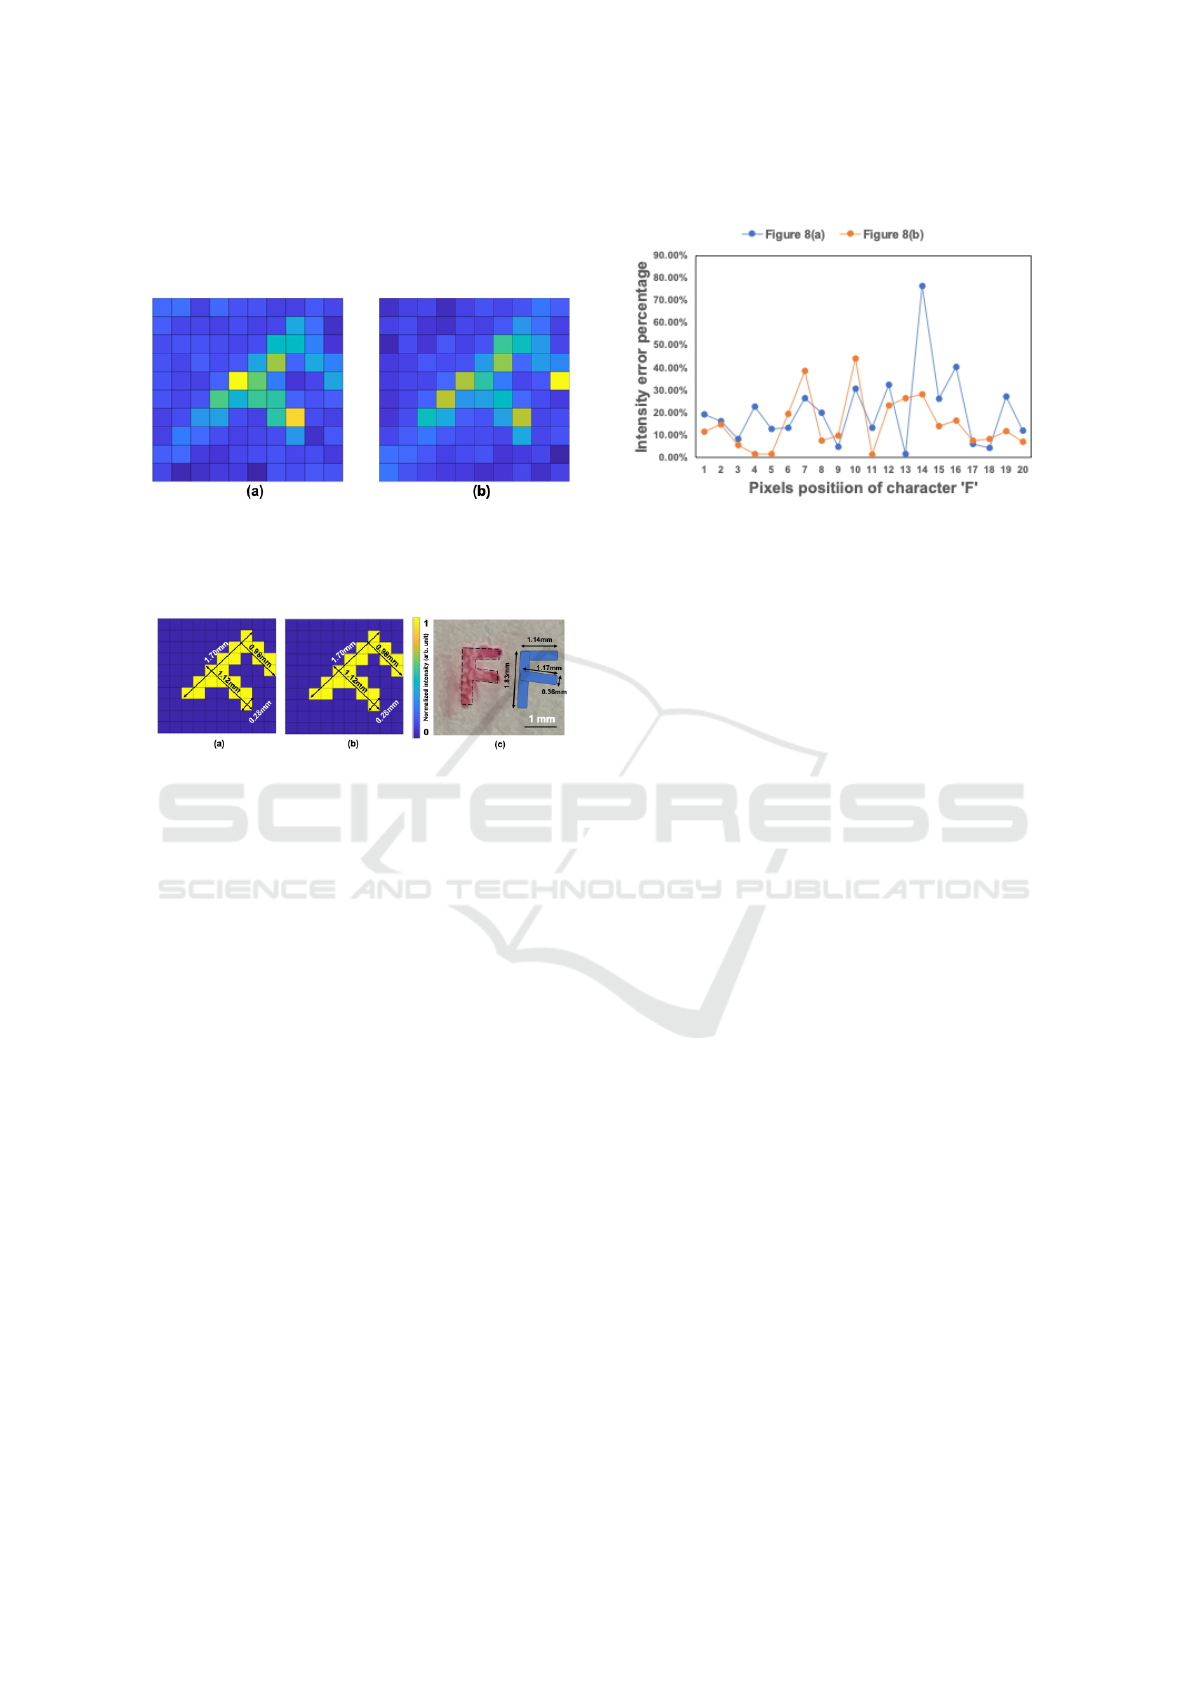
character ”F”. We also remove the scatter distribution
from the target layer overlapped by the scatter layer
distribution to obtain Figure 8 (b). And this process
has recovered the OCT beam distribution.
Figure 8: GI-OCT reconstructed images. (a) target layer
distribution without beam distribution. (b) corrected tar-
get layer distribution without beam distribution and scatter
layer distribution.
Figure 9: GI-OCT-reconstructed images with binarization
of (a) original target layer image, (b) corrected target layer
image.
Figure 8 (b) shows the same distribution of the
character ”F” as show in Figure 8 (a). We regard
Figure 8 (a) as the original distribution of the target
layer image, and Figure 8 (b) as the target layer image
obtained after correction by scattering effects. The
PSNR of the corrected target layer image in Figure
8 (b) is calculated to be 18.08 dB with the original
target layer image in Figure 8 (a).
With an appropriate threshold value, binarization
can result in Figures 9 (a) and (b) from Figures 8 (a)
and (b). They have an identical distribution, and their
PSNR is 160 dB. Moreover, we quantify the average
stroke lengths of the character ”F” in Figure 9 (c) and
estimate the error rate to evaluate our experimental
results. The error rate is the ratio of the stroke length
of the reconstructed image to the length of the orig-
inal target stroke. In Figure 9 (c), the length of the
upper horizontal is 1.14 mm, the middle horizontal is
1.17mm, and the vertical stroke is 1.83 mm, and the
widths of these strokes are 0.36mm. As compared
to Figure 9 (a) and (b), we get the average length
of the upper horizontal, middle horizontal, and ver-
tical strokes, and their stroke widths are 0.98mm,
1.12mm, 1.70mm and 0.28 mm, and the error rates
are 14.0%, 4.2%, 7.1% and 22.2%, respectively. Er-
rors in stroke lengths and widths are smaller than
0.2mm.
Figure 10: The intensity error percentages between (a) the
original target layer compared with uniform distribution.
(b) the corrected target layer compared with uniform dis-
tribution. The uniform distribution is the binanirized ideal
image in Fig.9.
As a result of the GI reconstruction, the target
layer’s total transmission can be adjusted to reorder
the target’s actual transmittance distribution. In our
experiment, the original target layer’s total transmis-
sion is 47%. And the total transmission of the cor-
rected target layer is 47%, too. So we rearranged the
transmission distribution in Figure 8 (a) and (b). The
average transmission deviations in Figure 8 (a) and
(b) are 20.0% and 14.8%, respectively. The deviation
of each pixel is compared to an ideal uniform target
layer distribution, as shown in Figure 9. The vertical
coordinate is the deviation percentage of each pixel
with the mean transmission. The horizontal coordi-
nate indicates the pixel of the character from top to
bottom in Figure 8 (a) and (b). This indicates that
the solidification of the pigment is not uniform. Due
to the limitation of the number of measurements and
not 100% reproducibility of the pattern intensity, the
target distribution is not completely consistent, so the
transmission deviation trends are partly consistent in
Figure 10. This deviation trend can be interpreted as
the actual target transmittance distribution.
6 CONCLUSION
Our research aims to eliminate the scattering influ-
ence of scattering media on the target layer’s optical
properties, for which we propose a new method called
GI-OCT. We simulated the measurement of a target
layer affected by a scatter layer and added the effect
of the OCT beam and noise during the measurement.
The GI-OCT measurement method was used to ob-
tain a target layer without the scattering effects. A
PSNR value of 47 dB was obtained for the original
PHOTOPTICS 2023 - 11th International Conference on Photonics, Optics and Laser Technology
72

and corrected image by correcting the effects of the
OCT beam and noise.
In the experiment, we successfully reconstruct the
target layer distribution without scattering influence
by using the GI technique to the OCT measurement
path in a two-dimensional area. In the lower number
of measurements, the PSNR value of our results is
18.08dB, but the target layer of character ”F” can be
identifiable. In the binarized images, we successfully
acquired the target shapes without scattering effects
and obtained the PSNR value of 160dB. The quanti-
tative target length obtained an error smaller than the
resolution, which is 0.2mm.
Our next step is to work on the scattering effects
on image reconstruction in flowing scatter.
REFERENCES
Bromberg, Y., Katz, O., and Silberberg, Y. (2009). Ghost
imaging with a single detector. Physical Review A -
Atomic, Molecular, and Optical Physics, 79(5):1–4.
Ferri, F., Magatti, D., Lugiato, L. A., and Gatti, A. (2010).
Differential ghost imaging. Physical Review Letters,
104(25):1–4.
Gambichler, T., Moussa, G., Sand, M., Sand, D., Altmeyer,
P., and Hoffmann, K. (2005). Applications of opti-
cal coherence tomography in dermatology. Journal of
Dermatological Science, 40(2):85–94.
Huang, D., Swanson, E. A., Lin, C. P., Schuman, J. S., Stin-
son, W. G., Chang, W., Hee, M. R., Flotte, T., Gregory,
K., Puliafito, C. A., and Fujimoto, J. G. (1991). Opti-
cal coherence tomography. Science, 254(5035):1178–
1181.
Huyan, D., Lagrosas, N., and Shiina, T. (2022). Target
imaging in scattering media using ghost imaging opti-
cal coherence tomography. APL Photonics, 7(8).
Shiina, T., Moritani, Y., Ito, M., and Okamura, Y. (2003).
Long-optical-path scanning mechanism for optical co-
herence tomography. Applied Optics, 42(19):3795.
Spaide, R. F., Fujimoto, J. G., Waheed, N. K., Sadda, S. R.,
and Staurenghi, G. (2018). Optical coherence tomog-
raphy angiography. Progress in Retinal and Eye Re-
search, 64(June 2017):1–55.
Vabre, L., Dubois, A., and Boccara, A. C. (2002). Thermal-
light full-field optical coherence tomography. Opt.
Lett., 27(7):530–532.
Zhang, C., Guo, S., Cao, J., Guan, J., and Gao, F. (2014).
Object reconstitution using pseudo-inverse for ghost
imaging. Optics Express, 22(24):30063.
Simulation and Experiment of Ghost Imaging-OCT Target Imaging in Scattering Media
73
