
A Framework for Explaining Accident Scenarios for Self-Driving Cars
Omar Wahbi, Yasmin Mansy, Nourhan Ehab and Amr Elmougy
German University in Cairo, Cairo, Egypt
Keywords:
Explainable Artificial Intelligence, Self-Driving Cars, Counterfactual Explanations.
Abstract:
In the current state of the art, intelligent decision-making in autonomous vehicles is not typically comprehen-
sible by humans. This deficiency prevents this technology from becoming socially acceptable. In fact, one of
the most critical challenges that autonomous vehicles face is the need for making instantaneous decisions as
there are reports of self-driving cars unnecessarily hesitating and deviating when objects are detected near the
vehicle, hence possibly having car accidents. As a result, gaining a thorough understanding of autonomous
vehicle reported accidents is becoming increasingly important. In addition to making real-time decisions, the
autonomous car AI system must be able to explain how its decisions are made. Therefore, in this paper, we
propose an explanation framework capable of providing the reasons why an autonomous vehicle made a par-
ticular decision, specifically in the occurrence of a car accident. Overall, results showed that the framework
generates correct explanations for the decisions that were taken by an autonomous car by getting the nearest
possible and feasible counterfactual.
1 INTRODUCTION
Autonomous vehicles have been a long-term project
for carmakers, researchers, and government agencies
where significant progress has been made. They are
complex intelligent systems that combine technology
for environmental awareness, path planning, motion
control, and decision-making. Autonomous driving
is likely to transform road traffic by reducing current
factors such as accidents and traffic congestion. This
can be accomplished by developing intelligent vehi-
cles capable of making correct decisions. The idea
of how to develop a high-intelligence and reliable ve-
hicles is rapidly becoming the focus of study in the
field of autonomous driving. The decision-making
process of a vehicle is expressed in terms of gener-
ating human-level safe and reasonable driving behav-
iors while taking into account the surrounding envi-
ronment such as the motion of other traffic partici-
pants, and the state estimation of ego vehicles.
However, there are still many uncertainties and
problems to solve, as the deployment of a self-driving
car environment involves not only technical automo-
tive technology, but also human behavior and traf-
fic management methods, among other things. From
a technical point of view, the unmistakable detec-
tion of obstacles is a challenging problem to confront
when traveling at high speeds and across long dis-
tances (Mart
´
ınez-D
´
ıaz and Soriguera, 2018). All of
these factors are specifically relevant in the case of
a car accident. This is because accidents made by
autonomous vehicles hinder their trust and adoption
since stakeholders do not have faith or completely
comprehend the vehicle’s decision-making capabili-
ties. As a result, effective methods for improving self-
driving cars’ confidence and trust must be developed.
The provision of explanations is a primary means of
increasing the understandability and trustworthiness
of autonomous vehicle technologies (Omeiza et al.,
2021), as it will also provide for the stakeholder what
exactly led to a certain situation to occur.
The process of explaining complex and intelli-
gent systems is known as Explainable AI (XAI). It is
a resurgent research topic that has seen tremendous
growth in recent years (Vilone and Longo, 2021),
as the need to advocate for principles and promote
the explainable decision-making system and research
continues to grow (Islam et al., 2021). Moreover, the
emphasis on XAI and the right to explanation that is
stressed by the GDPR shows the importance of expla-
nations in complex systems, particularly when they
are powered by black-box models. These complex
systems, such as autonomous vehicles, not only be-
have in a complex manner but also have a sensitive
and life-threatening effect. Hence, the need for un-
derstanding the decision-making of self-driving cars
366
Wahbi, O., Mansy, Y., Ehab, N. and Elmougy, A.
A Framework for Explaining Accident Scenarios for Self-Driving Cars.
DOI: 10.5220/0011674000003393
In Proceedings of the 15th International Conference on Agents and Artificial Intelligence (ICAART 2023) - Volume 3, pages 366-373
ISBN: 978-989-758-623-1; ISSN: 2184-433X
Copyright
c
2023 by SCITEPRESS – Science and Technology Publications, Lda. Under CC license (CC BY-NC-ND 4.0)

in car accident scenarios is crucial to the development
of safer vehicles.
In this paper, we propose an explanation frame-
work for a self-driving car capable of providing expla-
nations for the users as to why the car took a certain
decision in accident situations. The remaining part of
this paper is structured as follows. Section 2 provides
an overview of the system design and explains some
of its building components. Next, Section 3 shows the
process for generating an explanation to the decisions
that were made by an autonomous car in accident sce-
narios. Then, Section 4 describes the evaluation met-
rics that were used and the results, which show the
performance of the system when tested against these
metrics. Finally, Section 5 concludes the paper and
outlines some potential future work.
2 SYSTEM DESIGN
The objective of this system is to generate explana-
tions for why a self-driving car made a specific de-
cision in car accident situations. To build this sys-
tem and hence comprehend its design, it is necessary
to first understand the different components involved.
A pipeline was designed for this system as shown in
Figure 1. The first component is the data in which
the system is provided with tabular datasets that con-
tain data for car accident scenarios. Then, the system
loads and preprocesses a dataset to be ready for fur-
ther usage. Next, a Random Forest classifier is being
defined to fit and train it on the preprocessed dataset.
After that, the trained model is passed to the next
stage of the pipeline which is the generation of a coun-
terfactual explanation for a specified input datapoint.
Finally, the produced counterfactual is translated into
English phrases to provide a deep understanding for
the taken decision. Each one of these components will
be explained further in the upcoming sections.
2.1 Data Collection
The first component of the system pipeline is to have
inputted data. To date, there aren’t any sufficient
car accident datasets that provide what were the fea-
tures that were working or malfunctioning in the au-
tonomous vehicle during the occurrence of an acci-
dent. This issue was resolved using the Carla simula-
tor as described in the next sections.
2.1.1 Carla Simulator
The Carla simulator is an open-source urban driving
simulator (Dosovitskiy et al., 2017). It helps with au-
Figure 1: System Design.
tonomous driving system prototyping, validation, and
performance analysis. It includes urban layouts, var-
ious vehicle models, pedestrians, obstacles, etc. The
simulation platform has a lot of cameras such as RGB
and depth cameras, a plethora of sensors, for exam-
ple, LIDAR and RADAR sensors, and different detec-
tors such as collision and obstacle detectors. Further-
more, it allows for other variety of configurations for
sensors, detectors, speed, acceleration, and weather
environment, among other things (Dosovitskiy et al.,
2017). Before recording any data, the main vehicle
used had to be set up. So, the car was attached with a
RGB camera, and an obstacle detector. In order to be
able to record different outcomes, in each simulation,
the car’s features were changed by conducting several
experiments.
Autonomous Vehicle Accidents Datasets
This research mainly focused on two cases, stationary
objects and chain reactions. So, a dataset was cre-
ated for each case. For stationary objects, the case in-
volved a self-driving car approaching a static obstacle
as shown in Figure 2. In this case, different obstacles
were used, and with each one, the different features
in the autonomous vehicle that were mentioned in the
previous section were changed to record the car’s be-
havior and what decision did it take. For chain reac-
tions, the case involved a starting object initiating an
action that resulted in other sequences of actions. It
included three self-driving cars all approaching an in-
tersection point as shown in Figure 3. Again, for each
autonomous vehicle different features were changed
to record how did each car behave and what decision
did each one of them take, however, with an adjust-
ment of alternating the obstacle detector’s hit radius
between 0.2, 0.5, and 0.7 degrees. Overall, Carla was
used to execute simulations under these various con-
ditions.
A Framework for Explaining Accident Scenarios for Self-Driving Cars
367

Figure 2: Stationary Objects.
Figure 3: Chain Reactions.
2.2 Load and Preprocess Data
The second component of this system is to load and
preprocess the data. This stage is composed of four
sub-stages: loading the data, feature selection, split-
ting the data, then balancing the data. The first sub-
stage is loading a specified dataset either the sta-
tionary objects dataset or the chain reactions dataset.
Then, the next sub-stage is feature selection, which
is when categorical data are present in a dataset, it
is necessary to transform them into one-hot encoded
values or to remove them entirely (Singh, 2021). In
this research rather than removing the categorical data
completely, one-hot encoding was used to have each
categorical value converted into a new categorical
column and give a binary value of 0 or 1 to those
columns, after that concatenate the new columns to
the dataset and drop the old ones. Next, the data
was split up into train and test datasets in a ratio of
80:20. Finally, a dataset can be imbalanced because
its classes were distributed unequally in the splitting
sub-stage which can create problems in future tasks.
The oversampling technique, which randomly gener-
ates more examples to the minority class to be equal
to the majority class, was used to balance the dataset
as to keep all the information in the dataset rather than
dropping some of them.
3 EXPLANATION GENERATION
3.1 Random Forest Classifier
This research was performed with the Random For-
est Classifier using the sklearn Machine Learning
Library for Python also known as scikit-learn (Pe-
dregosa et al., 2011). Random forest is a supervised
machine learning algorithm that is commonly used to
solve classification and prediction problems (Kullarni
and Sinha, 2013). It averages the results of numer-
ous decision trees fitted to distinct subsets of a dataset
to improve the dataset’s predicted accuracy. It also
doesn’t use a single decision tree; instead, it uses the
predictions from each tree to anticipate the final result
depending on the majority of votes. The reason why
the random forest classifier was used is that it is con-
sidered highly accurate (Ali et al., 2012). Finally, the
data were classified into an accident and no accident.
3.2 Counterfactual Explanations
This is the fourth component of this system. It is an
example-based explanation technique that uses spe-
cific instances or a single record from the dataset to
explain the model’s behavior. Also, it’s a counter fact
that gives the user the possibility to change a situation
and explains what the user could have done to avoid a
scenario.
In this system, the selected counterfactual expla-
nation framework was DICE using a Python library
named dice-ml (Mothilal et al., 2020). DICE is built
on the idea of creating counterfactual examples to a
current situation. Other examples will be generated
with the majority of feature values nearly identical to
the original example, with a few values modified, re-
sulting in the model predicting the opposite class than
the one it has already predicted (Singh, 2021). The
inputs to the model are the trained Random Forest
classifier and a specified input instance from the test
dataset. Then, a number of counterfactual examples is
defined such that when produced, all of them lead to
a different outcome than the input instance outcome.
Two cases were tested one involving stationary ob-
jects and one involving chain reactions.
For the stationary objects case, an explanation was
needed to know why the autonomous vehicle decided
not to avoid crashing into an object. So, several coun-
terfactuals were generated as provided in Figure 4.
It shows that the original instance had an outcome
of one meaning that the car made an accident and
the generated counterfactuals outcomes were zero.
This means that the provided counterfactual examples
show how the car could have avoided that accident.
ICAART 2023 - 15th International Conference on Agents and Artificial Intelligence
368
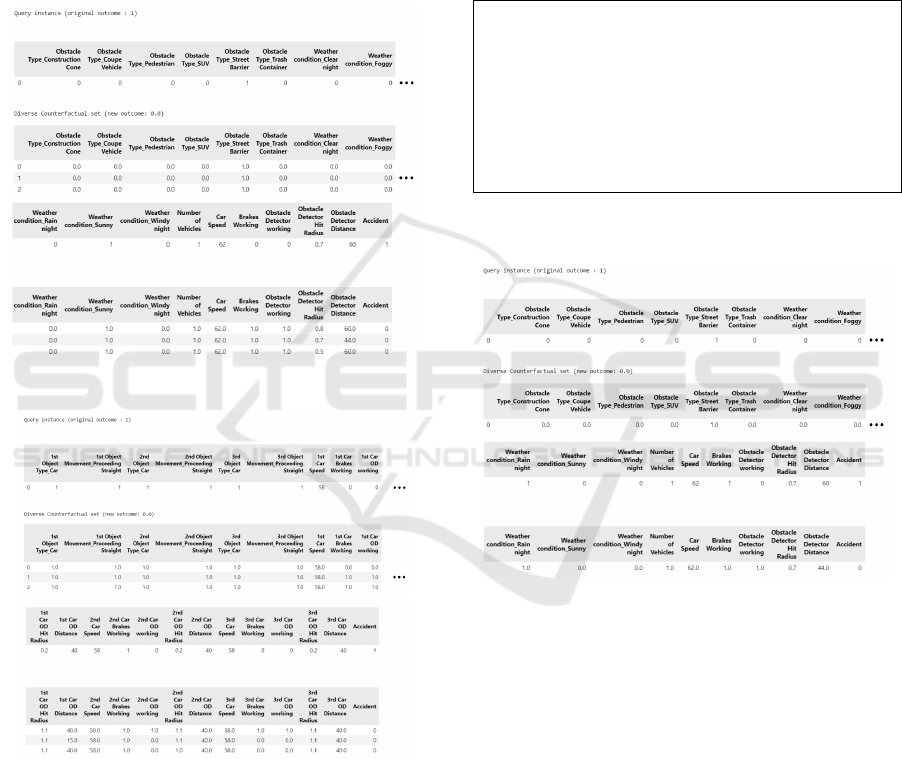
Moreover, for the chain reactions case, to under-
stand why the three autonomous vehicles collided, an
explanation was required. As shown in Figure 5, var-
ious counterfactuals were created having an outcome
of zero, indicating that the original instance had an
outcome of one. This also indicates that an accident
has occurred and could have involved two or more
cars, and the generated counterfactuals have an out-
come of zero, showing how the three cars could have
avoided this collision.
Figure 4: Stationary Objects Counterfactuals Example 1.
Figure 5: Chain Reactions Counterfactuals Example 1.
3.3 Insights
The last component of this system pipeline is to have
insights or a deep understanding of the generated
counterfactual examples. Due to the examples that
are being visualized through dataframes as shown in
the previous figures, a user could still not be able to
deduce what is the cause that made a situation have
this effect or be able to know what could have been
done to have the opposite outcome. As a result, these
dataframes are converted into an English paragraph.
For example, in the stationary objects case, it is
not clear from the dataframe in Figure 7 what really
caused the accident to occur. In particular, was it the
problem with the obstacle detector hit radius or de-
tection distance or some other factor. To describe how
this accident occurred, Figure 6 provides the user with
a deep understanding of how the situation took place
and how it could have been avoided.
The car crashed into the Street Barrier although the brakes were working,
however, the obstacle detector was not functioning, so it couldn’t detect the
incoming obstacle and take a decision to avoid it. On the other hand, the
car wouldn’t have crashed into the Street Barrier if the brakes were working
and the obstacle detector was functioning with a hit radius of 0.7 degrees,
which will make the car’s field of view be able to detect the Street Barrier
and a detection distance of 44.0 meters, which will give the car enough
time to identify the obstacle from a far distance and make a decision of
stopping the vehicle to avoid the accident.
Figure 6: Stationary Objects Insights.
Figure 7: Stationary Objects Counterfactuals Example 2.
Furthermore, for the chain reactions case, it is not
obvious from the dataframe in Figure 8 what initiated
the accident. For example, was the first vehicle re-
sponsible for involving the other two cars in the acci-
dent, or was it the responsibility of the other two cars.
To explain exactly how an accident has occurred, Fig-
ure 3 helps in visualizing the scenario, and the phrases
illustrated in Figure 9 give the user a thorough grasp
of how the scenario happened and how it may have
been avoided.
4 EVALUATION AND RESULTS
In this section, we discuss the evaluation metrics that
were utilized to assess the performance of the imple-
A Framework for Explaining Accident Scenarios for Self-Driving Cars
369

Figure 8: Chain Reactions Counterfactuals Example 2.
The first car made an accident because the brakes were not working, and
the obstacle detector was also not functioning, so it continued to proceed
straight. As a result, it crashed into the second vehicle, which had its brakes
working but its obstacle detector was not functioning, which made it unable
to detect other obstacles and take a decision to avoid the accident instead it
continued to proceed straight. Therefore, the second vehicle also crashed
into the third vehicle, which had its brakes not working and its obstacle
detector not functioning, which made it unable to detect other obstacles
and take the decision to avoid the accident instead it continued to proceed
straight. On the other hand, the first car wouldn’t have made an accident if
the brakes were working and the obstacle detector was functioning with a
hit radius of 1.1 degrees, which will make the car’s field of view be able to
detect other obstacles and a detection distance of 40.0 meters, which will
give the car enough time to identify the obstacle from a far distance and
make a decision of stopping the vehicle to avoid the accident.
Figure 9: Chain Reactions Insights.
mented system. Next, the outcomes for each metric
are showcased.
4.1 Evaluation
To measure the implemented system’s performance,
once it generated a counterfactual example, this coun-
terfactual was evaluated against several metrics. The
evaluation metrics that were used are proximity, spar-
sity, and plausibility.
4.1.1 Proximity
Proximity or distance metric measures how much
change is needed to alter the prediction of a model
or how close is a specific point to another one. There
are two reasons for using this metric. First, to mea-
sure the distance or similarity between the original
instance and the generated counterfactual. Second,
to determine if a generated counterfactual example is
close to a reference instance. The specified reference
instance or ground truth instance is presumed to be of
the desired class. Thus, guaranteeing that the coun-
terfactual example is within the target class’s decision
boundary (Singh, 2021).
The implementation for acquiring a reference in-
stance in this research is based on Singh’s procedure
for obtaining a reference instance (Singh, 2021). It
is attained by making the Random Forest classifier
predict each record in the test dataset and checking
if this record’s predicted outcome led to the desired
class which when satisfied it is appended to a desired
class instances list. After that, the reference instance
is acquired by either taking a random instance from
the desired class instances list or by constructing a k-
d tree for the points in the list and taking the nearest
neighbor point to the generated counterfactual. Also,
in this research there was an adjustment to Singh’s
implementation which is that two reference instances
will be obtained rather than one as shown in Figure
10, to be able to compare whether it is better to ac-
quire the reference instance by choosing a random
one from the desired class instances list or by getting
the nearest neighbor from the constructed k-d Tree.
Obtain Reference Instance
Random
Reference Instance
Nearest Neighbor
Reference Instance
Figure 10: Obtaining Reference Instance.
To calculate the proximity between the original,
reference, and counterfactual instances, the Manhat-
tan distance shown in Equation 1) was used.
d
manhattan
=
n
∑
i=1
|(x
i
− y
i
)| (1)
4.1.2 Sparsity
Another closely related property to proximity, which
measures the average change between a counterfac-
tual example and the original instance, is the feasi-
bility property of sparsity. Naturally, a counterfactual
example will appear more feasible to a user if it alters
a smaller number of features (Mothilal et al., 2020).
As a result, sparsity shows the number of features that
differ between the original instance and the generated
counterfactual.
4.1.3 Plausibility
The most obvious requirement for a counterfactual
explanation is that it must present a user with plau-
sible options for changing a prediction (Laugel et al.,
ICAART 2023 - 15th International Conference on Agents and Artificial Intelligence
370

2019). The plausibility metric quantifies the percent-
age of the generated counterfactual that is probable or
reasonable. It is calculated by taking each value in the
generated counterfactual and passing them through a
series of if conditions to check if they relate to one
another and together are reasonable to produce a spe-
cific outcome.
4.2 Results
Throughout this section the following examples were
used as seen in Figure 11, which is for the station-
ary objects case. It shows that the car did an accident
and how this accident could have been avoided. Also,
for the chain reactions case as provided in Figure 12,
which shows how the car collided with other vehicles
and how it could have avoided this collision. These
examples were randomly chosen to eliminate any bi-
ases.
Figure 11: Stationary Objects Counterfactuals Example 3.
Figure 12: Chain Reactions Counterfactuals Example 3.
4.2.1 Proximity
Stationary Objects
Figure 13: Stationary Objects: Random Reference Instance.
Figure 14: Stationary Objects: Random Reference Instance
Manhattan Distance.
Figure 15: Stationary Objects: Nearest Neighbor Reference
Instance.
Figure 16: Stationary Objects: Nearest Neighbor Reference
Instance Manhattan Distance.
As can be seen by the distance metrics in Figures 14,
16 that are measured for both the random reference
instance in Figure 13 and the nearest neighbor ref-
erence instance in Figure 15, the distances between
the original instance and the generated counterfactual
are the highest. This shows that the counterfactual
example is not in close proximity to the original in-
stance. However, the distances between the counter-
factual example and the reference instance are rela-
tively low. This indicates that the generated counter-
factual falls in the decision boundary of the desired
class. In addition, the distances between the origi-
nal and the reference instances is considered high but
less than the distances between the original and coun-
terfactual instances. Thus, it may be stated that the
condition for finding the closest potential counterfac-
tual has failed.
A Framework for Explaining Accident Scenarios for Self-Driving Cars
371

Figure 17: Chain Reactions: Random Reference Instance.
Figure 18: Chain Reactions: Random Reference Instance
Manhattan Distance.
Chain Reactions
Figure 19: Chain Reactions: Nearest Neighbor Reference
Instance.
Figure 20: Chain Reactions: Nearest Neighbor Reference
Instance Manhattan Distance.
It can be observed from the distance metrics in Fig-
ures 18, 20 that are measured for both the random ref-
erence instance in Figure 17 and the nearest neighbor
reference instance in Figure 19, that the distances be-
tween the original instance and the reference instance
are the greatest which are also higher than the dis-
tances between the original instance and the generated
counterfactual. This shows that the produced counter-
factual is in close proximity to the original instance.
As a result, it can be said that the condition for finding
the nearest possible counterfactual has been satisfied.
Moreover, similar to what has been stated before that
the distances between the counterfactual example and
the reference instance are low. Therefore, indicating
that the generated counterfactual falls in the decision
boundary of the desired class.
4.2.2 Sparsity
Stationary Objects
It is evident that in Figure 11 there are two differences
between the original instance and the generated coun-
terfactual. These differences are changing the brakes
working feature from 0 to 1 and decreasing the obsta-
cle detector distance from 60 to 33. This means that a
small number of features were changed. However, as
mentioned before in the proximity results for the sta-
tionary objects case, the distances between the origi-
nal and the counterfactual instances were the highest
among the other distances. This implied that the gen-
erated counterfactual wasn’t the nearest possible one.
As a result, it could have been nearer if the generated
counterfactual had only one change which, for exam-
ple, changing the brakes working feature only.
Chain Reactions
There are five distinct differences between the origi-
nal instance and the generated counterfactual in Fig-
ure 12 which are flipping the values of the first car’s
brakes working and obstacle detector working fea-
tures, and increasing the three cars’ obstacle detector
hit radius to 1.1. These changes are relatively low.
Also, according to the proximity results for the chain
reactions, the generated counterfactual is the nearest
possible one. Thus, achieving the feasibility property
of sparsity.
4.2.3 Plausibility
Stationary Objects
The system determined that the created counterfac-
tual is 100% reasonable in this circumstance. This
can be further supported by referring to the generated
insights in Figure 21 for the example in Figure 11. It
states that if the brakes and the obstacle detector were
both operating, moreover, the obstacle detector’s hit
radius and detection distance were 0.7 degrees and 33
meters respectively, the car would have avoided col-
liding with the trash container.
Chain Reactions
The system outputted that the generated counterfac-
tual for this case is reasonable by 99.96%. This out-
come can also be aided by looking at the produced
insights in Figure 22 for the example in Figure 12. It
claims that if the first car’s brakes and obstacle de-
tector were working and also, its obstacle detector’s
hit radius was 1.1 degrees and detection distance was
ICAART 2023 - 15th International Conference on Agents and Artificial Intelligence
372

40.0 meters, it would have made the first car not initi-
ate the accident.
The car crashed into the Trash Container because the brakes were not
working, however, the obstacle detector was functioning with a hit radius
of 0.7 degrees, which made the car’s field of view wide enough to detect
the Trash Container and a detection distance of 60.0 meters, which gave
the car enough time to identify the obstacle from a far distance and make
a decision, but due to the brakes not working, the vehicle couldn’t stop to
avoid the accident. On the other hand, the car wouldn’t have crashed into
the Trash Container if the brakes were working and the obstacle detector
was functioning with a hit radius of 0.7 degrees, which will make the car’s
field of view be able to detect the Trash Container and a detection distance
of 33.0 meters, which will give the car enough time to identify the obstacle
from a far distance and make a decision of stopping the vehicle to avoid
the accident.
Figure 21: Insights for Stationary Objects Counterfactuals
Example 3.
The first car made an accident because the brakes were not working, and
the obstacle detector was also not functioning, so it continued to proceed
straight. As a result, it crashed into the second vehicle, which had its brakes
working but its obstacle detector was not functioning, which made it unable
to detect other obstacles and take a decision to avoid the accident instead it
continued to proceed straight. Therefore, the second vehicle also crashed
into the third vehicle, which had its brakes not working and its obstacle
detector not functioning, which made it unable to detect other obstacles
and take the decision to avoid the accident instead it continued to proceed
straight. On the other hand, the first car wouldn’t have made an accident if
the brakes were working and the obstacle detector was functioning with a
hit radius of 1.1 degrees, which will make the car’s field of view be able to
detect other obstacles and a detection distance of 40.0 meters, which will
give the car enough time to identify the obstacle from a far distance and
make a decision of stopping the vehicle to avoid the accident.
Figure 22: Insights for Chain Reactions Counterfactuals
Example 3.
5 CONCLUSION AND FUTURE
WORK
This research aimed to give users an explanation for
why an autonomous vehicle made a specific deci-
sion, particularly in car accident scenarios by provid-
ing counterfactual explanations and giving insights to
better explain the produced counterfactuals. Results
show that having distances between the original in-
stance and the generated counterfactual lower than
the distances between the original instance and a ref-
erence instance means that the produced counterfac-
tual is the nearest possible one to attain. Also, ac-
quiring the nearest neighbor reference instance is the
best choice for identifying if the generated counter-
factual falls in the decision boundary of the desired
class. Moreover, small changes between the origi-
nal instance and the counterfactual example achieve
the feasibility property of sparsity. Finally, obtain-
ing a high percentage for the generated counterfactual
means that it is plausible and further supports that it
led to the target class. Overall, the system developed
explains why a self-driving car made specific deci-
sions in a variety of car accident scenarios.
Future research must consider testing and evaluat-
ing other chain reaction cases that are more complex,
in order to identify more about the reasons behind an
autonomous vehicle’s made decisions. For example,
involving people crossing streets in the scene and see-
ing how the car behaves in such a situation.
REFERENCES
Ali, J., Khan, R., Ahmad, N., and Maqsood, I. (2012). Ran-
dom forests and decision trees. International Journal
of Computer Science Issues (IJCSI), 9(5):272.
Dosovitskiy, A., Ros, G., Codevilla, F., Lopez, A., and
Koltun, V. (2017). Carla: An open urban driving sim-
ulator. In Conference on robot learning, pages 1–16.
PMLR.
Islam, S. R., Eberle, W., Ghafoor, S. K., and Ahmed, M.
(2021). Explainable artificial intelligence approaches:
A survey. arXiv preprint arXiv:2101.09429.
Kullarni, V. and Sinha, P. (2013). Random forest classifier:
a survey and future research directions. Int. J. Adv.
Comput, 36(1):1144–1156.
Laugel, T., Lesot, M.-J., Marsala, C., and Detyniecki, M.
(2019). Issues with post-hoc counterfactual explana-
tions: a discussion. arXiv preprint arXiv:1906.04774.
Mart
´
ınez-D
´
ıaz, M. and Soriguera, F. (2018). Autonomous
vehicles: theoretical and practical challenges. Trans-
portation Research Procedia, 33:275–282.
Mothilal, R. K., Sharma, A., and Tan, C. (2020). Explain-
ing machine learning classifiers through diverse coun-
terfactual explanations. In Proceedings of the 2020
Conference on Fairness, Accountability, and Trans-
parency, pages 607–617.
Omeiza, D., Webb, H., Jirotka, M., and Kunze, L. (2021).
Explanations in autonomous driving: A survey. IEEE
Transactions on Intelligent Transportation Systems.
Pedregosa, F., Varoquaux, G., Gramfort, A., Michel, V.,
Thirion, B., Grisel, O., Blondel, M., Prettenhofer, P.,
Weiss, R., Dubourg, V., et al. (2011). Scikit-learn:
Machine learning in python. the Journal of machine
Learning research, 12:2825–2830.
Singh, V. (2021). Explainable ai metrics and properties
for evaluation and analysis of counterfactual explana-
tions: Explainable ai metrics and properties for evalu-
ation and analysis of counterfactual explanations.
Vilone, G. and Longo, L. (2021). Notions of explainability
and evaluation approaches for explainable artificial in-
telligence. Information Fusion, 76:89–106.
A Framework for Explaining Accident Scenarios for Self-Driving Cars
373
