
State of Health Estimation of Lithium-ion Batteries Using Convolutional
Neural Network with Impedance Nyquist Plots
Yichun Li, Mina Maleki, Shadi Banitaan and Mingzuoyang Chen
Dept. of Electrical & Computer Engineering & Computer Science, University of Detroit Mercy, Detroit, MI, U.S.A.
Keywords:
Lithium-Ion Batteries, Electric Vehicles, State Of Health, Convolutional Neural Network, Nyquist Plot,
Electrochemical Impedance Spectroscopy, Deep Neural Network, Machine Learning.
Abstract:
In order to maintain the Li-ion batteries in a safe operating state and to optimize their performance, a precise
estimation of the state of health (SOH), which indicates the degradation level of the Li-ion batteries, has
to be taken into consideration urgently. In this paper, we present a regression machine learning framework
that combines a convolutional neural network (CNN) with the Nyquist plot of Electrochemical Impedance
Spectroscopy (EIS) as features to estimate the SOH of Li-ion batteries with a considerable improvement in
the accuracy of SOH estimation. The results indicate that the Nyquist plot based on EIS features provides
more detailed information regarding battery aging than simple impedance values due to its ability to reflect
impedance change over time. Furthermore, convolutional layers in the CNN model were more effective in
extracting different levels of features and characterizing the degradation patterns of Li-ion batteries from EIS
measurement data than using simple impedance values with a DNN model, as well as other traditional machine
learning methods, such as Gaussian process regression (GPR) and support vector machine (SVM).
1 INTRODUCTION
The use of lithium-ion (Li-ion) batteries has gained
considerable attention as one of the most promising
means of reducing net carbon dioxide emissions for a
wide range of industrial applications. During the use
of Li-ion batteries, degradation of capacity occurs as
an irreversible process, resulting in diminished perfor-
mance and increased safety operation concerns. State
of health (SOH) is determined as the ratio of the cur-
rent maximum capacity of Li-ion batteries to the max-
imum capacity when the battery is fresh, which is the
degradation indicator of Li-ion batteries that reflects
the current health condition of the batteries compared
to its initial health condition. SOH estimation is vital
not only for maintaining the optimal performance of
electric vehicles (EVs) but also for performing health
assessments on Li-ion batteries, which provides vi-
tal information regarding battery maintenance and re-
placement (Rauf et al., 2022). Unlike voltage, current,
and temperature, the SOH of Li-ion batteries cannot
be measured directly with gauges in a battery man-
agement system (BMS). The coulomb counting (Ng
et al., 2009) as a direct capacity measurement has
been widely used in a laboratory environment to mea-
sure the capacity of Li-ion batteries, in which a com-
plete discharge and charge cycle is necessary at each
measurement. Due to the fact that frequent discharg-
ing and charging is a time-consuming process that can
accelerate the aging of Li-ion batteries, it is imprac-
tical to implement the coulomb counting in real-life
applications where a real-time estimation is needed.
Thus, designing robust and reliable battery manage-
ment systems that estimate SOH accurately remains a
challenge.
Recent advances in artificial intelligence (AI) and
the availability of large Li-ion battery datasets have
resulted in the development of a wide range of data-
driven methods that are capable of estimating the
SOH of Li-ion batteries accurately, in which a contin-
uous capacity estimation task has been converted into
a regression machine learning problem. The quality
of the Li-ion battery dataset has a great deal of signif-
icance since data-driven models are based upon mea-
surable battery data in order to provide a robust esti-
mation of the battery capacity without delving deeply
into electrochemical phenomena inside the battery.
As a result, it remains difficult to select a suitable su-
pervised machine learning model with effective fea-
ture sets for accurate battery SOH estimation. In
recent years, extensive research has been conducted
on extracting degradation patterns from Li-ion bat-
teries and mapping their relationship with capacity
using voltage, current, and temperature from charg-
842
Li, Y., Maleki, M., Banitaan, S. and Chen, M.
State of Health Estimation of Lithium-ion Batteries Using Convolutional Neural Network with Impedance Nyquist Plots.
DOI: 10.5220/0011672300003411
In Proceedings of the 12th Inter national Conference on Pattern Recognition Applications and Methods (ICPRAM 2023), pages 842-849
ISBN: 978-989-758-626-2; ISSN: 2184-4313
Copyright
c
2023 by SCITEPRESS – Science and Technology Publications, Lda. Under CC license (CC BY-NC-ND 4.0)

ing curves. In practice, however, the charging pat-
terns of users vary, which results in uncertainty in the
charging data collected. Thus, in order to overcome
the limitations of adopting multi-channel battery fea-
tures, including battery voltage, current, and temper-
ature from charging curves, this paper proposes a ma-
chine learning framework, in which Electrochemical
Impedance Spectroscopy (EIS) data from impedance
curves are combined with a convolutional neural net-
work (CNN) to estimate the SOH of Li-ion batteries.
The novelty and contributions of this paper are
summarized as follows.
• EIS features have been demonstrated in previ-
ous work (Li et al., 2021) that they can be effi-
ciently utilized in Li-ion battery State of Charge
(SOC) estimation with better accuracy than a
multi-channel feature set using a deep neural net-
work. Now that SOC estimation has been ex-
tended to SOH estimation, and a promising level
of accuracy has been observed for SOH estima-
tion using the EIS feature set.
• To the best of our knowledge, this is the first time
that the Nyquist plot of EIS features has been in-
tegrated with the CNN model as features in order
to estimate the SOH of Li-ion batteries. Accord-
ing to the implementation results, Nyquist plots
of impedance provide more comprehensive infor-
mation on battery aging than simple impedance
values in terms of describing nonlinear and com-
plex degradation processes of lithium-ion batter-
ies, resulting in substantial improvements in SOH
prediction accuracy of Li-ion batteries.
• This study demonstrated that convolutional layers
in the CNN model were more effective in extract-
ing different levels of features from EIS Nyquist
plots and analyzing degradation patterns of Li-
ion batteries than simple impedance values with
a deep neural network (DNN), as well as other
conventional machine learning techniques, such
as Gaussian Process Regression (GPR) and sup-
port vector machine (SVM).
The remainder of the paper is organized as fol-
lows: Section II summarizes the recent state-of-art re-
search work regarding the SOH estimation of Li-ion
batteries. Section III describes the utilized EIS dataset
and the proposed machine learning framework. Sec-
tion IV highlights the results and comparisons ob-
tained from the employed models with the EIS feature
set. Finally, the conclusion is drawn in Section V.
2 RELATED WORK
This section summarizes related published work re-
garding the SOH estimation of Li-ion batteries. In
spite of the challenge of designing a BMS that is
capable of estimating SOH accurately, it is vital to
ensure the reliability and safety of Li-ion batteries
for various applications. Therefore, the development
of novel methods for the states estimation of Li-ion
batteries has received significant attention in recent
years. Generally, the majority of research studies con-
ducted so far can be divided into two broad categories,
model-based models and data-driven models.
The model-based methods are highly dependent
on the domain knowledge of multi-physics phenom-
ena of Li-ion batteries, including electrochemistry
and aging characteristics. The Kalman filter has been
proposed in (Saxena et al., 2019) for the estimation of
SOC and SOH of Li-ion batteries. In (Daigle et al.,
2016), An Equivalent Circuit Model (ECM) was de-
veloped by Daigle and Kulkarni to predict battery ca-
pacity when batteries were discharged. An extended
Kalman filter (EKF) and an enhanced self-correcting
equivalent circuit model were used by Plett (Plett et
al., 2004) to achieve an online capacity estimation
of the Li-ion battery cell. According to (Lin et al.,
2017), two sliding mode observers can be used to de-
termine the SOC and SOH of Li-ion batteries coupled
with a reduced order electrochemical model (EM).
Because EMs contain a large number of partial differ-
ential equations, their solution requires a significant
amount of computational power.
The use of model-based methods involves the de-
velopment of complex mathematical models that are
designed to account for the long-term dependencies
of battery degradation and to describe the degradation
process. However, the lack of domain knowledge re-
garding model construction precludes the use of these
methods in real-world applications since it is infeasi-
ble to identify all the hidden complex and highly non-
linear degradation characteristics. In contrast, data-
driven models utilize machine learning techniques to
provide an accurate estimation of the SOH of Li-ion
batteries, thereby overcoming the lack of generality in
model-based approaches for different types of batter-
ies. As a consequence of the advantages of using ma-
chine learning techniques, data-driven methods rely
solely on experimental data collected from the battery
without taking into account battery aging mechanisms
and internal electrochemical reactions.
In (Choi et al., 2019), as a result of exploiting and
applying multi-channel charging profiles of the bat-
tery voltage, current, and surface temperature to deep
learning models, numerical results indicate that the
State of Health Estimation of Lithium-ion Batteries Using Convolutional Neural Network with Impedance Nyquist Plots
843

proposed multi-channel method delivers up to 58%
mean absolute percentage error (MAPE) improve-
ment by deploying various neural networks in com-
parison with the use of only voltage charging profiles.
The feed-forward neural network (FFNN) has been
deployed in (Chaoui et al., 2017) to estimate the SOH
of Li-ion batteries by using input features, including
battery terminal voltage, current, and ambient temper-
ature from charging curves, which enables the neural
network to extract the dynamic characteristics from
Li-ion batteries and map them to the capacity. To es-
timate the SOH of Li-ion batteries, a gate recurrent
unit-convolutional neural network (GRU-CNN) was
proposed in (Fan et al., 2020), which can extract the
shared information and time dependencies from the
charging curve and limit the maximum prediction er-
ror to 4.3%. The authors in (Yang et al., 2022) have
utilized the battery data from charging/discharging
curves and fed them into various CNN-based SOH
estimation models, indicating the effectiveness of the
proposed models in predicting the SOH of Li-ion bat-
teries.
The data-driven methods mentioned above all rely
heavily on the charging curve data, but the charging
patterns of users are difficult to predict, resulting in
randomness in the battery charging data. As an al-
ternative to using battery voltage, current, and tem-
perature from charging curves, EIS has gained in-
creased interest from researchers in recent years for
its non-destructive nature and capability to analyze
the impedance spectrum of batteries.
It has been demonstrated in (Li et al., 2021) that
the EIS feature set was more effective and efficient in
predicting Li-ion battery capacity than battery volt-
age, current, and temperature from charging curves.
Incorporating cycle numbers with EIS features in (Li
et al., 2022) improved the SOH estimation accuracy
by up to 50% compared to those relying solely on
EIS features. The authors in (Kim et al., 2022) pro-
pose an unsupervised machine learning model called
EIS-based InfoGAN (EISGAN), which extracts vari-
ables that can precisely formulate battery degradation
from the EIS feature set with low-frequency fluctu-
ations. An acceptable level of prediction accuracy
can be achieved with a mean absolute error (MAE)
of 0.71 and a root mean square error (RMSE) of 0.91,
respectively, for testing on a single cell. Moreover,
a CNN model has been deployed with EIS measure-
ment data to estimate the SOH of Li-ion batteries in
(Pradyumna et al., 2022), where the maximum esti-
mation error was found to be 0.57 (% capacity) and
the RMSE was found to be 0.233 (% capacity).
Despite the high dimensionality of EIS features,
it has been challenging to select the quantitative fea-
tures that correlate with battery degradation when us-
ing EIS measurements to predict the SOH of lithium-
ion batteries. Hence, a CNN model has been devel-
oped in this paper, in which the convolutional layer is
employed to extract the most useful features from the
input data automatically without omitting any critical
characteristics of the battery data.
3 MATERIAL AND
METHODOLOGY
This section discusses Zhang’s EIS dataset (Zhang et
al., 2020), one of the largest publicly available EIS
datasets to date, as well as how EIS features were ex-
tracted and restructured in different ways to charac-
terize battery degradation patterns. Also, a proposed
machine learning framework will be described where
the CNN and DNN models were deployed to extract
the aging characteristics from EIS features to estimate
the SOH of Li-ion batteries. The proposed machine
learning framework in this work is presented in Fig-
ure 1.
3.1 Data Acquisition
Various non-linear mechanisms and complex decline
trajectories are involved in the degradation of Li-ion
batteries. In order to train a machine learning model
that will accurately predict the SOH of Li-ion batter-
ies, reliable battery aging data are essential.
In light of the difficulty of conducting battery ag-
ing experiments, researchers have evaluated their pro-
posed prediction algorithms based on publicly avail-
able battery datasets. A comprehensive dataset of EIS
measurements, as specified in (Zhang et al., 2021),
was selected for this experiment, which was con-
ducted by continuously charging and discharging 12
Eunicell LR2032 lithium-ion coin cells made of Li-
CoO2/graphite.
Battery internal impedance plays an important
role in determining its operational voltage, rate ca-
pability, and efficiency, and can even have a signifi-
cant impact on its practical capacity. In general, the
measurement approach involves applying a sinusoidal
current or voltage with a certain amplitude and fre-
quency, and measuring the amplitude and phase shift
of the output voltage or current (Li et al., 2020). Re-
peating this procedure for various frequencies, typi-
cally between kHz and MHZ, yields a characteristic
impedance spectrum. More than 20,000 EIS spectra
of 12 commercial Li-ion batteries have been collected
in the EIS dataset (Zhang et al., 2021). The samples
were cycled at different temperatures, specifically,
ICPRAM 2023 - 12th International Conference on Pattern Recognition Applications and Methods
844
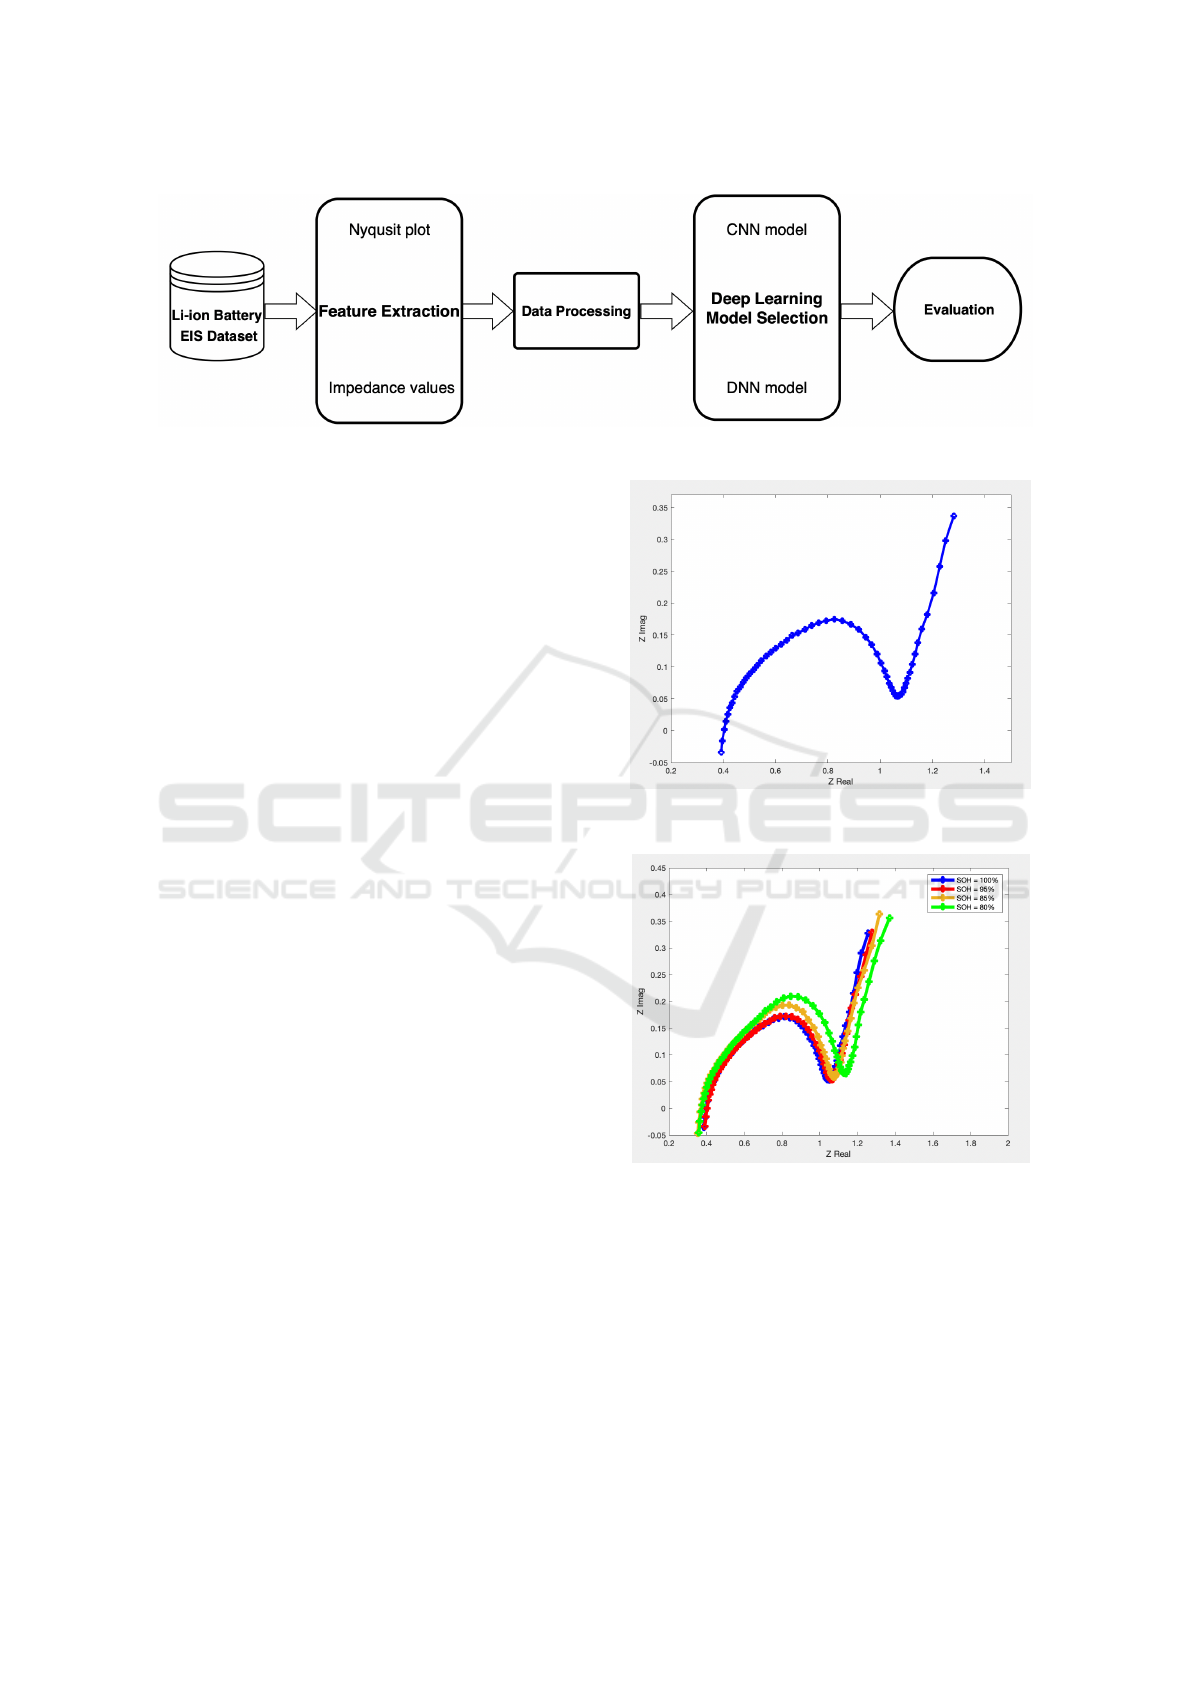
Figure 1: The proposed supervised machine learning framework.
eight cells were cycled at 25°C, two cells at 35°C,
and the remaining cells were cycled at 45°C. EIS
measurement data are collected spanning a frequency
range from 0.02 HZ to 20 KHZ, in which 60 sample
points were conducted at each charging/discharging
cycle.
3.2 Feature Extraction
Due to the complexity and non-linearity of the Li-ion
battery aging process, selecting the most significant
patterns from the EIS feature set plays an important
role in describing the degradation of Li-ion batter-
ies. In this work, the Nyquist plot of EIS features has
been extracted based on different cycle numbers of
charging/discharging of Li-ion batteries, while sim-
ple impedance values also have been restructured to
characterize the battery aging patterns.
3.2.1 Nyquist Plot
By varying the applied frequency in an EIS mea-
surement, considerable information can be gathered.
Nyquist plots have been commonly used to visualize
the complex values of impedance values. A Nyquist
plot at one sample point where the real part of the
impedance is plotted against the imaginary part was
presented in Figure 2, where each blue dot represents
a complex value of the impedance, and 60 different
blue dots were collected at each frequency point.
In order to visualize how the Nyquist plot can
reflect the degradation of Li-ion batteries, several
Nyquist plots with respect to various SOH of Li-ion
batteries have been shown in Figure 3, where the plot
curves of impedance shift as the result of battery ag-
ing.
3.2.2 Impedance Values
The EIS measurement data have been restructured in
different ways to describe the aging patterns of Li-ion
batteries. For various deep learning models, different
data representations may be needed to take advantage
Figure 2: Nyquist plot of impedance at one sample point.
Figure 3: Nyquist plots of impedance at different SOH.
of each deep learning model. Instead of represent-
ing the EIS features of Li-ion batteries, another com-
monly adopted way to describe the data is to use a
single column array to formulate the impedance val-
ues, where EIS measurement data are organized as a
120 x 1 array.
State of Health Estimation of Lithium-ion Batteries Using Convolutional Neural Network with Impedance Nyquist Plots
845

3.3 Data Processing
A data processing step is essential before feeding
the input data into the machine learning model. In
this step, EIS measurement data are normalized and
restructured before being fed into a neural network
model.
3.3.1 Data Normalization
Normalization of data refers to the process of reorga-
nizing information in a database to reduce redundancy
and enhance its efficiency by making all features on
the same scale. The Min-Max function was used to
normalize EIS measurement data in this study:
x
n
scaled
=
x
n
− x
min
x
max
− x
min
(1)
In this case, x
n
represents each element in fea-
ture column n, and x
min
and x
max
are the minimum
and maximum values for each feature column, respec-
tively. Impedance value in each feature column will
be scaled between 0 and 1 at the end of the normaliza-
tion, which enables each feature in EIS measurement
data of equal importance.
3.4 Model Selection
A CNN framework has been proposed to estimate the
SOH of Li-ion batteries in this study, while a DNN
model has also been deployed with the same EIS mea-
surement data in order to compare the performance of
the models.
3.4.1 Convolutional Neural Network
There has been considerable interest in using convo-
lutional neural networks as a powerful tool for deal-
ing with computer vision problems, where CNNs are
used to classify and differentiate between various ob-
jects contained in an image. In this study, a CNN
framework has been proposed and presented in Fig-
ure 4. There are 1657 Nyquist plots each with a size
of (1657x420) that have been fed into the CNN model
where two convolutional layers each with a max pool-
ing layer after are followed by there fully connected
dense layers to extract the aging patterns from the im-
ages and map the relationships to the capacity value
of Li-ion batteries.
Typically a CNN model is composed of multi-
ple layers with different functionalities, including in-
put layer, convolutional layers, pooling layers, flat-
ten layer, hidden layers, and output layer. The pur-
pose of the Convolution Operation is to extract high-
level features from the input image, such as edges. In
CNN models, multiple convolutional layers are usu-
ally required since the architecture is designed to take
into account high-level features as additional convo-
lutional layers are added. Similar to the convolutional
Layer, the Pooling layer is designed to reduce the spa-
tial size of the convolved feature, which decreases
the computation complexity and results in a more ef-
ficient model. Now that the input image has been
converted into a form suitable for multi-level percep-
trons, the image should be flattened into a column
vector in order to feed it into a feed-forward neural
network that employs backpropagation for each itera-
tion of training. With the help of the optimization al-
gorithm, the model is able to distinguish dominating
and certain low-level features in images and classify
them accordingly.
3.4.2 Deep Neural Networks
The DNN is one of the most promising deep learning
techniques, particularly when a large amount of data
is involved, which can be used to learn the dynamics
and nonlinear degradation patterns of Li-ion batteries
for a regression SOH estimation task. Generally, a
DNN model refers to a simple feed-forward neural
network, which consists of multiple layers, includ-
ing the input layer, hidden layers, and output layer.
The selection of the number of layers and the number
of neurons in each specific layer make a significant
difference in the prediction performance of models,
where the tuning of hyperparameters in a DNN model
should be taken into consideration carefully. Previous
works (Li et al., 2022), (Chemali et al., 2018) have
provided an insight into what combination of the hy-
perparameters should be selected in the DNN model
with the comparable input data size to estimate the
SOH of Li-ion batteries due to the complexity and
time-consuming nature of hyperparameters optimiza-
tion. The input data in the input layer is composed
of 120 neurons, are fed sequentially to two hidden
layers with 64 and 32 neurons in each one, respec-
tively. ReLU function was assigned as the activation
function in both hidden layers and the output layer to
formulate the nonlinear aging process of Li-ion bat-
teries. Adam algorithm was utilized to optimize the
loss function computed by mean squared error (MSE)
in each iteration to adjust the weights and bias of the
DNN model. Also, a dropout layer with a dropout
rate of 0.1 was added after the hidden layers to avoid
the potential overfitting during the training phase. The
hyperparameters defined in the DNN model have been
presented in Table I.
ICPRAM 2023 - 12th International Conference on Pattern Recognition Applications and Methods
846

Figure 4: The proposed CNN framework.
Table 1: DNN Hyperparameters.
Hyperparameter Selection Options
Input size 120 x 1
Number of hidden layers 2
Number of neurons in the
first hidden layer
64
Number of neurons in the
second hidden layer
32
Output size 1
Optimization algorithm Adam
Dropout rate 0.1
Activation function for hid-
den & output layers
ReLU
Loss function Mean squared error
Batch size 32
3.5 Evaluation
Mean square error and mean absolute error are two
widely used evaluation metrics for regression ma-
chine learning problems. And they were utilized
to evaluate the performance of employed CNN and
DNN models in this study.
3.5.1 Mean Squared Error
Mean square error is defined as the mean of the square
of the difference between real and predicted values in
statistics. In this case, it is computed by taking the
mean of the square of the difference between the true
capacity y
i
true
and the predicted one y
i
predicted
as shown
in:
MSE =
n
∑
i
(y
i
predicted
− y
i
true
)
2
n
(2)
The smaller value of MSE indicates better SOH
prediction accuracy of Li-ion batteries.
3.5.2 Mean Absolute Error
Mean Absolute Error represents an average value of
the sum of the absolute difference between actual and
predicted results. In this case, it is computed by taking
the mean of the sum of the absolute value of the differ-
ence between predicted capacity y
i
predicted
and actual
capacity y
i
true
, which is shown in:
MAE =
n
∑
i
|y
i
predicted
− y
i
true
|
n
(3)
The smaller MAE value indicates a better predic-
tion result.
4 RESULTS AND DISCUSSION
In this work, two different data representations are
derived from normalized EIS measurement data, the
Nyquist plot of impedance in binary images and 120 x
1 single-column vectors, respectively, in order to for-
mulate the degradation mechanism of Li-ion batteries
through CNN and DNN models. Input data have been
divided into 90% training data and 10% testing data
to assess the generalization ability of trained models.
In addition, 10% of the training set was split into a
validation set to prevent the models from overfitting
during the training phase. For the statistical analysis
and evaluation of the SOH prediction of Li-ion bat-
teries, CNN and DNN models were implemented in
Python based on TensorFlow.
The deployed CNN model extracted and learned
the changing patterns of the curves of the impedance
plot to predict the SOH of Li-ion batteries, while
the DNN model can only learn the features from the
single-column impedance array due to the limitation
of its simple structure. The prediction results indi-
cate both the DNN and CNN models were capable of
State of Health Estimation of Lithium-ion Batteries Using Convolutional Neural Network with Impedance Nyquist Plots
847

characterizing the dynamic and nonlinear aging pat-
terns of Li-ion batteries from EIS measurement data.
Moreover, because of that, convolutional layers prior
to dense layers that are fully connected can effec-
tively extract aging patterns from Nyquist plots, and
Nyquist plots contain much more detailed informa-
tion regarding the battery degradation process than
simple impedance values, which resulted in a signif-
icant accuracy improvement of the SOH prediction
in CNN model as compared to the DNN model. As
an additional step, simple impedance values were fed
into traditional machine learning methods, including
SVM and GPR models. It is evident from the results
that the CNN model with Nyquist plots as features
achieved an improved SOH prediction accuracy with
MSE and MAE errors of 0.0458 and 0.1292, respec-
tively, outperforming other methods presented in Fig-
ure 5.
As an alternative to the impedance plot, a single-
column array is used to represent the impedance
value, which is composed of a real part of the
impedance value followed by a imaginary part of
it. The Nyquist plot shows the actual fluctuation
of impedance, while the single-column impedance
array only reflects the impedance values of the Li-
ion batteries. Accordingly, the prediction results on
the Nyquist plot shows an considerable accuracy im-
provement compared to the single-column impedance
array in SOH prediction, which explains why the
Nyquist plot is better suited to characterizing Li-ion
battery degradation patterns than the single-column
impedance array by using the CNN model.
Figure 5: Performance comparison between CNN model
with Nyquist Plot and DNN, SVM and GPR models with
simple impedance values.
5 CONCLUSIONS
This study proposed a CNN framework for estimat-
ing the SOH of Li-ion batteries using deep learning
techniques. Firstly the EIS feature set has been ex-
tracted and normalized using the Min-Max function
from the raw EIS measurement dataset. Next, the EIS
feature set was restructured into two different forms,
the Nyquist plot and simple impedance values, in or-
der to to be fed into different neural networks and
traditional machine learning models. Based on sim-
ulation results on one of the largest publicly available
EIS datasets, the EIS features set in the Nyquist plot
form contains more detailed information than simple
impedance values regarding the battery aging process
owing to its ability to reflect the impedance change at
various SOH stages. Furthermore, the results demon-
strated that the content that reflects the fluctuation of
impedance in the Nyquist plots makes a difference
in the SOH prediction compared to single-column
impedance array. Additionally, the CNN model with
two convolutional layers, which incorporates Nyquist
plots as features, significantly improved SOH pre-
diction accuracy when compared to the DNN model
and other machine learning models that rely solely on
simple impedance values. Future studies should take
into account more various EIS data representations
and evaluation metrics in order to overcome critical
scenarios in the operations of EVs, and ensure the re-
liability and robustness of the SOH prediction of Li-
ion batteries in real world.
REFERENCES
Rauf, H., Khalid, M., & Arshad, N. (2022). Machine learn-
ing in state of health and remaining useful life esti-
mation: Theoretical and technological development
in battery degradation modelling. Renewable and Sus-
tainable Energy Reviews, 156, 111903.
Ng, K. S., Moo, C. S., Chen, Y. P., & Hsieh, Y. C. (2009).
Enhanced coulomb counting method for estimating
state-of-charge and state-of-health of lithium-ion bat-
teries. Applied energy, 86(9), 1506-1511.
Li, Y., Maleki, M., Banitaan, S., & Chen, M. (2021, De-
cember). Data-Driven State of Charge Estimation of
Li-ion Batteries using Supervised Machine Learning
Methods. In 2021 20th IEEE International Conference
on Machine Learning and Applications (ICMLA) (pp.
873-878). IEEE.
Zhang, Yunwei, Tang, Qiaochu, Zhang, Yao, Wang,
Jiabin, Stimming, Ulrich, Lee, Alpha A. (2020).
Identifying degradation patterns of lithium ion
batteries from impedance spectroscopy us-
ing machine learn- ing [Data set]. Zenodo.
https://doi.org/10.5281/zenodo.3633835
Saxena, S., Xing, Y., Kwon, D., & Pecht, M. (2019).
Accelerated degradation model for C-rate loading of
lithium-ion batteries. International journal of electri-
cal power & energy systems, 107, 438-445.
Daigle, M., Kulkarni, C. S. (2016). End-of-discharge and
end-of-life prediction in lithium-ion batteries with
ICPRAM 2023 - 12th International Conference on Pattern Recognition Applications and Methods
848

electrochemistry-based aging models. In AIAA In-
fotech@ aerospace (p. 2132).
Plett, G. L. (2004). Extended Kalman filtering for bat-
tery management systems of LiPB-based HEV battery
packs: Part 3. State and parameter estimation. Journal
of Power sources, 134(2), 277-292.
Lin, C., Xing, J., & Tang, A. (2017). Lithium-ion battery
state of charge/state of health estimation using SMO
for EVs. Energy Procedia, 105, 4383-4388.
Choi, Y., Ryu, S., Park, K., & Kim, H. (2019). Machine
learning-based lithium-ion battery capacity estimation
exploiting multi-channel charging profiles. Ieee Ac-
cess, 7, 75143-75152.
Chaoui, H., Ibe-Ekeocha, C. C., & Gualous, H. (2017).
Aging prediction and state of charge estimation of a
LiFePO4 battery using input time-delayed neural net-
works. Electric Power Systems Research, 146, 189-
197.
Fan, Y., Xiao, F., Li, C., Yang, G., & Tang, X. (2020). A
novel deep learning framework for state of health esti-
mation of lithium-ion battery. Journal of Energy Stor-
age, 32, 101741.
Yang, N., Song, Z., Hofmann, H., & Sun, J. (2022). Robust
State of Health estimation of lithium-ion batteries us-
ing convolutional neural network and random forest.
Journal of Energy Storage, 48, 103857.
Li, Y., Maleki, M., Banitaan, S., & Chen, M. (2022,
May). State of Health Indicator Modeling of Lithium-
ion Batteries Using Machine Learning Techniques. In
2022 IEEE International Conference on Electro Infor-
mation Technology (eIT) (pp. 440-445). IEEE.
Kim, S., Choi, Y. Y., & Choi, J. I. (2022). Impedance-
based capacity estimation for lithium-ion batteries us-
ing generative adversarial network. Applied Energy,
308, 118317.
Pradyumna, T. K., Cho, K., Kim, M., & Choi, W. (2022).
Capacity estimation of lithium-ion batteries using
convolutional neural network and impedance spectra.
Journal of Power Electronics, 22(5), 850-858.
Zhang, Y., Tang, Q., Zhang, Y., Wang, J., Stimming, U., &
Lee, A. A. (2020). Identifying degradation patterns of
lithium ion batteries from impedance spectroscopy us-
ing machine learning. Nature communications, 11(1),
pp. 1-6.
Li, J., Arbizzani, C., Kjelstrup, S., Xiao, J., Xia, Y. Y., Yu,
Y., ... & Passerini, S. (2020). Good practice guide for
papers on batteries for the journal of power sources. J.
Power Sources, 452(February), 227824.
Chemali, E., Kollmeyer, P. J., Preindl, M., Emadi, A.
(2018). State-of-charge estimation of Li-ion batteries
using deep neural networks: A machine learning ap-
proach. Journal of Power Sources, 400, pp. 242-255.
State of Health Estimation of Lithium-ion Batteries Using Convolutional Neural Network with Impedance Nyquist Plots
849
