
Estimating Electric Vehicle Driving Range with Machine Learning
David Albuquerque
1,2
, Artur Ferreira
1,2 a
and David Coutinho
1,2 b
1
ISEL, Instituto Superior de Engenharia de Lisboa, Instituto Polit
´
ecnico de Lisboa, Portugal
2
Instituto de Telecomunicac¸
˜
oes, Lisboa, Portugal
Keywords:
Dataset Construction, Driving Range Estimation, Electric Vehicle, Feature Engineering, Machine Learning,
Regression, Supervised Learning.
Abstract:
In the past years, we have witnessed an increase on the use of electric vehicles (EV), which are now widely
accepted as reliable and eco-friendly means of transportation. When choosing an EV, usually one of the key
parameters of choice for the consumer is its driving range (DR) capability. The DR depends on many factors
that should be addressed when predicting its value. In some cases, the existing heuristic techniques for DR
estimation provide values with large variation, which may cause driver anxiety. In this paper, we explore the
use of machine learning (ML) techniques to estimate the DR. From publicly available data, we build a dataset
with EV data suitable to estimate the DR. Then, we resort to regression techniques on models learned on the
dataset, evaluated with standard metrics. The experimental results show that regression techniques perform
adequate and smooth estimation of the DR value on both short and long trips, avoiding the need to use the
previous heuristic techniques, thus minimizing the drivers anxiety and allowing better trip planning.
1 INTRODUCTION
In recent years, car manufacturers have moved to the
manufacturing of electric vehicles (EVs), due to some
factors, such as the concern on climate change, the
dispositions of the Paris Agreement, and the need
to be eco-friendly. EVs are accepted as a sustain-
able transport solution, which have grown in popu-
larity. Vehicle manufacturers have increased the com-
petitiveness on the vehicle’s performance, namely the
driving range (DR) capability, since it is a key factor
for consumers (Egbue and Long, 2012).
The EV driving range at a given point in time of
a trip, defined as the eRange, is an estimate of the re-
maining driving distance, expressed in kilometers. Its
proper estimation eases the drivers anxiety on a trip
to a charging station and allows the driver to do ad-
equate trip planning (Smuts et al., 2017; Song and
Hu, 2021). However, the accurate estimation of the
eRange value is a challenging task, since it depends
on many dynamic driving data parameters, such as:
vehicle design; drivers behavior; weather conditions;
road inclination; commute type - city driving or high-
way driving; battery state-of-charge (SoC).
Figure 1 depicts the eRange and SoC con-
cepts (Coutinho, 2021b). Figure 2 shows the main
a
https://orcid.org/0000-0002-6508-0932
b
https://orcid.org/0000-0001-7558-9663
influencing forces on a vehicle that lead to the ac-
tual battery energy consumption. The accurate es-
timation of the eRange allows consumers to rely on
its vehicle for longer travel time and efficient charg-
ing plans. The challenges and difficulties posed in the
eRange estimation have lead to recent studies on this
topic (De Cauwer et al., 2017; Varga et al., 2019).
In the past years, machine learning (ML) techniques
have shown their effectiveness in different fields. This
is due to its nature of learning models from existing
data to gradually achieve better results making it a
widely recognized tool for many problems.
The existing eRange estimation techniques are
based on some heuristics, such as the analysis of the
average consumption of energy in the past minutes,
on a trip. These simple estimations may not produce
accurate results, since they account only for a small
Figure 1: An example of the EV eRange and state-of-charge
concepts, along with other indicators (Coutinho, 2021b).
336
Albuquerque, D., Ferreira, A. and Coutinho, D.
Estimating Electric Vehicle Driving Range with Machine Learning.
DOI: 10.5220/0011672100003411
In Proceedings of the 12th International Conference on Pattern Recognition Applications and Methods (ICPRAM 2023), pages 336-343
ISBN: 978-989-758-626-2; ISSN: 2184-4313
Copyright
c
2023 by SCITEPRESS – Science and Technology Publications, Lda. Under CC license (CC BY-NC-ND 4.0)

Figure 2: The key influencing forces on a moving vehicle.
( F
i
-inertial force; F
t
-tractive force; F
g
-gravitational force;
F
rr
-rear rolling resistance force; F
f r
-front rolling resistance
force; F
ar
-aerodynamic (air) drag; F
n
-normal force; CG-
center of gravity; α-the road slope ).
set of factors and DR estimation depends on differ-
ent variables. It is expected that the use of ML meth-
ods and models will provide better estimates, by us-
ing datasets with more variables than the ones con-
sidered in heuristic methods. Although, the training
of the models may take more time than the existing
approaches, it is expected that their use will improve
prediction accuracy. The challenge is to learn accu-
rate models with adequate response time when placed
on-board of the vehicles.
1.1 Our Proposal
In this paper, we address the eRange estimation prob-
lem with ML regression techniques, through a three
phase approach: the dataset construction and pre-
processing; learning ML models; evaluation of the
learned ML models, with standard metrics.
The remainder of this paper is organized as fol-
lows. Section 2 refers to the state-of-the-art on ex-
isting eRange estimation solutions and their use with
the available datasets. In Section 3, we present the ap-
proach and methodologies adopted in this work. The
experimental evaluation and discussion are reported
in Section 4. The paper ends in Section 5 with some
concluding remarks and directions for future work.
2 STATE OF THE ART
In this section, we address the literature and resources
for EV research, such as the eRange estimation prob-
lem, the availability of public datasets, and existing
approaches without and with ML techniques.
2.1 Research on EV
The study of EV related topics, has been the focus of
many works such as statistical measurement of charg-
ing (Brighente et al., 2021), eRange prediction (Varga
et al., 2019), charging topologies (Yilmaz and Krein,
2013), and regenerative braking (Yoong et al., 2010).
The eRange prediction is an important EV feature
to provide to consumers, as it reduces the driver’s
anxiety while driving and allows better trip planning.
When devising a solution to the eRange estimation
problem, real EV driving data in the form of a dataset
is required to learn and evaluate the proposed mod-
els. It is also necessary to compare the learned models
with the existing ones.
Vehicle manufacturers typically do not disclose
vehicle driving data or prediction algorithms. As a
good eRange prediction is a competitive factor among
EV manufacturers, it is not disclosed to the public.
2.2 Public Domain EV Datasets
Some datasets regarding EV eRange estimation are
publicly available, being composed by vehicle data
and trip data, with mainly two types of features: time-
series features, where the data points vary as a func-
tion of time; trip-invariant features, in which a given
value is kept for the entire trip. Time-series fea-
tures are usually the SoC, energy consumption, speed,
acceleration, and elevation. The trip-invariant fea-
tures refer to vehicle information such as battery ca-
pacity, average energy consumption (AEC), full bat-
tery energy (FBE), full driving distance (FDD) also
known as full battery distance (FBD), vehicle weight,
trip information such as commute type (city or high-
way), total energy consumption, and total distance.
Table 1 summarizes the key publicly available EV
datasets, namely: Vehicle Energy Dataset (VED) (Oh
et al., 2019); Emobpy dataset (Gaete-Morales et al.,
2021); Classic EV X project (Coutinho, 2021b)
dataset; Charge Car project of the CREATE Lab at
Carnegie Mellon University Robotics Institute, avail-
able at https://www.chargecar.org; the EV dataset of
the national big data alliance of new energy vehicles
(NDANEV), http://www.ndanev.com.
The VED dataset (Oh et al., 2019) provides 54 dif-
ferent EV driving trip data records for estimation, but
lack trip and vehicle information as well as EV model
variety. It contains data from three distinct EVs, all
from the same model, the 2013 Nissan Leaf.
The Emobpy Python tool (Gaete-Morales et al.,
2021) focuses on EV trip and charge data generation
through empirical mobility statistics and customiz-
able assumptions. This approach provides an infinite
supply of EV trips as well as proper vehicle informa-
tion. This dataset has some missing features such as
speed, elevation, trip, and commute type.
The Charge Car project of the CREATE Lab at
Carnegie Mellon University publicly supplies crowd-
Estimating Electric Vehicle Driving Range with Machine Learning
337

Table 1: Public domain datasets with EV data and their key properties. N/A means that the data parameter is not available.
Ensures table is placed on correct location
VED dataset Emobpy Classic EV X project ChargeCar NDANEV
Trips 507 Unlimited 3 373 2372
EV Models 1 102 1 N/A 1
Number of EV 3 N/A 1 N/A 5
Features
timestamp,
speed,
location,
battery SoC,
battery voltage,
battery current,
AC power,
heater power,
outside air temperature (OAT)
timestamp,
distance,
instant energy
consumption (IEC),
consumption,
average power,
state
timestamp,
IEC,
remain battery
energy (RBE),
speed
timestamp,
elevation,
planar distance,
adjusted distance,
speed,
acceleration,
model power,
actual power*,
current*,
voltage*
timestamp,
speed,
total voltage,
total current,
battery SoC,
temp. range,
motor voltage,
motor current,
mileage
sourced data that has served previous eRange predic-
tion models (Zheng et al., 2016). This dataset has a
large vehicle diversity due to the open nature of the
platform, allowing any user to upload combustion en-
gine based vehicle information as well as the location
data, speed, and weather, among other features.
A dataset collected through probe data from
nearly 500 battery EVs by the Japan automobile re-
search institute (JARI) from February 2011 to Jan-
uary 2013 has the following features: time, location,
vehicle state (driving, normal charging, or fast charg-
ing), speed, air-conditioner, heater state, and SoC.
Although useful and featured in some papers (Liu
et al., 2017; Liu et al., 2018; Sun et al., 2015; Sun
et al., 2016), for the research conducted in this paper,
the authors were unable to access this dataset from
https://www.jari.or.jp/research-database.
The cloud based EV dataset supplied by the
NDANEV has been used in similar eRange prediction
approaches (Zhao et al., 2020). This dataset includes
battery cell temperature information, which measures
the battery cell inconsistency.
As some datasets do not explicitly provide ve-
hicle information, the EV-database website, https:
//ev-database.org offers a public database for exist-
ing EV, displaying AEC, DR, and usable battery en-
ergy. The availability of this data enables that datasets
which lack this feature can be used in eRange predic-
tion models.
2.3 EV Autonomy Estimation
The eRange estimation has been an interesting topic
in research in recent years, in part due to the increase
in EV usage, as they become more efficient. Its pre-
diction difficulty is in part due to the fact that there
are many factors to take into account when measur-
ing it, such as battery and road information, previous
vehicle trips, and vehicle weight. This has motivated
researchers to find solutions for this problem, resort-
ing to ML techniques.
Related work has shown the use of eRange estima-
tion on EV, stating the need for different types of ac-
curacy on eRange estimation as a function of the SoC
state. In (Zhang et al., 2012), the approach is to min-
imize the performance impact of minimum cost route
searching from high accuracy eRange prediction.
The proposal in (Coutinho, 2021a) estimates the
eRange through a basic approach (BA) algorithm,
which uses manufacturers invariant vehicle informa-
tion such as FBE and AEC, as well as the instant SoC
value. In detail, the BA estimates eRange using:
• the maximum charge an electric vehicle battery
can store, known as FBE;
• the average energy consumption (AEC) of the EV,
which depends on the use of the air-conditioner
system (AcS) and on the type of trip (highway or
city driving).
It also requires the battery SoC value, at the time of
the eRange estimation. Thus, the BA eRange estima-
tion is given by
eRange =
FBE
AEC(AcS)
× SoC [km]. (1)
The eRange estimation with an adaptive history-
based approach (HBA), proposed by (Coutinho,
2021b), relies on the past 10 minutes AEC informa-
tion gradually influenced by the vehicle instant con-
sumption energy, as well as by the SoC. Once the first
10 minutes had passed, HBA applies a configured en-
ergy step to the previous prediction, depending on the
computed AEC. This approach yields more optimistic
eRange results, with slightly higher values than those
of BA, thus easing consumer’s anxiety when a higher
energy consumption does not have a linear impact on
the eRange. HBA relies on parameters such as the
full battery energy (FBE), SoC, where an instant en-
ergy consumption (IEC) is used to calculate, at each
minute, an adaptive AEC (AAEC). Thus, the eRange
ICPRAM 2023 - 12th International Conference on Pattern Recognition Applications and Methods
338

estimation for the m-th minute is
eRange
m
=
FBE
AAEC
m
× SoC
m
, (2)
where ⌊.⌋ is the floor operator. This algorithm
requires three additional parameters: delta energy
step, ∆S, which is the amount of energy incre-
ment/decrement, at each minute m; constant AEC
(CAEC), as provided by the EV manufacturer; min-
imum instance energy. AAEC
m
is updated by
AAEC
m
=
CAEC, m ≤ N
AAEC
m−1
− ∆S, MAAEC
m
< AAEC
m−1
AAEC
m−1
+ ∆S, MAAEC
m
≥ AAEC
m−1
.
(3)
by adding or subtracting the pre-configured delta
step, ∆S, to the previous AAEC calculation of the pre-
vious m minutes. Initially, AAEC is equal to the pre-
configured CAEC, until it is possible to calculate the
moving average with minimum number of N samples.
In Equation (3), MAAEC
m
is the moving average of
the current m minute IEC values, where every non-
zero IEC value is averaged for its calculation by
MAAEC
m
=
N−1
∑
i=0
w
i
× AAEC
m−i
, (4)
where N is the number of past minutes of an ob-
servation moving window. The average weights are
w
i
=
1
2
(i+1)
, such that the most recent AAEC values
have higher importance. The minimum instance en-
ergy’s role is to prevent the algorithm from perform-
ing an eRange calculation when the average IEC val-
ues for the current m minute are less than a prede-
fined threshold value. This is done so that in the event
the vehicle consumes negligible power, it would not
cause an ∆S decrement or increment on the eRange
estimation, thus preventing inaccurate eRange results.
2.4 The Use of Machine Learning
The use of ML for a multitude of cases (Amershi
et al., 2019) in fields such as big data (Zhou et al.,
2017) and data mining (Bose and Mahapatra, 2001)
has proven its robustness on solving different prob-
lems. As a result, some approaches for the eRange
estimation problem have resort to supervised learning
techniques. The use of decision trees (DT) (Alpay-
din, 2020), random forest (RF) (Breiman, 2001), and
K-nearest-neighbor (KNN) (Alpaydin, 2020) in en-
semble stacked generalization (ESG) approach (Ullah
et al., 2021), through the JARI dataset (Ullah et al.,
2021) shows better results than the use of its individ-
ual base models to predict the EV energy consump-
tion. Recent models using gradient boosted regres-
sion tree (GBRT) have combined extreme gradient
boosting (XGBoost) and light gradient boosted ma-
chine (LightGBM) to provide better predictive per-
formance from these ensemble methods (Zhao et al.,
2020) with the NDANEV dataset. This approach
classifies four driving patterns from three parameters
(speed, motor current, and change rate of motor cur-
rent), through K-means clustering algorithm and thus
influencing the resulting eRange due to their different
energy consumption rates.
The use of unsupervised clustering approaches
by self-organizing maps (SOM) (Kohonen, 2001)
have been addressed to cluster big data into driv-
ing patterns, prior to range estimation (Lee and Wu,
2015). The hybrid version of SOM with regres-
sion tree (RT) (Hastie et al., 2009) has taken ad-
vantage of SOM’s neurons storage feature of near-
ing related neighbor information being kept closely
together. Therefore, avoiding bushy trees and im-
proving upon previous solutions by keeping mean-
ingful knowledge extraction (Zheng et al., 2016) both
approaches used different datasets from undisclosed
monitored data sources.
Reinforcement learning has also been used for
external energies disturbances on the speed profile
of a driving profile so that it could then be com-
bined with multiple linear regression (MLR) for the
estimation (De Cauwer et al., 2017), using EVte-
clab’s dataset. Although more complex than previ-
ous statistical-based approaches, the use of ML for
eRange estimation reduces the error, and thus further
justifying its use in this paper.
3 PROPOSED APPROACH
In this section, we detail the approach and the
methodology that we have followed on this work.
Figure 3 depicts the generic diagram of the approach
in which we highlight that the ultimate goal is to pro-
vide the eRange estimation from the data in the input
dataset, using ML techniques.
Dataset
Existent EV
trip datasets
Process Dataset
Features
Machine
Learning
Expected
eRange [km]
Predictor
Real time driving
information *
Predicted
eRange [km]
Performance
Evaluation
* To be implemented
Figure 3: The detailed steps of the proposed approach with
ML to estimate the eRange value, from a EV dataset.
Estimating Electric Vehicle Driving Range with Machine Learning
339
3.1 Dataset Construction
As this work focuses on a relatively recent field of
study, the dataset availability is both scarce and diver-
gent, thus yielding the need to perform dataset con-
struction and preprocessing phases. A dataset was
created from historical traffic data with personally
recorded vehicle trips, as well as external existing and
publicly available datasets from both the VED, Clas-
sic EV X (Coutinho, 2021b) and ChargeCar datasets,
integrated into our dataset. The resulting dataset con-
tains multiple trips with their respective vehicle speed
(in km/h), distance (in km) battery information such
power consumption (in kW), current (in amps) and
state of charge (in %) on a time series format.
The composed dataset is used to train the se-
lected eRange prediction models on the learning
phase through ML, allowing it to fit its eRange es-
timation for each trip on the dataset. Figure 4 shows
the dataset construction phase.
The key reasons for building such a dataset are
as follows. When training a ML model for regres-
sion problems, the accuracy of the results on test data
will depend on the diversity of the data. To ensure
model effectiveness on different vehicles and to avoid
over-fitting, we opted for a diverse EV model dataset
built from existing available datasets, mentioned in
Table 1.
The algorithm integrates EV trip datasets for train-
ing, thus requiring EV trips time-series with the fol-
lowing features: SoC (in percentage), power con-
sumption (in kWh), distance (in km) and speed (in
km/h). We also have vehicle information: AEC
(kWh), FBE (kWh), and FBD (km). For this rea-
son, both VED, Classic EV X and ChargeCar datasets
were selected.
The trip type and the minimum driving time are
two variables found to influence ML methods perfor-
mance. On the preprocessing phase, some features
such as AEC, FBE, and FBD are sometimes missing
on certain datasets. These features can be obtained
from existing static EV information datasets such as
https://ev-database.org. Other features such as accel-
eration and distance, are trip dependent being com-
puted with mathematical formulas.
VED
Dataset
ChargeCar
Dataset
Classic EV X Project
Driving Range Prediction
Dataset
EV X Driving
Range Prediction
Dataset
Figure 4: Dataset construction and preparation.
The constructed dataset is mainly composed by
short vehicle trips with less than 20 minutes, with 457
out of 503 trips (90.9%) fitting in this category. The
dataset is available at (Albuquerque, 2022).
This disparity in the training data could cause im-
precise prediction on longer trips where different con-
sumption profiles are observed, such as traveling on a
highway. Another version of the dataset to be imple-
mented in the future should contain longer EV trips,
as well as the eMini project (Coutinho, 2021a) inte-
gration, for newer trip monitoring.
3.2 Learning the Models
The target (expected/baseline) eRange values are
provided by an implementation of the HBA algo-
rithm (Coutinho, 2021b), since it is not possible to
obtain actual range values. Over the dataset, we ap-
ply this approach to compute the target eRange values
y
i
. This approach addresses real-time AEC values,
that relies on the vehicle’s past N = 10 minute win-
dow of the trip’s energy consumption history as well
as the real-time SoC value. HBA was designed as a
better alternative to BA, which was also included as a
benchmark algorithm.
3.3 Regression Techniques
In this paper, we have considered the following re-
gression techniques: linear regression (LR) (Hastie
et al., 2009); ensemble stacked generalization
(ESG) (Ullah et al., 2021).
LR is a well-known statistical technique (Hastie
et al., 2009), such that it models the relationship be-
tween a scalar response and one or more independent
variables. In this case, we have multiple linear regres-
sion, since we deal with several input variables and
one output variable. The relationships between the
input and output variables are modeled using linear
predictor functions, whose unknown model parame-
ters are estimated from the data.
The ESG algorithm follows the Wolpert stacking
technique (Wolpert, 1992), combining two models.
The first one, named as base-model (Level-0) encom-
passes DT, RF, and KNN classifiers. The second
model (Level-1) is adaptive boosting (AdaBoost),
combining base model predictions to provide a single
output.
The ESG model follows the original (Ullah et al.,
2021) implementation with some differences. The
original application was the EV energy consump-
tion prediction and not eRange. Moreover, the lack
of availability of its JARI dataset could make this
implementation’s accuracy differ when training with
ICPRAM 2023 - 12th International Conference on Pattern Recognition Applications and Methods
340

our dataset. An additional ESG implementation
named ESG* was derived from the original ESG ap-
proach, changing some configurations to better fit the
project’s constructed dataset. The maximum number
of features configured for DT and RF algorithms are
9 and 7, respectively. As for the KNN, we set K = 7
neighbors, the distance metric is minkowski with pa-
rameter p set to 1. Figure 5 depicts the ESG model.
After the training of these ML algorithms, they are
used for the prediction of eRange. One of the predic-
tors is then selected based on its performance with
standard metrics. Then, it can be used for future exe-
cution on a real-time trip.
4 EXPERIMENTAL EVALUATION
In this section, we report on the experimental evalua-
tion of our approach. First, we present the evaluation
metrics considered in this work. Then, we report on
experimental results on the built dataset.
4.1 Standard Evaluation Metrics
After training the ML algorithms with the dataset, we
perform eRange estimation. The resulting prediction
is then used for the computation of the evaluation met-
rics so than it can be compared with other algorithms.
As the estimation accuracy must be measured
for each eRange estimation algorithm, five standard
evaluation metrics were chosen for this task: mean
absolute error (MAE), mean squared error (MSE),
mean absolute percentage error (MAPE), root mean
squared error (RMSE), and R
2
metric, which is the
coefficient of determination (Wright, 1921). These
evaluation metrics are employed in the k-fold cross
validation (CV) of the selected testing trip, minimiz-
ing the presence of bias.
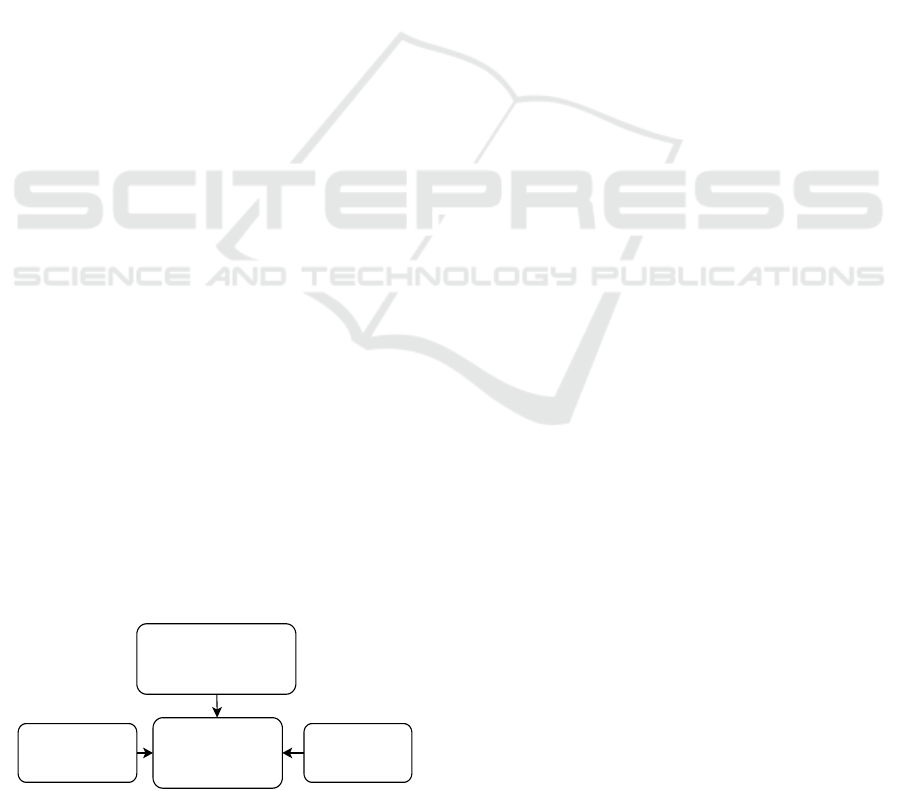
Decision Tree
(DT)
K-Nearest Neighbor
(KNN)
Random Forest
(RF)
AdaBoost
K-Fold Cross Validation
Features
Figure 5: Ensemble Stacked Generalization (ESG)
model (Ullah et al., 2021).
4.2 Experimental Results
The experiments were carried out on a computer
with the Manjaro Linux operating system, 5.18.19-
3-MANJARO kernel, AMD Ryzen 9 3900X (24)
@3.800 GHz and 48 Gb of RAM. The Python run-
time version is 3.9, using Jetbrain’s Pycharm as the
integrated development environment (IDE).
The constructed dataset holds multiple EV trips,
most of them being short city commutes, which dif-
fer in consumption of traveling in highways on longer
trips. This can cause training bias with worse predic-
tions on longer trips due to the reduced samples in the
training data. To study this effect, a longer 47 minutes
Nissan Leaf 2013 model EV trip was chosen from the
VED dataset (Oh et al., 2019) for testing, while the re-
maining trips were used for training, defining a mini-
mum trip time (MTT) required for a trip to be included
into the training set.
We have considered MTT ∈ {0, 10, 20, 30, 40}.
The number of trips available for training decreases,
as the MTT value increases. The eRange prediction
will be calculated for the selected test trip. We report
the time and evaluation metrics for the k-fold CV re-
sults, with k = 20 folds.
We compute different eRange estimation results
for the selected trip and estimation algorithms, pro-
viding an easy overview of the different dataset pa-
rameters, with multiple datasets.
Figures 6 and 7 present the eRange prediction
from the BA, HBA (the ML baseline), LR, ESG and
ESG* algorithms (in blue, red, purple, green, and
light blue, respectively) for MT T = 0. The heuristic
approaches provide similar estimates of the eRange
values. On the 12 minutes to 20 minutes time win-
dow, HBA yields a stable estimation, with segments
such that the minimum instance energy is not enough
to trigger a recalculation for the eRange while the BA
counterpart provides a continued decreasing estimate.
On ML approaches, LR provides a smoother pre-
diction evolution, while the ESG method attains esti-
mates with larger deviation and variance. This could
be the result of DT having high sensitivity to the train-
ing data, as our dataset contains a larger number of
smaller EV trips with different consumption profiles
than of longer highway trips. The ESG* which re-
Figure 6: eRange estimation with BA and HBA algorithms.
Estimating Electric Vehicle Driving Range with Machine Learning
341

Figure 7: eRange estimation by the HBA (ML baseline),
LR, ESG, and ESG* algorithms.
sulted from a better configuration to our dataset has
yielded a better predictive accuracy than the origi-
nal model. These estimates can be smoothed with a
moving-average filter applied to the sequence of ESG
estimated values.
The test trip prediction metrics for the ML algo-
rithms are reported on Table 2, and the CV metrics
are presented on Table 3.
Table 2: LR and ESG metrics for all MTT. For each MTT
value (in minutes), the best result is in bold face.
ML MTT MAE ↓ MSE ↓ MAPE ↓ RMSE ↓ R
2
↑ Time (m,s,ms)
LR 0 0.63 0.63 0.01 0.79 0.98 (0,0,138)
ESG 0 2.61 17.17 0.05 4.14 0.56 (7,25,772)
ESG* 0 1.20 2.31 0.02 1.52 0.94 (14,10,940)
LR 10 0.59 0.60 0.01 0.77 0.98 (0,0,72)
ESG 10 2.31 12.13 0.04 3.48 0.68 (4,2,146)
ESG* 10 1.51 3.65 0.02 1.91 0.90 (7,37,998)
LR 20 0.58 0.58 0.01 0.76 0.98 (0,0,29)
ESG 20 3.88 30.72 0.07 5.54 0.21 (1,33,534)
ESG* 20 2.18 7.52 0.04 2.74 0.80 (2,52,129)
LR 30 0.70 0.78 0.01 0.88 0.98 (0,0,14)
ESG 30 9.28 142.91 0.17 11.95 -2.66 (0,41,343)
ESG* 30 4.66 37.70 0.08 6.14 0.03 (1,11,669)
LR 40 0.90 1.47 0.01 1.21 0.96 (0,0,6)
ESG 40 7.17 95.45 0.13 9.77 -1.44 (0,9,706)
ESG* 40 5.11 31.93 0.10 5.65 0.18 (0,15,505)
For both tables, as MTT values increase we ob-
serve a decrease on the training time. The LR algo-
rithm training is always faster than ESG and ESG*
training. Moreover, LR achieves the best metric val-
ues.
Table 3: LR and ESG metrics for all MTT, with CV. For
each MTT value (in minutes), the best result is in bold face.
ML MTT MAE ↓ MSE ↓ MAPE ↓ RMSE ↓ R
2
↑ Time (h,m,s,ms)
LR 0 0.53 0.72 0.34 0.80 0.99 (0,0,30,64)
ESG 0 1.47 4.72 1.15 2.10 0.99 (4,3,54,919)
ESG* 0 1.27 2.99 1.10 1.67 0.99 (6,50,52,398)
LR 10 0.69 1.07 0.48 0.98 0.99 (0,0,14,543)
ESG 10 1.68 5.83 1.31 2.28 0.98 (1,57,29,701)
ESG* 10 1.33 3.34 1.05 1.77 0.99 (3,22,59,269)
LR 20 0.94 1.80 0.67 1.26 0.98 (0,0,3,805)
ESG 20 2.39 12.41 1.74 3.23 0.93 (0,41,38,272)
ESG* 20 1.71 5.42 1.36 2.21 0.96 (1,14,30,373)
LR 30 1.16 2.80 1.04 1.46 0.93 (0,0,1,143)
ESG 30 3.80 30.43 3.03 4.69 0.19 (0,18,14,883)
ESG* 30 2.83 14.02 2.47 3.39 0.51 (0,30,39,978)
LR 40 1.55 5.15 1.48 1.91 -1.61 (0,0,0,230)
ESG 40 3.26 25.78 2.91 4.17 -6.44 (0,5,26,732)
ESG* 40 2.87 14.41 3.01 3.43 -6.88 (0,8,40,895)
As the ML approaches were trained with HBA
as the baseline eRange target, future integration with
the eMini project would supply the algorithms with
real eRange, improving their prediction accuracy over
time.
5 CONCLUSIONS
The electric vehicle driving range estimation is a rele-
vant problem, since this estimate relieves the driver
anxiety on a trip and allows for a better trip plan-
ning. There are some useful heuristic approaches to
perform this estimation. However, these techniques
provide an estimate with some degree of error, which
may alarm the driver. Machine learning techniques
to provide this estimation have been proven adequate,
despite being applied to a recent field of study. There
are some public domain datasets with electric vehicle
data, but their use is not straightforward, requiring a
demanding construction and pre-processing stage for
a reliable dataset with accurate and complete trip data.
In this paper, we have composed such a dataset in
which we have assessed the use of regression tech-
niques to estimate the driving range, based on differ-
ent variables with vehicle data and trip data. The ex-
perimental results have shown the impact of different
training configurations, on existing machine learning
models. We have compared the prediction accuracy of
these techniques with standard metrics and found that
the linear regression technique shows promising pre-
diction results as well as fast training. This model can
be deployed on-board of a vehicle as it aims to be inte-
grated with the eMini project (Coutinho, 2021a). The
source code is available on the Github (Albuquerque,
2022), incentivising reproducibility on further stud-
ies.
5.1 Future Work
As future work, we plan to perform the integration
of the developed application with the real-time data
of the electric vehicle, continuously providing up-
dated eRange estimations. The base model will be
the one provided by the linear regression technique.
We also plan to include more datasets and features,
such as driving patterns and road elevation. The fine-
tuning of the ESG* parameters and results also de-
serves more attention. Moreover, additional machine
learning techniques can be added to the established
open source experimental setting.
ICPRAM 2023 - 12th International Conference on Pattern Recognition Applications and Methods
342

REFERENCES
Albuquerque, D. (2022). Electric vehicle x driving
range prediction github repository. https://github.com/
davidalb97/TFM18-2122i. Accessed: 2022-12-17.
Alpaydin, E. (2020). Introduction to machine learning. The
MIT Press, fourth edition.
Amershi, S., Begel, A., Bird, C., DeLine, R., Gall, H., Ka-
mar, E., Nagappan, N., Nushi, B., and Zimmermann,
T. (2019). Software engineering for machine learning:
A case study. In 2019 IEEE/ACM 41st International
Conference on Software Engineering: Software Engi-
neering in Practice (ICSE-SEIP), pages 291–300.
Bose, I. and Mahapatra, R. (2001). Business data mining -
a machine learning perspective. Information & Man-
agement, 39(3):211–225.
Breiman, L. (2001). Random forests. Machine Learning,
45(1):5–32.
Brighente, A., Conti, M., Donadel, D., and Turrin, F.
(2021). Evscout2.0: Electric vehicle profiling through
charging profile. CoRR, abs/2106.16016.
Coutinho, D. (2021a). Classic eMini project: Electrification
of a classic mini, technical report. Draft version.
Coutinho, D. (2021b). Classic EV X project driving range
prediction. Technical report. Draft version.
De Cauwer, C., Verbeke, W., Coosemans, T., Faid, S., and
Van Mierlo, J. (2017). A data-driven method for
energy consumption prediction and energy-efficient
routing of electric vehicles in real-world conditions.
Energies, 10(5).
Egbue, O. and Long, S. (2012). Barriers to widespread
adoption of electric vehicles: An analysis of consumer
attitudes and perceptions. Energy Policy, 48:717–729.
Special Section: Frontiers of Sustainability.
Gaete-Morales, C., Kramer, H., Schill, W.-P., and Zerrahn,
A. (2021). An open tool for creating battery-electric
vehicle time series from empirical data, emobpy. Sci-
entific Data, 8(1):152.
Hastie, T., Tibshirani, R., and Friedman, J. (2009). The
elements of statistical learning. Springer, 2nd edition.
Kohonen, T. (2001). Self-organizing maps. Springer se-
ries in information sciences, 30. Springer, Berlin, 3rd
edition.
Lee, C.-H. and Wu, C.-H. (2015). A novel big data model-
ing method for improving driving range estimation of
EVs. IEEE Access, 3:1980–1993.
Liu, K., Wang, J., Yamamoto, T., and Morikawa, T. (2018).
Exploring the interactive effects of ambient temper-
ature and vehicle auxiliary loads on electric vehicle
energy consumption. Applied Energy, 227:324–331.
Transformative Innovations for a Sustainable Future
Part III.
Liu, K., Yamamoto, T., and Morikawa, T. (2017). Impact of
road gradient on energy consumption of electric vehi-
cles. Transportation Research Part D: Transport and
Environment, 54:74–81.
Oh, G., Leblanc, D., and Peng, H. (2019). Vehicle energy
dataset (VED), a large-scale dataset for vehicle energy
consumption research.
Smuts, M., Scholtz, B., and Wesson, J. (2017). A criti-
cal review of factors influencing the remaining driving
range of electric vehicles. In 1st International Con-
ference on Next Generation Computing Applications
(NextComp), pages 196–201.
Song, Y. and Hu, X. (2021). Learning electric vehicle driver
range anxiety with an initial state of charge-oriented
gradient boosting approach. Journal of Intelligent
Transportation Systems, 0(0):1–19.
Sun, X.-H., Yamamoto, T., and Morikawa, T. (2015).
Stochastic frontier analysis of excess access to mid-
trip battery electric vehicle fast charging. Transporta-
tion Research Part D: Transport and Environment,
34:83–94.
Sun, X.-H., Yamamoto, T., and Morikawa, T. (2016). Fast-
charging station choice behavior among battery elec-
tric vehicle users. Transportation Research Part D:
Transport and Environment, 46:26–39.
Ullah, I., Liu, K., Yamamoto, T., Zahid, M., and Jamal, A.
(2021). Electric vehicle energy consumption predic-
tion using stacked generalization: an ensemble learn-
ing approach. International Journal of Green Energy,
18(9):896–909.
Varga, B., Sagoian, A., and Mariasiu, F. (2019). Prediction
of electric vehicle range: A comprehensive review of
current issues and challenges. Energies, 12(5).
Wolpert, D. (1992). Stacked generalization. Neural Net-
works, 5(2):241–259.
Wright, S. (1921). Correlation and causation. J. Agricul-
tural Research, 20:557–585.
Yilmaz, M. and Krein, P. (2013). Review of battery charger
topologies, charging power levels, and infrastructure
for plug-in electric and hybrid vehicles. IEEE Trans-
actions on Power Electronics, 28(5):2151–2169.
Yoong, M., Gan, Y., Gan, G., Leong, C., Phuan, Z., Cheah,
B., and Chew, K. (2010). Studies of regenerative brak-
ing in electric vehicle. In 2010 IEEE Conference on
Sustainable Utilization and Development in Engineer-
ing and Technology, pages 40–45.
Zhang, Y., Wang, W., Kobayashi, Y., and Shirai, K. (2012).
Remaining driving range estimation of electric vehi-
cle. In IEEE International Electric Vehicle Confer-
ence, pages 1–7.
Zhao, L., Yao, W., Wang, Y., and Hu, J. (2020). Machine
learning-based method for remaining range prediction
of electric vehicles. IEEE Access, 8:212423–212441.
Zheng, B., He, P., Zhao, L., and Li, H. (2016). A hybrid ma-
chine learning model for range estimation of electric
vehicles. In IEEE Global Communications Confer-
ence (GLOBECOM), pages 1–6.
Zhou, L., Pan, S., Wang, J., and Vasilakos, A. (2017). Ma-
chine learning on big data: Opportunities and chal-
lenges. Neurocomputing, 237:350–361.
Estimating Electric Vehicle Driving Range with Machine Learning
343
