
Predicting Hospital Length of Stay of Patients Leaving the Emergency
Department
Alexander Winter
1,3 a
, Mattis Hartwig
2,3 b
and Toralf Kirsten
1 c
1
Department of Medical Data Science, Leipzig University, Germany
2
German Research Center for Artificial Intelligence, 23562 L
¨
ubeck, Germany
3
singularIT GmbH, 04109 Leipzig, Germany
Keywords:
Length of Stay Prediction, Emergency Deparment, MIMIC-IV, CatBoost Architecture.
Abstract:
In this paper, we aim to predict the patient’s length of stay (LOS) after they are dismissed from the emergency
department and transferred to the next hospital unit. An accurate prediction has positive effects for patients,
doctors and hospital administrators. We extract a dataset of 181,797 patients from the United States and
perform a set of feature engineering steps. For the prediction we use a CatBoost regression architecture with
a specifically implemented loss function. The results are compared with baseline models and results from
related work on other use cases. With an average absolute error of 2.36 days in the newly defined use case
of post ED LOS prediction, we outperform baseline models achieve comparable results to use cases from
intensive care unit LOS prediction. The approach can be used as a new baseline for further improvements of
the prediction.
1 INTRODUCTION
Accurately predicting the patient’s length of stay
(LOS) is an important capability for hospital admin-
istrators. An accurate forecast can be used for effec-
tive planning and management of hospital resources,
which has positive effects for patients, doctors and
hospitals (Stone et al., 2022). Patients will experience
more seamless treatments and have a reduced risk of
running into capacity bottlenecks resulting in negative
effects on their recovery. Doctors will experience less
stress induced by capacity issues and do not need to
focus on ad-hoc capacity planning (Rocheteau et al.,
2021). Hospitals can achieve a better utilization of re-
sources and capacities, which will increase their effi-
ciency and enable more sustainable budgeting. Since
many patients enter the hospital through the emer-
gency department (ED) the transition from ED to the
follow-up unit is an interesting point in time for pre-
dicting the remaining LOS (Christ et al., 2010).
In this paper, we use the MIMIC-IV dataset as a
basis to learn a regression model for LOS prediction
at the moment when the patient is released from the
a
https://orcid.org/0000-0002-2866-0073
b
https://orcid.org/0000-0002-1507-7647
c
https://orcid.org/0000-0001-7117-4268
ED. The version 4 of the MIMIC dataset has been
published recently and is the first version that con-
tains specific ED data. Older versions of the MIMIC
dataset have already been used for LOS prediction
which makes our results comparable to other research
(Gentimis et al., 2017; Rocheteau et al., 2021). Vari-
ables that influence the hospital LOS are plentiful.
They include mostly medical information but can also
depend on organizational problems, like unavailabil-
ity of beds or personal issues, for example a doctor
making a misdiagnosis (Buttigieg et al., 2018). An
amount of over 250,000 patients and the number of
features make the prediction tasks very suitable for
machine learning methods. Since the dataset contains
many high dimensional categorical features, we use
the state-of-the-art CatBoost model (Dorogush et al.,
2018) together with a feature engineering, hyperpa-
rameter tuning, and a specifically implemented loss
function for the regression and task. We also use naive
prediction models that predict the mean and median
for regression or the most common unit for the clas-
sification task as benchmarks. We achieve an average
absolute error of 2.36 days which is significantly bet-
ter than the baseline models and comparable to the
work on other prediction tasks based on the MIMIC
dataset.
The remainder of the paper is structured as fol-
124
Winter, A., Hartwig, M. and Kirsten, T.
Predicting Hospital Length of Stay of Patients Leaving the Emergency Department.
DOI: 10.5220/0011671700003414
In Proceedings of the 16th International Joint Conference on Biomedical Engineering Systems and Technologies (BIOSTEC 2023) - Volume 5: HEALTHINF, pages 124-131
ISBN: 978-989-758-631-6; ISSN: 2184-4305
Copyright
c
2023 by SCITEPRESS – Science and Technology Publications, Lda. Under CC license (CC BY-NC-ND 4.0)

lows. Section 1 gives an overview of the related work
when it comes to LOS prediction. Section 3 intro-
duces the dataset and Section 4 describes the meth-
ods used in this paper together with the experimental
setup. The results are discussed in Section 5. The
paper concludes in Section 6.
2 RELATED WORK
LOS has been researched from various perspectives.
Business process research is one perspective that
works more as a motivation for our work than as re-
lated in terms of methodology. Sadler et al. (Sadler
et al., 2011) have identified LOS as a relevant busi-
ness factor, De Jong et al. (De Jong et al., 2006) have
looked into the effect of LOS distributions in hos-
pitals on decisions made by doctors and Buttgieg et
al. (Buttigieg et al., 2018) have investigated differ-
ent structural effects that increase the overall average
LOS for hospitals.
The directly related work has also built models for
predicting LOS in different situations. There are sev-
eral papers that also have performed LOS prediction
in other scenarios on older versions of the MIMIC
dataset. Gentimis et al. (Gentimis et al., 2017) have
set-up a binary classifier that differentiates between
short ( ≤ 5 days) and long (> 5 days) stays after a
patient leaves the intensive care unit (ICU) using a
neural network. Zebin et al. (Zebin et al., 2019) have
used a similar approach with slightly different classes
( ≤ 7 days and > 7 days). Rocheteau et al. (Ro-
cheteau et al., 2021) have used a temporal pointwise
convolutional model to predict the remaining days of
patients in intensive care.
There are also studies focusing on specific
datasets or cohorts. Here we only name a few that
have a direct link to ED patients. Launay et al. (Lau-
nay et al., 2015) have classified prolonged LOS us-
ing a neural network and Chang et al. (Chang et al.,
2022) have further focused on classifying the pro-
longed LOS on severe subgroups in the data and have
achieved best results using a CatBoost model. Zol-
banin et al. (Zolbanin et al., 2020) has focused on
predicting LOS for patients with chronic diseases on
a specialized dataset. Stone et al. (Stone et al., 2019)
has focused on using admission data to predict the ED
LOS.
For an extensive overview of studies connected
with LOS prediction Stone et al. (Stone et al., 2022)
and Bacchi et al. (Bacchi et al., 2022) have set-up
two review papers. Both review papers differentiate
between solving a classification task (i. e. long vs
short stay) and a regression task (i. e. predicting the
LOS on a continuous time-scale). Overall the related
work shows that the LOS prediction is a frequently
researched task. Several works focus on using infor-
mation from a previous unit to predict LOS of the next
unit. Despite the importance of the patients that have
come through ED admission, to our knowledge pre-
dicting LOS of patients from information available
at the point in time of leaving the ED unit has not
been researched before. An explanation is that the
MIMIC-IV dataset, and with it the ED module, has
only been released rather recently. Additionally, the
overall availability of large datasets that cover multi-
ple process steps in hospitals is quite small.
3 DATASET
The chosen database of our work is MIMIC-IV, a cen-
tralized medical information mart, which holds health
records of more than 250,000 patients admitted to the
Beth Israel Deaconess Medical Center in Boston be-
tween the years 2008 - 2019 (Johnsen et al., 2021).
All patient data has been extracted from the hospi-
tal databases, prepared and reorganized to facilitate
data analysis for researchers and anonymized to pro-
tect each patients personal information.
The MIMIC-IV database is structured into the
modules core, hosp and icu, which store a compre-
hensive view of each patient stay from demographic
information to laboratory results. The newly added
ed module further includes data originating from the
emergency department.
Our cohort has been selected to only include adult
patients (age > 18) who had at least one stay in the
emergency department. We further excluded very
long stays (LOS > 50 days) to remove extreme out-
liers, which resulted in dropping 537 stays. Patients
with missing data, which is only present in the triage
table, have been dropped from the final dataset. The
selection resulted in a total of 181,797 patients ex-
tracted from MIMIC-IV.
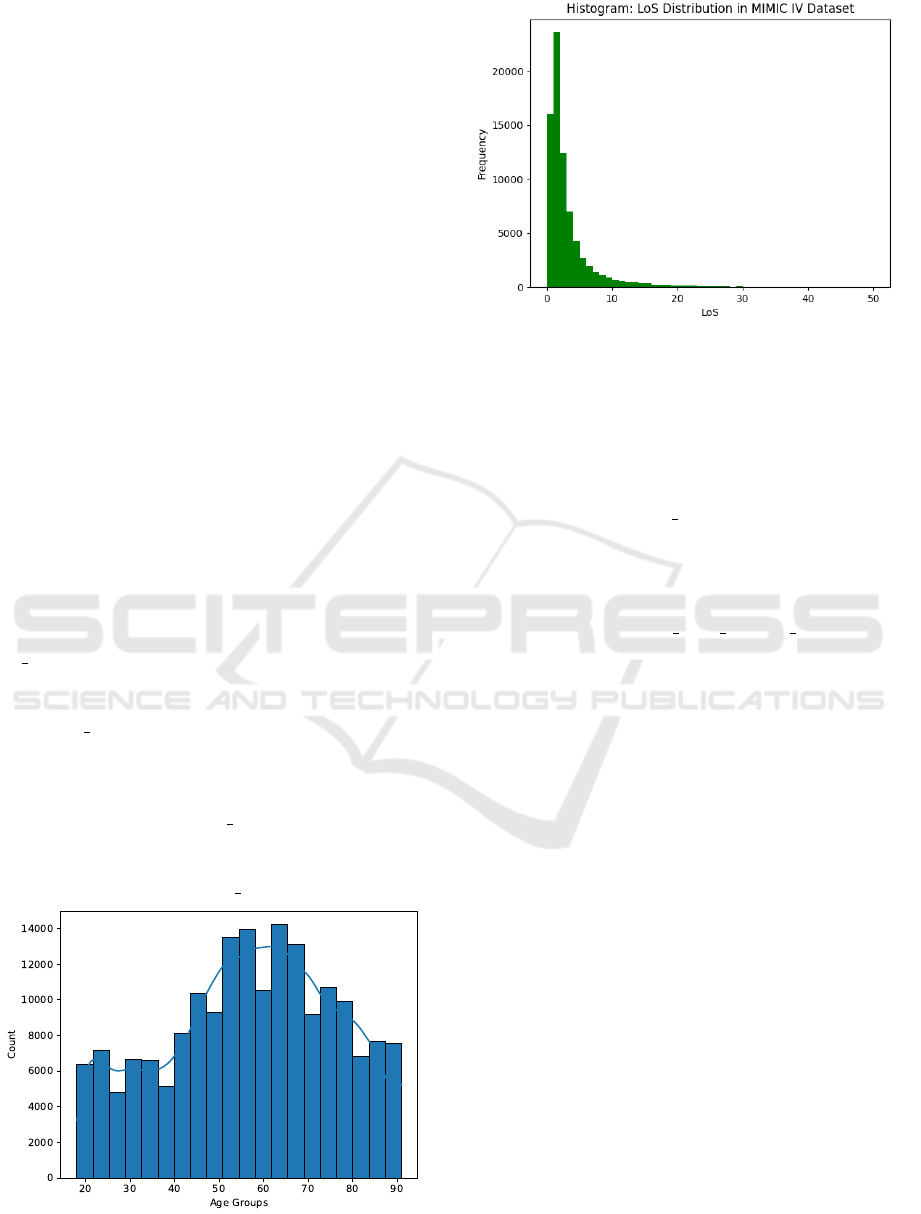
As Figure 1 shows, ages are in the range of 18 to
91, with all patients older than 89 grouped into the
age of 91. The largest amount of patients fall into the
range of 50 to 70 years of age. The distribution of
women and men is equal in the dataset, with around
52% of stays by female patients.
Figure 2 shows the LOS distribution for patients
in the MIMIC IV database. The graph displays the
typical positive skew of LOS data, with the mean at
3.9 days and a median value of 2.4 days.
Predicting Hospital Length of Stay of Patients Leaving the Emergency Department
125
4 METHODS
In this section, we give a brief overview of the tech-
nical methodology used in the experiments. The
methodology is structured into feature engineering,
the CatBoost architecture, the chosen loss functions
and the hyperparameter tuning.
4.1 Features
Features have been selected based on the research of
Buttigieg et al. (Buttigieg et al., 2018) and are catego-
rized into the thematic groups: demographics, medi-
cal and triage.
Demographics are features that are effected by
the patient directly and by their living circumstances.
They consist of the age, gender, insurance and eth-
nicity. All the values are retrieved directly from the
patients and admission table, as they are included in
the electronic health record (EHR).
Medical features refer to attributes that depend on
the specific hospital stay. This includes the admis-
sion location and the diagnosis given to patients at the
end of their emergency department stay in form of an
ICD-Code.
Additional features have been engineered from the
existing data, to take advantage of additional infor-
mation existing in MIMIC IV. The variables los and
ed los are based on the admission and discharge times
from the hospital and emergency department. Both
values can be calculated directly from the admission
and the ed stays table, where admission and discharge
times are available and represent the fractional days a
patient has spent in the hospital and the emergency
department respectively.
The variable diagnosis count is calculated by
summing up each individual diagnosis given to a pa-
tient during their stay, which is noted in the diagnosis
table. The variable medicine count follows the same
Figure 1: Age distribution of the created dataset used for
LOS prediction.
Figure 2: LoS distribution as a histogram for all patients
from MIMIC-IV. Values larger than 50 are ignored for the
purpose of visibility
procedure, but is calculated from the medrecon ta-
ble, which tracks the medicine a patient is taking cur-
rently. Both values are created to add further informa-
tion about the complexity of the patients condition.
The variable previous stays is calculated by count-
ing all hospital admissions a patient has had in the
past. This can be done by counting the amount of dif-
ferent hospital admissions for a single patient prior to
the current admission date.
The variable previous stays average length is cre-
ated by adding the LOS value of the stays found and
dividing by the number of previous stays.
Triage data is collected specifically while patients
are in the emergency department by a care provider
asking questions to assess the patients’ current health
status questions. Afterwards the patients’ vital signs
are measured. Based on the measurement the level
of acuity is decided, which serves as the basis when
deciding if the patient has to be put into critical care.
Features resulting from vital signs are resprate, the
resperatory rate in breaths per minute, temperature,
o2sat, sbp and dbp, paint and acuity.
Table 1 gives an overview about all the features
extracted from MIMIC IV, including each type and
where it is extracted from. The engineered features
and how they have been created are further explained
in Section 4.1.
4.2 CatBoost Architecture
CatBoost is an open-source library for gradient boost-
ing. The name stands for categorical boosting, be-
cause the CatBoost architecture is able to handle
categorical data directly, without the need of man-
ual conversion to a numerical representation (Doro-
gush et al., 2018). The algorithm is designed to
HEALTHINF 2023 - 16th International Conference on Health Informatics
126

calculate target statistics for each categorical value,
which transforms the categorical into a numeric value,
while keeping the information the feature holds intact.
The conversion avoids adding unfeasible amounts
of columns to a dataset, which is a known prob-
lem with One-Hot-Encoding (Cerda and Varoquaux,
2022). With over 13,000 possible ICD-Codes in the
database, One-Hot-Encoding has passed the limits in
usefulness.
Comparing CatBoost to other popular boosting
frameworks like XGBoost or LightGBM show that
CatBoost achieves state-of-the-art performance, both
on quality and speed. It outperformed both frame-
works on multiple tasks (Dorogush et al., 2018). In
the realm of boosting frameworks, CatBoost has in-
creased in popularity compared to the other libraries.
To give an example, in healthcare CatBoost has been
used for predicting ICU mortality (Safaei et al., 2022)
and to predict if a patient will need mechanical venti-
lation during the hospital stay (Yu et al., 2021).
4.3 Loss Function & Evaluation Metrics
We use the CatBoost Model in two configurations.
First, we fit a model on the root mean squared er-
ror (RMSE) loss function provided by the CatBoost
library. RMSE is a commonly used metric in ma-
chine learning tasks, which penalizes larger errors
more heavily than smaller ones.
Because of the high positive skew of LOS data, it
is important to consider a loss function, that is more
robust against outliers and able to mitigate the skwe-
ness of the data (Rocheteau et al., 2021). In accor-
dance to the findings of Rocheteau et al. (Rocheteau
et al., 2021), we used the root mean squared logarith-
Table 1: Features extracted from MIMIC IV, with type and
source table.
Group Feature Type Source Table
Demographic
Gender Binary Patients
Age Discrete Patients
Ethnicity Categorical Admissions
Insurance Categorical Admissions
Medical
ICD Code Categorical Diagnosis
Adm. Location Categorical Admissions
Diagnosis Count Discrete Engineered
Medicine Count Discrete Engineered
Previous Stays Discrete Engineered
Prev. Stays Avg. Continuous Engineered
ED LoS Continuous Engineered
LoS Continous Engineered
Triage
Resprate Discrete Triage
Temperature Continuous Triage
O2sat Discrete Triage
sbp Discrete Triage
dbp Discrete Triage
Pain Discrete Triage
Acuity Discrete Triage
mic error (RMSLE) as a second loss function, which
penalizes proportional errors and is less affected by
outliers. Since CatBoost does not provide RMSLE
as an optimization objective, we have implemented it
ourselves using the custom objective interface.
Since we want to compare our results to the works
of Rocheteau et al. (Rocheteau et al., 2021) and Gen-
timits et al. (Gentimis et al., 2017), our LOS predic-
tion is conducted in a similar way to the aforemen-
tioned works and uses the same metrics for evalua-
tion. Metrics used are mean squared error (MSE),
mean absolute percentage error (MAPE), mean ab-
solute error (MAE), mean squared logarithmic error
(MSLE) and the coefficient of determination (R2).
For the case of using predictions to optimize clini-
cal processes and capacity the MAE and MAPE er-
rors are the most important. Additionally, in order to
compare our results to the results of Gentimis et al.
(Gentimis et al., 2017), who predicted short ( ˆy <= 5)
vs. long stays ( ˆy > 5), the results of the regressor and
the target values are converted into a categorical rep-
resentation of short vs, long stay with the same thresh-
old of 5 days. After the conversion we calculate the
accuracy of the CatBoost model for the classification
task.
4.4 Hyperparameter Tuning
Since CatBoost is a library for gradient boosted trees,
hyperparameters fall into the domain of tree-specific
parameters. CatBoost provides an order of impor-
tance in the documentation
1
, going from convention-
ally most influential parameters to the more case spe-
cific ones. First, we used the CatBoost regression
model with default values, to check for initial over-
fitting and to get reasonable default values for each
parameter.
Afterwards we performed a grid search, with the
hyperparameter space being a combination of the
most influential parameters, which are the learning
Table 2: Hyperparameter selection of the final CatBoost
model, after the grid search has been performed.
Hyperparameter Value Default
Learning rate 0.1 no
Tree Depth 6 no
L2 regularization 50 no
Random strength 1 yes
Bagging temperature 1 yes
Border count 128 yes
Internal dataset order False yes
Tree growing policy Symmetric yes
1
https://catboost.ai/en/docs/concepts/parameter-tuning
Predicting Hospital Length of Stay of Patients Leaving the Emergency Department
127

rate, the tree depth and the L2 regularization. The
values for the grid search are predefined with the de-
fault values and recommendations from the CatBoost
documentation serving as the basis for the selection.
We selected the parameters of the run with the
most optimal evaluation metric as the parameters for
the final model. Table 2 presents the selected hyper-
parameters.
Performing the grid search has shown, that ad-
justing the tree depth contributed the most to the
emergence of under- or overfitting. Larger trees per-
formed better on the training dataset, but but lost per-
formance when making predictions on the evaluation
data, which is a sign that the model lost the ability to
generalize on new data.
4.5 Generation of Final Results
The LOS prediction is performed with the model
setup described above. We split our dataset into train,
validation and test data with a proportion of 60%,
20% and 20% respectively. The training and testing is
conducted in 10 runs, where each run has the model
train and predict on a new, randomly sampled dataset,
which introduces some randomness in the data to not
have the model be influenced by a biased selection of
the dataset.
To provide an unbiased evaluation of the model
performance during training and hyperparameter tun-
ing, the validation data is used to calculate the met-
rics during training. Finally, the model is tested on
the new, unseen test data, where the evaluation met-
rics described in Section 4.3 are calculated from the
model results.
To understand the impact of the diagnosis a patient
received at the end of the emergency department stay,
we have created two separate training datasets with
varying levels of detail of the ICD-Code.
3 Digit ICD-Code: The first dataset has the ICD-
Codes truncated to 3 digit codes to reduce the cardi-
nality, while also reducing the amount of information
the ICD-Code holds.
Full ICD-Code: The second dataset uses full ICD-
Codes, where each ICD-Codes encodes the most in-
formation about the patients condition.
The separation has been performed to take advan-
tage of CatBoosts ability to handle inputs with high
cardinality. We calculate the selected evaluation met-
rics (see section 4.3) based on the results of each run
and calculate 95%-confidence for every metric. The
same procedure is repeated for the baseline models.
4.6 Baselines
We included additional baseline models in our work,
to evaluate the CatBoost model. We used mean and
median predictors, which calculate the mean and me-
dian of the training dataset and use the values for ev-
ery prediction. In our case the values are 3.9 for the
mean and 2.4 for the median regressor. The so called
Dummy Regressor is the most simple model possi-
ble, which is better than random guessing, because it
is independent from the actual input when making a
prediction. They are used to set performance expec-
tations for the task on our specific dataset.
Additionally, we used a linear regression model to
predict the LOS as a further baseline. Linear regres-
sion has been used in LOS prediction before and is
usually a popular choice, because it is widely appli-
cable and the results can be easily interpreted (Austin
et al., 2002).
5 RESULTS & DISCUSSION
In this section, we present the results of the trained
regression models and compare our results and accu-
racy metrics to related works (Gentimis et al., 2017;
Rocheteau et al., 2021).
5.1 Prediction Results
Table 3 shows the chosen metrics for seven differ-
ent regressor models. The first three models are our
three baseline models. Due to the skew of the LOS
curve, the median model, which is predicting slightly
lower LOS times, has slightly worse performance on
the MSE. Looking at our main metrics when it comes
to usability, MAE and MAPE are the better metrics
for the median model. The linear regression is not
adding any value and in fact makes the model worse,
which shows that more complex models are needed to
solve the use case.
The following four models are different versions
of the CatBoost model (trained on two different data
sets and using two different loss-functions). All four
CatBoost models are better than the baseline mod-
els. The best results terms of MAE and MAPE
are achieved by the CatBoost (RMSLE, 3-digit ICD
codes) model, where we get a MAE of 2.36 and a
MAPE of 136. Compared with the baseline model,
the increase is significant but has still room for im-
provements. Especially, the change of going to the
RMSLE loss function that we implemented for the
CatBoost architecture was able to achieve a signifi-
cant gain compared to the RMSE loss function. The
HEALTHINF 2023 - 16th International Conference on Health Informatics
128
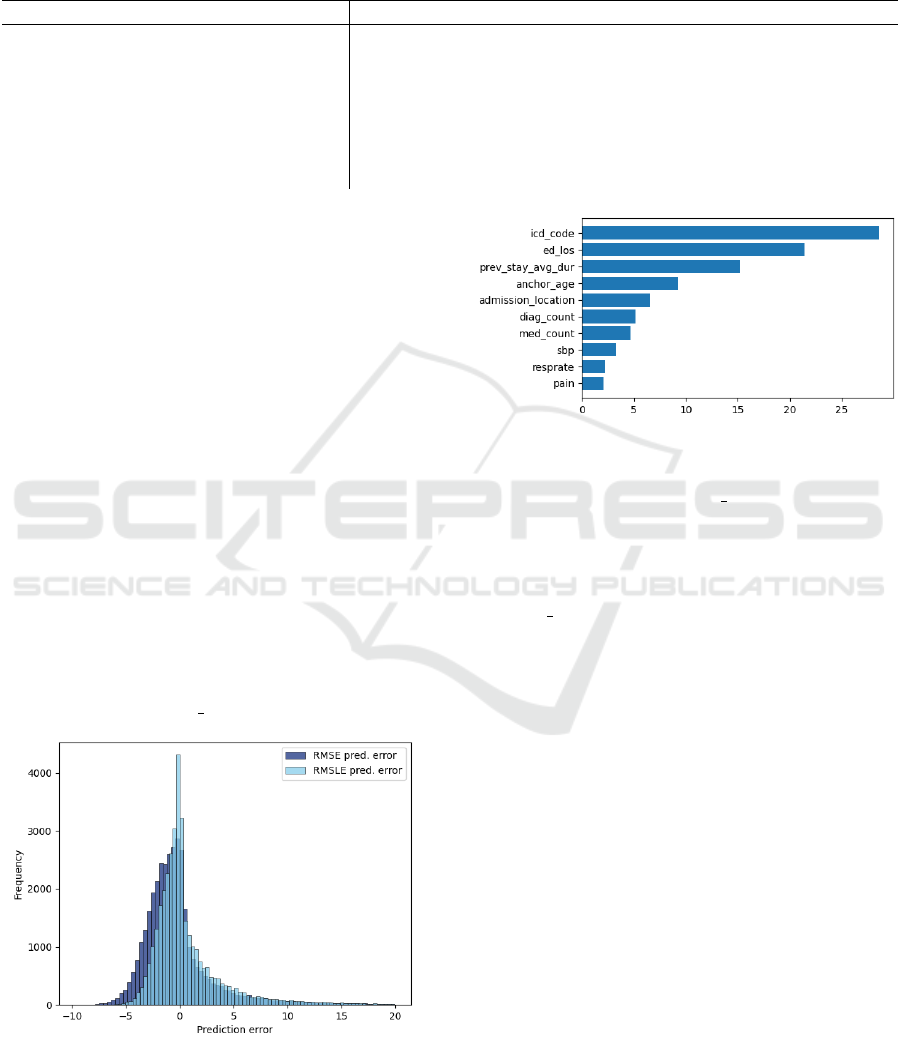
Table 3: Regression results of the CatBoost model compared to the defined baselines. Three separate datasets are used during
the experiments and the metrics are calculated for each dataset. Results are displayed as 95%-Confidence intervals. The
intervals are not calculated for the dummy predictors, because they are deterministic. The CatBoost model is trained with
both the RMSE and RMSLE loss function. For the first four metrics lower values are better. The R2 score is optimal for a
value of one.
Model MSE MAE MAPE MSLE R2
Mean 25.03 3.15 372 0.66 0
Median 27.6 2.88 229 0.57 -0.09
Linear Regression 27.3±0.0 3.34±0.00 379±0 0.73±0.00 -0.09±0.00
CatBoost (RMSE) (3 digit ICD-Code) 20.23±0.01 2.61±0.00 209±0 0.42±0.00 0.18±0.00
CatBoost (RMSLE) (3 digit ICD-Code) 21.59± 0.00 2.36±0.00 136±0 0.36±0.00 0.13±0.00
CatBoost (RMSE) (Full ICD-Code) 19.82±0.00 2.58±0.00 206±0 0.41±0.00 0.18±0.00
CatBoost (RMSLE) (Full ICD-Code) 21.70±0.00 2.42±0.00 129±0 0.36±0.00 0.11±0.00
performance increase is in line with other research
in use cases that have very skewed distributions in
the prediction variable (Rocheteau et al., 2021; Feng
et al., 2014; Rengasamy et al., 2020). As can be seen
in Figure 3, the model trained with the RMSLE loss
function managed to further centralize the loss around
zero, with around 43 per cent of errors being below
one day. As negative values signify that predictions
are lower than the target, the overall shift to the right
shows that the model with the RMSLE loss function
is more likely to overpredict. The model predictions
do not vary greatly over the ten runs, as the 95%-
Confidence intervals in Table 3 show.
Figure 4 shows the feature importance of the
model provided by the CatBoost library. The figure
shows that the top features are all related directly to
the patient condition, with the most important feature
being the actual diagnosis. Furthermore, the graph
shows that engineered features have made an overall
impact on the prediction, since 4 out of the top 10 fea-
tures to the model have been created. To the contrary,
the high influence of ed los can be seen as a limita-
Figure 3: Comparison of prediction errors for the RMSE
(blue) and RMSLE (light-blue) loss functions. RMSLE had
a lower variance, further centering the errors around zero.
Predictions errors that are greater than 20 days are hidden
here, to improve readability.
Figure 4: Top 10 most important features to the CatBoost
model.
tion of the model, since the ed los can be influenced
by more than the medical condition of the patient. Op-
erational factors, like holding patients in the ED be-
cause of hospital unit overcrowding, would prolong
the ED stay as well. Therefore, the exact composition
of the ed los and its actual influence on the hospital
LOS should be further investigated.
Lastly, the graph shows that mostly medical fea-
tures, related to the patient condition directly, are of
importance to the model. The ICD-Code had the
largest impact over all the features used during train-
ing, significantly impacting the final prediction. Com-
paring the results on the two datasets from Table 3
shows an increase in performance when using the full
ICD-Code, which further confirms the importance of
accounting for categorical data.
5.2 Comparison with Related Work
As described above we compare our results to the re-
sults from Rocheteau et al. (Rocheteau et al., 2021)
and Gentimis et al. (Gentimis et al., 2017). It is im-
portant to stress that both works have solved different
prediction tasks to our work. Gentimis et al. (Gen-
timis et al., 2017) predicts the LOS of the patient af-
ter they leave the ICU. Rocheteau et al. (Rocheteau
et al., 2021) predicts the time the patient is staying
in ICU. They used different data compared to our ED
Predicting Hospital Length of Stay of Patients Leaving the Emergency Department
129

Table 4: Performance of the regressor model compared to the works of Rocheateau and Gentimis (Gentimis et al., 2017;
Rocheteau et al., 2021). The same metrics are used for comparison.
Model MSE MAE MAPE MSLE R2 Short vs. Long
CatBoost (RMSE) 20.23 2.61 209 0.42 0.18 74%
CatBoost (RMSLE) 21.59 2.36 136 0.36 0.13 78%
TPC (MSE) 21.6 2.21 154.3 1.80 0.27 —
TPC(MSLE) 21.7 1.78 63.5 0.70 0.27 —
Gentimis NN — — — — — 79%
use case. Nevertheless we include a comparison to
see, if the performance metrics of the predictions are
in a similar range.
Our reported metrics match the ones from Ro-
cheteau et al. (Rocheteau et al., 2021). Gentimis
et al. (Gentimis et al., 2017) have chosen a classi-
fication between long stays and short stays, where a
long stay is predicted, when the LOS is greater than 5
days. Consequently, the prediction results of the Cat-
Boost model must be transformed to be comparable.
The transformation has been performed by retroac-
tively classifiying the prediction outputs and the tar-
get variable depending on its value being lower or
greater than 5. Afterwards, the accuracy is calculated
by comparing both values, which results in the same
metric used by Gentimis et al.
Table 4 displays the results of all metrics, the last
column being the accuracy on classifying short vs.
long stays, which Gentimis et al. have done. The
CatBoost model produced similar but slightly worse
results compared to the Temporal Pointwise Convo-
lution Network created by Rocheteau et al. when it
comes to MAE and MAPE and relatively compara-
ble results when it comes to MSE. The distribution of
ICU LOS is significantly narrower compared to reg-
ular station LOS after ED dismissal which might be
part of the explanation. The tendency of getting bet-
ter performance when switching from RMSE/MSE
to RMSLE/MSLE was also observed by Rocheteau
et al. Our transformed classification metric shows
almost identical accuracy performance (78% for the
CatBoost RMSLE, 3-Digit Groups) as the results of
Gentimis et al. (79%).
6 CONCLUSION
In this paper, we have used the released ED data of the
MIMIC-IV dataset released in 2020 to predict clinical
LOS of patients after their ED stay. We have trained
a CatBoost model on the LOS prediction task and im-
plemented the MSLE loss function as a transfer from
other models to the CatBoost architecture. The per-
formed feature engineering had a positive effect on
the prediction quality, as 4 out of the top 10 important
features are engineered, which further reiterates the
importance of taking advantage of domain knowledge
to extract additional information. Our prediction per-
formance was better than the implemented baseline
models and comparable to similar use cases of predic-
tions using the MIMIC dataset. The average absolute
error of 2.36 days is a significant improvement and
might be used for better planning in hospitals but still
has room for improvement. A further reduction of
the prediction error based on our presented approach
will be the target for future research. Potential ideas
could be to refine the feature engineering process with
more domain knowledge, e. g. by grouping further
grouping of high dimensional categorical features, or
to benchmark further model architectures, e.g. Gen-
eralized Linear Models (GLMs) that have been shown
effective in dealing with skewed data.
REFERENCES
Austin, P. C., Rothwell, D. M., and Tu, J. V. (2002). A com-
parison of statistical modeling strategies for analyzing
length of stay after cabg surgery. Health Services and
Outcomes Research Methodology, 3(2):107–133.
Bacchi, S., Tan, Y., Oakden-Rayner, L., Jannes, J., Kleinig,
T., and Koblar, S. (2022). Machine learning in the
prediction of medical inpatient length of stay. Internal
medicine journal, 52(2):176–185.
Buttigieg, S. C., Abela, L., and Pace, A. (2018). Vari-
ables affecting hospital length of stay: A scoping re-
view. Journal of Health Organization and Manage-
ment, 32(3):463––493.
Cerda, P. and Varoquaux, G. (2022). Encoding high-
cardinality string categorical variables. IEEE
Transactions on Knowledge and Data Engineering,
34(3):1164–1176.
Chang, Y.-H., Shih, H.-M., Wu, J.-E., Huang, F.-W., Chen,
W.-K., Chen, D.-M., Chung, Y.-T., and Wang, C. C.
(2022). Machine learning–based triage to identify
low-severity patients with a short discharge length
of stay in emergency department. BMC Emergency
Medicine, 22(1):1–10.
Christ, M., Grossmann, F., Winter, D., Bingisser, R., and
Platz, E. (2010). Modern triage in the emergency
department. Deutsches
¨
Arzteblatt international, page
892–898.
HEALTHINF 2023 - 16th International Conference on Health Informatics
130

De Jong, J. D., Westert, G. P., Lagoe, R., and Groenewe-
gen, P. P. (2006). Variation in hospital length of stay:
do physicians adapt their length of stay decisions to
what is usual in the hospital where they work? Health
Services Research, 41(2):374–394.
Dorogush, A. V., Ershov, V., and Gulin, A. (2018). Cat-
boost: gradient boosting with categorical features sup-
port. ArXiv, abs/1810.11363.
Feng, C., Hongyue, W., Lu, N., Chen, T., He, H., Lu, Y.,
and Tu, X. (2014). Log-transformation and its impli-
cations for data analysis. Shanghai archives of psychi-
atry, 26:105–9.
Gentimis, T., Alnaser, A. J., Durante, A., Cook,
K., and Steele, R. (2017). Predicting hospital
length of stay using neural networks on mimic
iii data. 2017 IEEE 15th Intl Conf on De-
pendable, Autonomic and Secure Computing, 15th
Intl Conf on Pervasive Intelligence and Comput-
ing, 3rd Intl Conf on Big Data Intelligence and
Computing and Cyber Science and Technology
Congress(DASC/PiCom/DataCom/CyberSciTech).
Johnsen, A., Bulgarelli, L., Horng, S., Celi, L. A.,
and Mark, R. (2021). Mimic-iv (version 1.0).
https://doi.org/10.13026/s6n6-xd98.
Launay, C., Rivi
`
ere, H., Kabeshova, A., and Beauchet, O.
(2015). Predicting prolonged length of hospital stay
in older emergency department users: use of a novel
analysis method, the artificial neural network. Euro-
pean journal of internal medicine, 26(7):478–482.
Rengasamy, D., Rothwell, B., and Figueredo, G. P. (2020).
Asymmetric loss functions for deep learning early
predictions of remaining useful life in aerospace gas
turbine engines. 2020 International Joint Conference
on Neural Networks (IJCNN), page 1–7.
Rocheteau, E., Li
`
o, P., and Hyland, S. (2021). Temporal
pointwise convolutional networks for length of stay
prediction in the intensive care unit. Proceedings of
the Conference on Health, Inference, and Learning.
Sadler, B. L., Berry, L. L., Guenther, R., Hamilton, D. K.,
Hessler, F. A., Merritt, C., and Parker, D. (2011). Fa-
ble hospital 2.0: the business case for building bet-
ter health care facilities. Hastings Center Report,
41(1):13–23.
Safaei, N., Safaei, B., Seyedekrami, S., Talafidaryani, M.,
Masoud, A., Wang, S., Li, Q., and Moqri, M. (2022).
E-catboost: An efficient machine learning framework
for predicting icu mortality using the eicu collabora-
tive research database. PLOS ONE, 17(5).
Stone, K., Zwiggelaar, R., Jones, P., and Mac Parthal
´
ain,
N. (2022). A systematic review of the prediction of
hospital length of stay: Towards a unified framework.
PLOS Digital Health, 1(4):e0000017.
Stone, K., Zwiggelaar, R., Jones, P., and Parthal
´
ain, N. M.
(2019). Predicting hospital length of stay for accident
and emergency admissions. In UK Workshop on Com-
putational Intelligence, pages 283–295. Springer.
Yu, L., Halalau, A., Dalal, B., Abbas, A. E., Ivascu, F.,
Amin, M., and Nair, G. B. (2021). Machine learning
methods to predict mechanical ventilation and mortal-
ity in patients with covid-19. PLOS ONE, 16(4).
Zebin, T., Rezvy, S., and Chaussalet, T. J. (2019). A deep
learning approach for length of stay prediction in clin-
ical settings from medical records. In 2019 IEEE
Conference on Computational Intelligence in Bioin-
formatics and Computational Biology (CIBCB), pages
1–5. IEEE.
Zolbanin, H. M., Davazdahemami, B., Delen, D., and
Zadeh, A. H. (2020). Data analytics for the sustainable
use of resources in hospitals: predicting the length of
stay for patients with chronic diseases. Information &
Management, page 103282.
Predicting Hospital Length of Stay of Patients Leaving the Emergency Department
131
