
Benchmarking the BRATECA Clinical Data Collection for Prediction
Tasks
Bernardo Scapini Consoli
1 a
, Renata Vieira
2 b
and Rafael H. Bordini
1 c
1
School of Technology, Pontifical Catholic University of Rio Grande do Sul, Porto Alegre, Brazil
2
CIDEHUS, University of
´
Evora,
´
Evora, Portugal
Keywords:
Computational Medicine, Healthcare Informatics, Clinical Prediction, Clinical Data, BRATECA.
Abstract:
Expanding the usability of location-specific clinical datasets is an important step toward expanding research
into national medical issues, rather than only attempting to generalize hypotheses from foreign data. This
means that benchmarking such datasets, thus proving their usefulness for certain kinds of research, is a worth-
while task. This paper presents the first results of widely used prediction tasks from data contained within the
BRATECA collection, a Brazilian tertiary care data collection, and also results for neural network architec-
tures using these newly created test sets. The architectures use both structured and unstructured data to achieve
their results. The obtained results are expected to serve as benchmarks for future tests with more advanced
models based on the data available in BRATECA.
1 INTRODUCTION
Ever since the resurgence of neural networks in the
2010s, there has been much interest in the use of such
architectures for prediction tasks in many different
domains. This is no different in the field of health-
care informatics, which has seen many deep learning
breakthroughs in the last decade (Rav
`
ı et al., 2017).
Given the difficulties of data acquisition and in-
tegration when working with clinical information due
to both technical and security issues (Weitschek et al.,
2013; Thapa and Camtepe, 2021), it is understand-
able that database availability is still very limited.
The most well known such database suitable for deep
learning research is the Physionet MIMIC collec-
tion (Goldberger et al., 2000), in its many editions.
While this resource is very useful, it ultimately re-
flects a specific clinical reality, that of the United
States of America, which is not readily translatable to
the realities of different countries. For this reason, it
is important to also explore other databases and adapt
known approaches to the new data since this may well
lead to unexpected results.
The Brazilian clinical data collection BRATECA
uses data collected by the Brazilian nonprofit orga-
a
https://orcid.org/0000-0003-0656-511X
b
https://orcid.org/0000-0003-2449-5477
c
https://orcid.org/0000-0001-8688-9901
nization NoHarm. That dataset has been released
for credentialed access through Physionet by NoHarm
exclusively for use in research (Consoli et al., 2022).
This collection provides different data in different for-
mats compared to MIMIC, so any technique used on
it must be adapted to the new format.
This work is the first to explore the develop-
ment of clinical prediction test sets from information
present in the BRATECA collection, as well as the
use of these test sets to evaluate and validate feedfor-
ward neural network architectures. Such architectures
are widely used by the literature, and provide good
initial results to which subsequent research may be
compared.
Evaluation and validation are extremely impor-
tant for the development of machine learning models,
and especially so for clinical prediction models. This
work uses the length-of-stay and mortality prediction
tasks because they are relevant to the clinical reali-
ties of Brazilian hospitals, and their advancement is
beneficial to the future of real world AI deployment,
besides being widely used in the health informatics
literature.
This paper is organized into four further sec-
tions: Section 2 presents previous work related to the
tasks and architectures used herein; Section 3 briefly
presents the BRATECA collection; Section 4 presents
the deep neural network architectures used for the pre-
dictions tasks; Section 5 presents the tasks themselves
338
Consoli, B., Vieira, R. and Bordini, R.
Benchmarking the BRATECA Clinical Data Collection for Prediction Tasks.
DOI: 10.5220/0011671400003414
In Proceedings of the 16th International Joint Conference on Biomedical Engineering Systems and Technologies (BIOSTEC 2023) - Volume 5: HEALTHINF, pages 338-345
ISBN: 978-989-758-631-6; ISSN: 2184-4305
Copyright
c
2023 by SCITEPRESS – Science and Technology Publications, Lda. Under CC license (CC BY-NC-ND 4.0)

and the results achieved by each of the architectures
presented in Section 4; and Section 6 presents the con-
clusions derived from the work presented here.
2 RELATED WORK
Since clinical prediction often involves challenging,
high-risk scenarios, proper evaluation and validation
are invaluable in proving a model’s usability in real
scenarios (Yong-ho et al., 2016). This is the case be-
cause building trust in the models is critical for use
in clinical scenarios, and high-quality validation is a
good first step when attempting to show the reliability
of machine learning to those for whom computation is
not their area of expertise, such as medical profession-
als. This makes good test set availability and quality
some of the main priorities when choosing an appro-
priate data collection for training prediction models.
The MIMIC collections, for example, have sev-
eral test sets for each of iteration. Bardhan et al. 2022
and Yue et al. 2020 developed question answering
datasets using data present in the MIMIC-III collec-
tion (Bardhan et al., 2022; Yue et al., 2020), for ex-
ample. The CLIP action item dataset was also cre-
ated from MIMIC-III data (Mullenbach et al., 2021).
These test sets, alongside others, add usability to the
MIMIC-III collection.
BRATECA, released in 2022 (Consoli et al.,
2022), did not have any associated test sets before the
development of the work presented in this paper. This
prompted the development of a base of test sets to be
used in conjunction with the BRATECA collection in
an effort to encourage the use of Brazilian data for
projects focused on Brazilian clinical care and Brazil-
ian Portuguese clinical natural language processing.
3 THE BRATECA COLLECTION
The BRATECA collection is composed of 5 medical
datasets, each containing different kinds of patient in-
formation. These are:
Admission - which contains structured patient de-
tails such as age and sex;
Exam - which contains structured exam results;
Clinical Note - which contains free-text clinical
notes in Brazilian Portuguese;
Prescription - which contains structured patient pre-
scriptions; and
Prescription Item - which is directly related to the
Prescription dataset and details all medication
items of a given prescription.
The columns for each of the three datasets used
in the development of the test sets, Admission, Exam
and Clinical Note, are detailed in Table 1.
All datasets are united by admission and patient
IDs, which allow one to link entries from different
datasets with one another. The collection includes in-
formation from 73,040 admission records of 52,973
unique adults (18 years of age or older) extracted from
10 hospitals located in two Brazilian states. Of these,
only admissions lasting more than 24 hours were con-
sidered for this work, as all tasks required training
with at least the first day’s worth of information. Ad-
ditional information filters are detailed in the specific
task descriptions.
The Exam and Admission datasets provided the
structured data used in the models, while the Clinical
Note dataset provided the free-text data used. Struc-
tured data was processed according to its type, with
numerical data being normalized and categorical data
being one-hot encoded, while free-text data was pro-
cessed using pre-trained BERT models. The Prescrip-
tion datasets were not used in this work since they re-
quire significantly more processing than the others to
be used with any degree of success, and as such be-
came the main subject of a separate thread of research.
The specific information used from structured and
free data is explained in detail in Sections 4.1 and 4.2,
respectively.
4 NEURAL NETWORK
ARCHITECTURES
Four neural network architectures were developed to
accomplish the prediction tasks studied in this work.
These are divided into three categories: one which
utilizes only structured information present in the
Exam and Admission datasets from the BRATECA
collection; one which utilizes only unstructured text
data present in the Clinical Notes dataset from the
BRATECA collection; and two which utilize all three
previously mentioned datasets.
The four network architectures are kept mostly
the same between tasks, with the only change being
the expected output which followed the task being
trained. All architectures (including data transforma-
tions performed on the BRATECA datasets in order
to create input features) are available on this paper’s
GitHub page
1
.
1
https://github.com/bsconsoli/brateca-prediction-tasks
Benchmarking the BRATECA Clinical Data Collection for Prediction Tasks
339
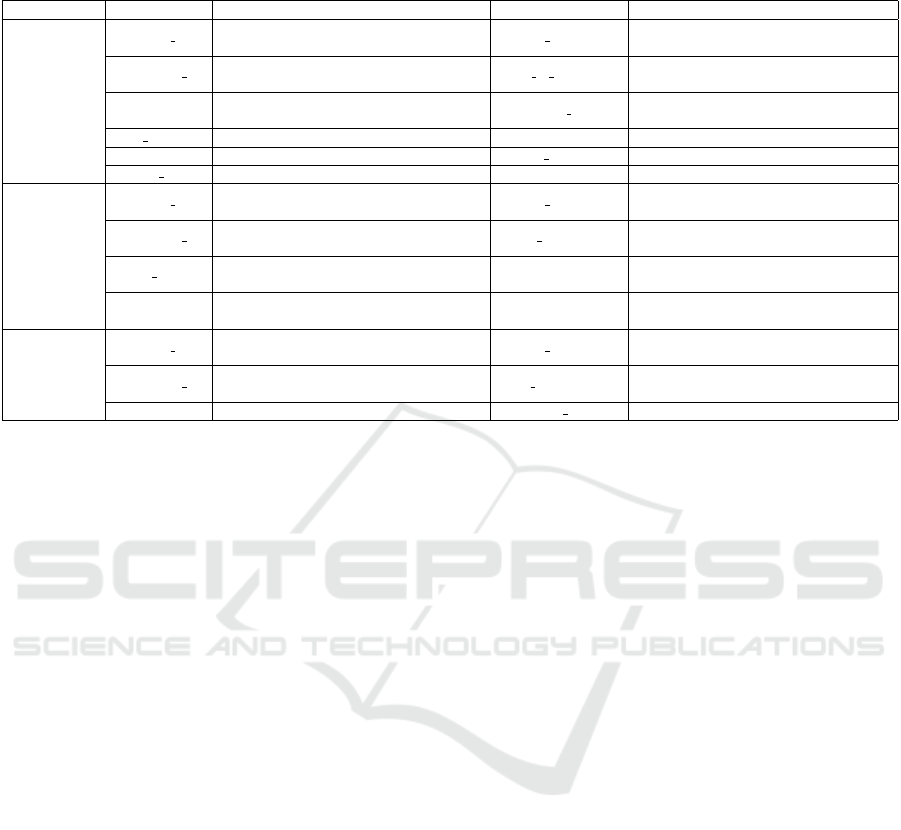
Table 1: Columns and descriptions of columns for the Admission, Exam and Clinical Note datasets. Table excerpt from (Con-
soli et al., 2022).
Dataset Column Description Column Description
Admission
Hospital ID
The identification code for the hospital
from which the data originated.
Patient ID
The identification code for the patient
for whom the admission was registered.
Admission ID
The identification code for the admission
to which the information belongs.
Date of Birth Patient’s date of birth.
Gender Patient’s gender. Admission Date
Date patient was admitted
to hospital.
Skin Color Patient’s skin color. Height Patient’s height.
Weight Patient’s weight. Height Date Date patient’s height was measured.
Weight Date Date the patient was weighted.
Exam
Hospital ID
The identification code for the hospital
from which the data originated.
Patient ID
The identification code for the patient
for whom the admission was registered.
Admission ID
The identification code for the admission
to which the information belongs.
Exam Name
Name of the exam that was
performed.
Exam Date Date the exam was performed Value
Numerical value of the result
of the exam.
Unit
Unit of measurement the exam’s
Value is in.
Clinical Note
Hospital ID
The identification code for the hospital
from which the data originated.
Patient ID
The identification code for the patient
for whom the admission was registered.
Admission ID
The identification code for the admission
to which the information belongs.
Note Date Date the note was written.
Note Text The contents of the note. Notetaker Position Notetaker’s job title.
4.1 Structured Data Architecture
This architecture receives input features solely from
the Exam and Admission datasets of BRATECA, as
previously stated. The features include: patient age
(normalized), skin color (one-hot encoded), sex (one-
hot encoded) from the Admission dataset; and an ar-
ray of all 103 exam results, where all exams that
have not been performed on a patient being entered
as 0 (zero) and those that have been performed be-
ing entered as the result (normalized) from the Exam
dataset.
For all tasks, a begin and end date was set when
mining input data (e.g. only data produced within the
first day of admission would be considered), as ex-
plained in Section 5, and only the most recent results
were considered for each exam feature when the same
exam was performed multiple times within the speci-
fied time frame.
All but one of the dense layers use ReLU acti-
vation, while the final layer uses sigmoid activation
to predict between the two classes of the presented
tasks. The specifics for each layer can be found on
the project’s GitHub page.
4.2 Free-Text Architecture
This architecture receives clinical notes in a free-text
format. All clinical notes within the task’s input col-
lection time frame are merged into a single document
before processing.
The text was processed with BioBERTpt (Schnei-
der et al., 2020), a BERT-based (Devlin et al., 2019)
model trained on clinical and biomedical texts written
in Brazilian Protuguese. The BERT output was then
used to produce a classification with LSTM and dense
layers.
It receives token and masked layers for BERT
and passes the BERT output through a bidirectional
LSTM before using a 1D max pooling layer to adapt
the data for dense layers. All but one of the dense lay-
ers use ReLU activation, while the the final layer uses
sigmoid activation to predict between the two classes
of the given tasks. The specifics for each layer can be
found on the project’s GitHub page.
4.3 Merged Architecture
This architecture receives all collected data from
BRATECA, including Exam, Admission and Clinical
Notes. The structured data from Exams and Admis-
sions is processed separately from the free-text data of
the Clinical Notes at first, but are eventually concate-
nated. The concatenated vector is further processed
and then used to produce the output.
The structured data was processed using the same
methods as described in the structured-data architec-
ture presented in Section 4.1, while the free-text data
was processed using the same methods as described in
the Free-Text Architecture presented in Section 4.2.
It begins with two input branches. These are the
same as the free-text and structured data architectures
until the concatenation layer, which happens just be-
fore the sigmoid-activated layers of both the previous
HEALTHINF 2023 - 16th International Conference on Health Informatics
340

architectures. The concatenated vectors are then used
in further dense layers, which end in a new sigmoid-
activated dense layer.
4.4 Vote Architecture
This architecture is initially the same as the merged
architecture presented in Section 4.3. However, rather
than merging hidden layer vectors and using the re-
sulting concatenated vector in further processing, the
structured data and text data are separately used to de-
termine “votes” for classification through the use of a
sigmoid-activated dense layer. These two votes are
then used to determine the final output.
As previously mentioned, this architecture is the
same as the merged architecture, but at the end of
the branches, just before the concatenation, the ar-
chitecture has sigmoid-activated dense layers, which
can be taken to be the individual predictions for each
branch. These are then concatenated and used in a
third sigmoid-activated layer to achieve the final pre-
diction.
5 TASKS AND RESULTS
Two kinds of tasks were prepared from the
BRATECA datasets: length-of-stay classification and
mortality classification. Test sets were prepared for
these tasks and the architectures discussed in Sec-
tion 4 were adapted to the required inputs and outputs
of each test set.
All models were trained for up to 50 epochs. The
model for the epoch with the best validation loss score
was kept. These models are also available on the
project’s GitHub page. The models were evaluated
by extracting the following metrics: Precision, Recall
and F1 at the 0.5 threshold, to complement the 0.5
threshold confusion matrices analyzed in this section;
AUPRC, to better analyze the unbalanced (i.e., pro-
portional) test set; and AUROC, to better analyze the
balanced test set.
Since the test sets were derived from limited-
access data, only the code for recreating them and in-
structions on how to use that code have been made
available on this project’s GitHub page. Thus, ac-
quiring access to the BRATECA collection through
Physionet is required to recreate these test sets and to
reproduce the results in this paper.
5.1 Length-of-Stay Task
The length-of-stay (LoS) classification task requires
a model to determine whether an admission will ex-
ceed the length of 7 days. To make this prediction,
the model has access to data from the first 24 hours of
admission.
This test set is composed of 32,159 admissions of
patients who stayed at least 24 hours in hospital. Of
these admissions, 10,495 were of patients who were
hospitalized for more than 7 days, henceforth consid-
ered to be the positive class, and 21,664 were of pa-
tients who were hospitalized for less than or equal to
7 days, henceforth considered to be the negative class.
This means that proportionally, for every patient who
exceeds 7 days of hospitalization, 2.06 patients are
hospitalized for less than or equal to 7 days. For the
purposes of balancing the test set, 10,495 examples of
each category were randomly selected for the test set
and the remainder were initially discarded.
The test set was divided into three parts: training,
composed of 70% of all examples; testing, composed
of 20% of all examples; and validation, composed of
10% of all examples. This left the training set with
7,346 examples of each category, the test set with
2,099 examples of each category and the validation
set with 1,050 examples of each category.
Another version of the test set was created, how-
ever, which maintained the original 2.06:1 proportion.
This alternative set had 6,423 examples for testing. It
used the balanced test set as a base, with the addition
of examples from the initially discarded ’less than or
equal to 7 days of hospitalization’ examples in order
to reach the desired proportion. This set will be re-
ferred to as ’Proportional’, while the first will be re-
ferred to as ’Balanced’. Regardless of the kind of set
used for testing, the models were always trained and
validated using a balanced set.
As can be seen in Table 2, the best results were
achieved by the free-text architecture. The structured
architecture was significantly worse than the rest, and
the use of structured data in the merge and vote archi-
tectures only worsened the results, if slightly.
The AUPRC score drops significantly when com-
paring the balanced test set to the proportional test set.
This reveals that in a more realistic scenario, the mod-
els do not perform as well as in a balanced scenario.
Overall, the tests show that the unstructured free-
text information is meaningfully helpful when at-
tempting to predict whether admissions will be of
short or long length. The structured exam data did
not help, and at times seemed to hinder the models
in this task, which points to either the need for better
data integration when creating inputs, or that exam
and admission data are wholly unhelpful for this task.
Further tests are needed to discern which of these pos-
sibilities is the case.
As for the individual architectures, the structured
Benchmarking the BRATECA Clinical Data Collection for Prediction Tasks
341
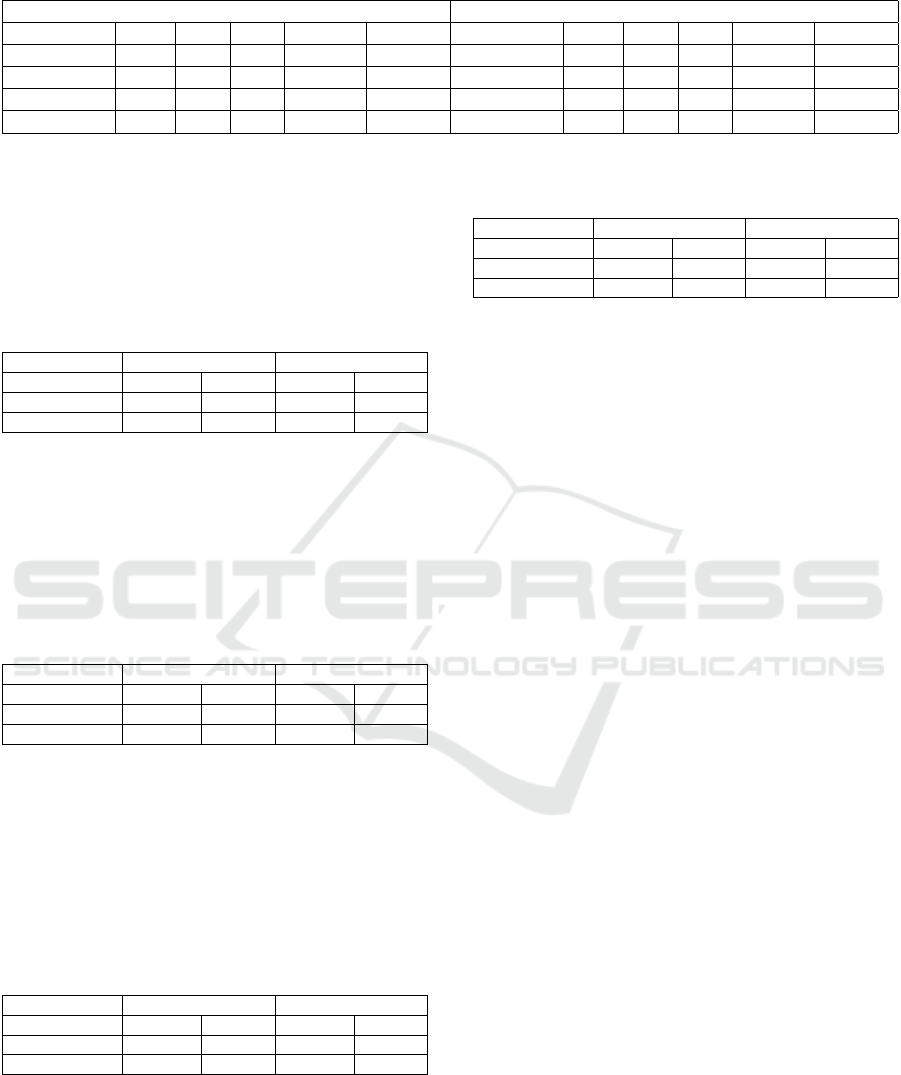
Table 2: Results for all tests and architectures in the length-of-stay task.
Balanced Test Set Proportional Test Set
Architecture Prec. Rec. F1 AUPRC AUROC Architecture Prec. Rec. F1 AUPRC AUROC
Structured
0.60 0.52 0.56 0.60 0.64
Structured
0.41 0.52 0.46 0.40 0.62
Free-text
0.72 0.73 0.72 0.76 0.80
Free-text
0.49 0.73 0.58 0.55 0.75
Merged
0.68 0.84 0.75 0.72 0.78
Merged
0.48 0.84 0.61 0.49 0.74
Vote
0.71 0.70 0.70 0.68 0.74
Vote
0.50 0.70 0.58 0.48 0.72
data architecture achieved poor f-scores when com-
pared to the rest of the architectures. Table 3 shows a
proportionally large amount of false negatives, which
indicates it only weakly learned to predict the positive
class.
Table 3: Structured data confusion matrices for balanced
and proportional length-of-stay test sets.
Test Sets Balanced Proportional
Predictions Negative Positive Negative Positive
Negative Truth 1362 737 2727 1597
Positive Truth 1000 1099 1000 1099
The free-text architecture performed best overall.
Like the other architectures, it performed poorly in the
proportional test set, but had the best overall AUPRC
score despite having a middling f-score at the 0.5
threshold. Table 4 shows a relatively high number of
false negatives, which affected recall at that threshold.
Table 4: Free-text confusion matrices for balanced and pro-
portional length-of-stay test sets.
Test Sets Balanced Proportional
Predictions Negative Positive Negative Positive
Negative Truth 1498 601 2727 1597
Positive Truth 574 1525 574 1525
The merged architecture achieved similar results
to the free architecture in the balanced test set, as per
the AUROC score. Despite having a better f-score at
the 0.5 threshold, the AUPCR for the proportional test
set was considerably lower than the free-text architec-
ture. Table 5 shows overall better predictions for the
positive class, explaining the better f-score.
Table 5: Merge model confusion matrices for balanced and
proportional length-of-stay test sets.
Test Sets Balanced Proportional
Predictions Negative Positive Negative Positive
Negative Truth 1274 825 2383 1941
Positive Truth 328 1771 328 1771
The vote architecture performed quite similarly to
the merged architecture. Table 6 shows somewhat
worse results for the 0.5 threshold, but the AUROC
and AUPRC show the similarity of the models for the
balanced and proportional test sets respectively.
Table 6: Vote model confusion matrices for balanced and
proportional length-of-stay test sets.
Test Sets Balanced Proportional
Predictions Negative Positive Negative Positive
Negative Truth 1492 607 2857 1467
Positive Truth 630 1469 630 1469
In summary, the free-text, merged and vote archi-
tectures achieved very similar results, though the free-
text architecture can generally be considered to be the
best for this task. The structured data architecture,
meanwhile, failed to achieve comparable results. This
makes it clear that, for the task of length-of-stay pre-
diction using these architectures, the free-text clinical
notes are more meaningful. Structured data by itself
failed to achieve good results, and failed to add value
when combined with free-text data. Our leading hy-
pothesis for why this is the case is that the way the in-
put is merged is inefficient, and must be accomplished
in a more integrated manner.
5.2 Mortality Task
The mortality classification task requires a model to
determine whether or not the outcome of an admis-
sion will be the death of the patient. To make this
prediction, the model has access to data from the first
24 hours of admission.
This test set is composed of 16,285 unique ad-
missions. Of these, 1,508 were of admissions that
resulted in death, henceforth referred to as the pos-
itive class, and 14,777 were of admissions that re-
sulted in discharge, henceforth referred to as the neg-
ative class. This means that there are approximately
10 discharges for every death in the test set. For the
purposes of balancing 1,508 examples of each cate-
gory were randomly selected for training and testing
the models while the rest were initially discarded. It
should be noted that the BRATECA collection pos-
sesses several classes detailing slightly different kinds
of discharge and death procedures, but all of these
were unified into the two classes presented previously.
The test set was divided into three parts: training,
composed of 70% of all examples; testing, composed
of 20% of all examples; and validation, composed of
10% of all examples. This left the training set with
HEALTHINF 2023 - 16th International Conference on Health Informatics
342
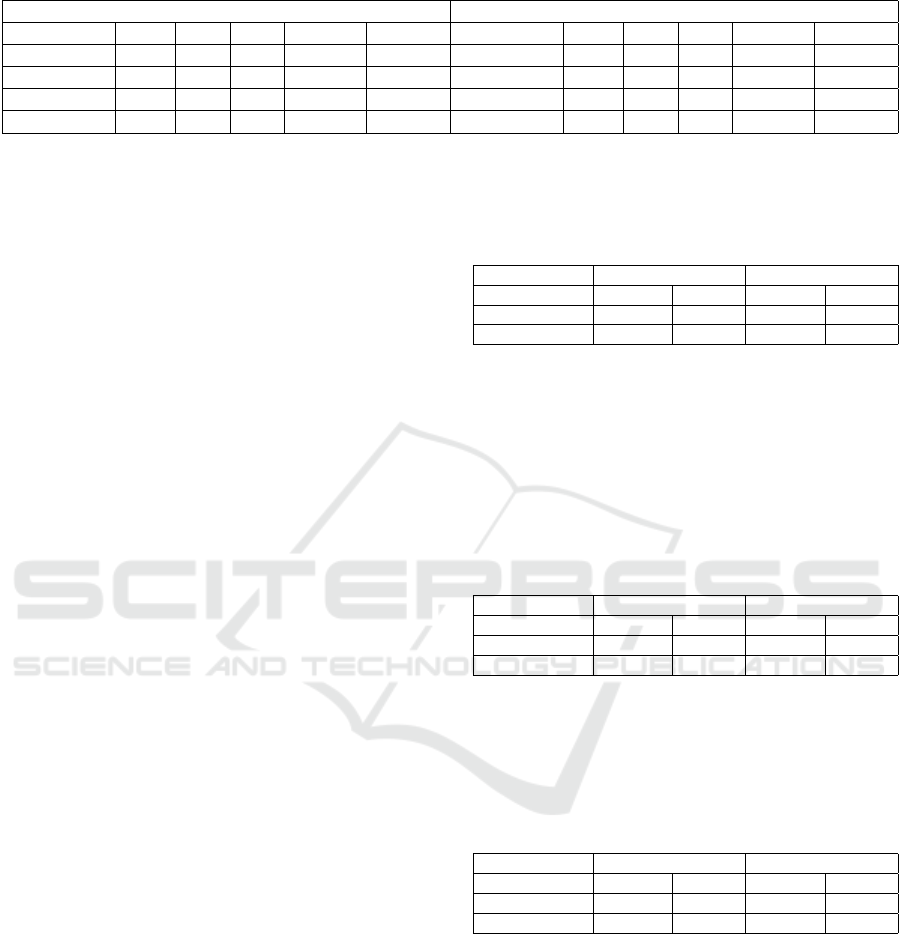
Table 7: Results for all tests and architectures in the mortality task.
Balanced Test Set Proportional Test Set
Architecture Prec. Rec. F1 AUPRC AUROC Architecture Prec. Rec. F1 AUPRC AUROC
Structured
0.61 0.30 0.40 0.59 0.59
Structured
0.14 0.30 0.19 0.14 0.59
Free-text
0.76 0.65 0.70 0.79 0.75
Free-text
0.22 0.65 0.33 0.37 0.76
Merged
0.78 0.71 0.74 0.82 0.81
Merged
0.23 0.71 0.34 0.41 0.80
Vote
0.39 0.05 0.09 0.53 0.57
Vote
0.04 0.05 0.04 0.08 0.44
1,056 examples of each category, the test set with 301
examples of each category and the validation set with
151 examples of each category.
Another version of the test set was created which
maintained the 10:1 proportion found originally. This
alternative set had 3010 discharge examples and 301
death examples. It used the balanced test set as a base,
with the addition of examples from the initially dis-
carded ‘discharge’ examples in order to reach the de-
sired proportion. This set will be referred to as ’Pro-
portional’, while the first will be referred to as ’Bal-
anced’. Regardless of the kind of set used for testing,
the models were always trained and validated with a
balanced set.
Table 7 shows the results of both test sets for each
architecture in the mortality task. The merged ar-
chitecture showed the best results, achieving the best
AUROC and AUPRC scores for balanced and propor-
tional test sets, respectively. While the free-text archi-
tecture achieved similar, if slightly lower, scores to the
best architecture, the structured and vote architectures
achieved much lower scores across the board.
The sharp AUPRC score drop when comparing
the balanced and proportional test set results is the
most noticeable aspect of this task. The large addi-
tion of negative class examples to the proportional test
set clearly negatively affected precision scores for all
models. This reveals that the balanced results do not
account for how poorly the models fair in an envi-
ronment which simulates the imbalance found in real
clinical scenarios.
The text information proved to be the most mean-
ingful when attempting to predict mortality. The
structured information, by itself, provided no mean-
ingful results. This is believed to be the case because
of a general lack of training data, which dispropor-
tionately affected the structured data over the text data
because there is much more text data than structured
data per admission.
The structured model performed rather poorly
even in the balanced test set. Overall, the results seem
to indicate that the structured data alone is not enough
to train a model for this task. This may have been
caused by a lack of training examples. The confusion
matrix, as presented in Table 8, shows that the model
tends to produce many false negatives proportionally
to true positives, which explains these results.
Table 8: Structured model confusion matrices for balanced
and proportional mortality test sets.
Test Sets Balanced Proportional
Predictions Negative Positive Negative Positive
Negative Truth 243 58 2428 583
Positive Truth 210 91 210 91
The free-text model reached the second best re-
sults for this task. The model shows that free-text data
is much richer in useful information than the struc-
tured data. Still, it only performed marginally better
in the proportional test set. The additional false pos-
itives in the proportional test set, as seen in Table 9,
decreased the precision by a considerable margin.
Table 9: Free-text model confusion matrices for balanced
and proportional mortality test sets.
Test Sets Balanced Proportional
Predictions Negative Positive Negative Positive
Negative Truth 238 63 2330 681
Positive Truth 104 197 104 197
The merged model achieved similar results to the
free-text model, tough slightly higher overall. The
confusion matrix, as seen in Table 10, is also quite
similar to that of the free-text model.
Table 10: Merged model confusion matrices for balanced
and proportional mortality test sets.
Test Sets Balanced Proportional
Predictions Negative Positive Negative Positive
Negative Truth 240 61 2302 708
Positive Truth 88 213 88 213
The vote model, unlike the merge model, shows
very poor performance in both test sets. The addition
of the structured architecture branch seems to have
made training more difficult overall, and given the al-
ready lacking number of examples, the model appears
to have been unable to learn properly.
In summary, for the balanced test set the merged
architecture managed to obtain useful information
from the structured data by merging it with the text
data using dense layers, whereas the vote architecture
did not. This is believed to be so because the output
Benchmarking the BRATECA Clinical Data Collection for Prediction Tasks
343

Table 11: Vote model confusion matrices for balanced and
proportional mortality test sets.
Test Sets Balanced Proportional
Predictions Negative Positive Negative Positive
Negative Truth 276 25 2586 425
Positive Truth 285 16 285 16
predictions from the structured architecture were not
learned correctly by the model and thus only muddled
the backpropagation process of the model. None of
the models performed particularly well in the propor-
tional test set, as shown by the rather poor AUPRC
scores, which is more representative for unbalanced
test sets than AUROC, which tends to be too opti-
mistic in these situations.
5.3 Overall Discussion
The tests performed for the mortality and LoS tasks
in this work revealed several aspects pertaining to the
usage of the BRATECA dataset for the improvement
of clinical prediction tasks on clinical notes written
in Brazilian Portuguese. They confirm that the text
data retrieved from the medical records is extremely
rich in meaning and can be used to train fairly accu-
rate mortality prediction models. It also shows that
the structured data recovered from BRATECA is best
used as an addition to text data rather than to provide
predictions by themselves.
Our work also revealed the large difference be-
tween results acquired from a balanced test set against
those acquired from proportional test sets. This fact
becomes especially important when the end goal of
such research is to be used in decision support sys-
tems in hospitals to help both patients and medical
professionals in real-world scenarios.
The lower results in the mortality task also con-
firm that the ever-present struggle to acquire task-
relevant training data can be very problematic espe-
cially when dealing with highly unbalanced datasets.
This only strengthens the claims that data sharing and
cooperation between researchers and hospitals is of
utmost important to the development of better medi-
cal AI models.
We also found that the integration between struc-
tured and unstructured data is an active and relevant
avenue of research when dealing with medical data,
which is often composed of various heterogeneous
parts each of which requires specialized processing.
This is an incentive to the development of input vec-
tors that can be better used by machine learning ar-
chitectures to solve clinical tasks. This new kind of
holistic input representation will also require new ar-
chitectures to more accurately learn predictions in an
unbalanced environment.
6 CONCLUSIONS
This work showed the effectiveness of simple neural
network models in common clinical tasks created us-
ing data from the Brazilian Portuguese clinical infor-
mation collection BRATECA, as well as their lim-
itations. The tasks addressed in this research can
serve as baselines when testing more advanced deep-
learning architectures in this domain.
The work has also served to form the base of an
ongoing effort to develop test sets for the BRATECA
collection that will be expanded upon in future. These
tasks and the results of preliminary tests such as those
presented in this paper will enable other members of
the community interested in working with Brazilian
data to more easily compare results between differ-
ent teams. This is especially relevant to the field of
computational medicine since most research is per-
formed using data that cannot be easily shared among
the community and as such suffers when it comes to
reproduction and comparison. The test sets that have
been made available are as follows: a length-of-stay
prediction test set annotated for whether the admis-
sion lasted more or less than 7 days based on the first
24 hours; and a mortality prediction test set annotated
for whether an admission ended in discharge or death
based on the first 24 hours. These are both available
on our GitHub page.
Future work will thus focus on expanding the
test sets, creating new ones, and creating baselines
for them. Alongside that work, the development of
new neural-network architectures for clinical predic-
tion tasks will also be a priority, as specializing archi-
tectures to work within the realities of this domain is
paramount to successful deployment of AI solutions
into hospital environments.
ACKNOWLEDGEMENTS
The authors acknowledge the High-Performance
Computing Laboratory of the Pontifical Catholic Uni-
versity of Rio Grande do Sul (LAD-IDEIA/PUCRS,
Brazil) for providing support and technological re-
sources, which have contributed to the development
of this project and to the results reported in this paper.
We also gratefully acknowledge partial finan-
cial support by CNPq, CAPES, the FAPERGS
funded CIARS innovation network, the FAPESP
and FAPEMIG funded CIIA-Health innovation
centre, and the FCT (Portugal) under project
UIDB/00057/2020.
HEALTHINF 2023 - 16th International Conference on Health Informatics
344

REFERENCES
Bardhan, J., Colas, A., Roberts, K., and Wang, D. Z. (2022).
Drugehrqa: A question answering dataset on struc-
tured and unstructured electronic health records for
medicine related queries. PhysioNet.
Consoli, B., Dias, H., Ulbrich, A., Vieira, R., and Bordini,
R. (2022). Brateca (brazilian tertiary care dataset):
a clinical information dataset for the portuguese lan-
guage. In Proceedings of the 13th Conference on Lan-
guage Resources and Evaluation, page 5609–5616.
Devlin, J., Chang, M., Lee, K., and Toutanova, K. (2019).
BERT: pre-training of deep bidirectional transformers
for language understanding. In Burstein, J., Doran,
C., and Solorio, T., editors, Proceedings of the 2019
Conference of the North American Chapter of the As-
sociation for Computational Linguistics: Human Lan-
guage Technologies, NAACL-HLT 2019, Minneapolis,
MN, USA, June 2-7, 2019, Volume 1 (Long and Short
Papers), pages 4171–4186. Association for Computa-
tional Linguistics.
Goldberger, A. L., Amaral, L. A., Glass, L., Hausdorff,
J. M., Ivanov, P. C., Mark, R. G., Mietus, J. E., Moody,
G. B., Peng, C.-K., and Stanley, H. E. (2000). Phys-
iobank, physiotoolkit, and physionet: components of
a new research resource for complex physiologic sig-
nals. Circulation, 101(23):e215–e220.
Mullenbach, J., Pruksachatkun, Y., A., S., Seale, J., Swartz,
J., McKelvey, T. G., Yang, Y., and Sontag, D. (2021).
Clip: A dataset for extracting action items for physi-
cians from hospital discharge notes. PhysioNet.
Rav
`
ı, D., Wong, C., Deligianni, F., Berthelot, M., Andreu-
Perez, J., Lo, B., and Yang, G.-Z. (2017). Deep learn-
ing for health informatics. IEEE Journal of Biomedi-
cal and Health Informatics, 21(1):4–21.
Schneider, E. T. R., de Souza, J. V. A., Knafou, J., Oliveira,
L. E. S. e., Copara, J., Gumiel, Y. B., Oliveira, L.
F. A. d., Paraiso, E. C., Teodoro, D., and Barra, C.
M. C. M. (2020). BioBERTpt - a Portuguese neural
language model for clinical named entity recognition.
In Proceedings of the 3rd Clinical Natural Language
Processing Workshop, pages 65–72, Online. Associa-
tion for Computational Linguistics.
Thapa, C. and Camtepe, S. (2021). Precision health data:
Requirements, challenges and existing techniques for
data security and privacy. Computers in Biology and
Medicine, 129:104130.
Weitschek, E., Felici, G., and Bertolazzi, P. (2013). Clinical
data mining: Problems, pitfalls and solutions. In 2013
24th International Workshop on Database and Expert
Systems Applications, pages 90–94.
Yong-ho, L., Heejung, B., and Jung, K. D. (2016). How to
establish clinical prediction models. enm, 31(1):38–
44.
Yue, X., Zhang, X. F., Yao, Z., Lin, S., and Sun, H. (2020).
Cliniqg4qa: Generating diverse questions for domain
adaptation of clinical question answering. arXiv.
Benchmarking the BRATECA Clinical Data Collection for Prediction Tasks
345
