
Prediction of Thyroid Malignancy Using Contextual Semantic
Interpretability from Sonograms
Ahana Roy Choudhury
1 a
, Radu Paul Mihail
1 b
and Sorin Dan Chiriac
2
1
Department of Computer Science, Valdosta State University, Valdosta, U.S.A.
2
University of Medicine and Pharmacy “Victor Babes” Timisoara, Romania
Keywords:
Thyroid Cancer, Thyroid Nodule, Classification, Convolutional Neural Networks, Explainable AI,
Interpretability.
Abstract:
The gold standard in thyroid nodule malignancy diagnosis consists of ultrasound (US or sonogram) guided fine
needle aspiration biopsy. This procedure is ordered based on an assessment of malignancy risk by a trained
radiologist, who uses US images and relies on experience and heuristics that are difficult to effectively system-
atize into a working algorithm. Artificial Intelligence (AI) methods for malignancy detection in sonograms
are designed to either perform segmentation (highlight entire thyroid gland and/or nodule) or output a proba-
bility of malignancy. There is a gap between AI methods trained to perform a specific task using a black-box
method, and the sonogram features (e.g.,: shape, size, echogenicity, echotexture) that a radiologist looks at.
We aim to bridge this gap, using AI to reveal saliency in sonograms for features that are easily understood
by clinicians. We propose a deep-learning model that performs two tasks important to radiologists: sonogram
feature saliency detection, as well as probability of malignancy. We perform both a quantitative and qualitative
evaluation of our method using an open dataset, the Thyroid Digital Image Database (TDID). Our framework
achieves 72% accuracy in the task of classifying thyroid nodules as benign or malignant.
1 INTRODUCTION
Thyroid cancer cases have been on a rising trend
worldwide at a rate of around 3% yearly increase
in incidence, doubling every 30 years (Morris et al.,
2013). While this increase may be attributed to bet-
ter access to care, it is significant, and early detection
leads to better outcomes and increased 5-year survival
rates (Siegel et al., 2019). The most commonly used
imaging modality for the thyroid is ultrasound, which
is non-invasive, fast and relatively inexpensive. Usu-
ally, an initial malignancy risk evaluation is done for
thyroid nodules, based on the sonogram features.
The American College of Radiology (ACR) as-
sembled committees to develop a standardized risk-
stratification system. The committees’ goals were
to develop management guidelines for incidentally
discovered nodules, produce a lexicon for sonogram
nodule description, and to develop a scoring system,
named TI-RADS (Tessler et al., 2017).
The TI-RADS system observes five sonogram fea-
a
https://orcid.org/0000-0001-9846-2665
b
https://orcid.org/0000-0002-3682-3485
ture categories. Each category contains attributes that
receive a number of points to be added into a final
score. The higher the final score (TR1 through TR5),
the higher the risk of malignancy. This scoring sys-
tem is useful to guide further clinical actions, such as
watchful-waiting or fine-needle aspiration (FNA).The
point system is defined as follows:
• Composition of the nodule. Cystic and spongi-
form compositions receive no points. Mixed cys-
tic and solid receive one point, while solid or al-
most completely solid receive two points.
• Echogenicity refers to a tissue’s ability to bounce
an echo from the probe. Anechoic tissues receive
zero points. Hyperechoic and isoechoic tissues re-
ceive one point each. Hypoechoic or very hypoe-
choic echoes receive two and three points, respec-
tively.
• Shape refers to the orientation of a mostly el-
liptical nodule in a sagittal and transverse sono-
gram. A nodule that is wider-than-tall receives
zero points, while a nodule that is taller than wide
receives three points.
• Margins refers to the edges of the nodule. Ill-
94
Choudhury, A., Mihail, R. and Chiriac, S.
Prediction of Thyroid Malignancy Using Contextual Semantic Interpretability from Sonograms.
DOI: 10.5220/0011670900003414
In Proceedings of the 16th International Joint Conference on Biomedical Engineering Systems and Technologies (BIOSTEC 2023) - Volume 2: BIOIMAGING, pages 94-101
ISBN: 978-989-758-631-6; ISSN: 2184-4305
Copyright
c
2023 by SCITEPRESS – Science and Technology Publications, Lda. Under CC license (CC BY-NC-ND 4.0)
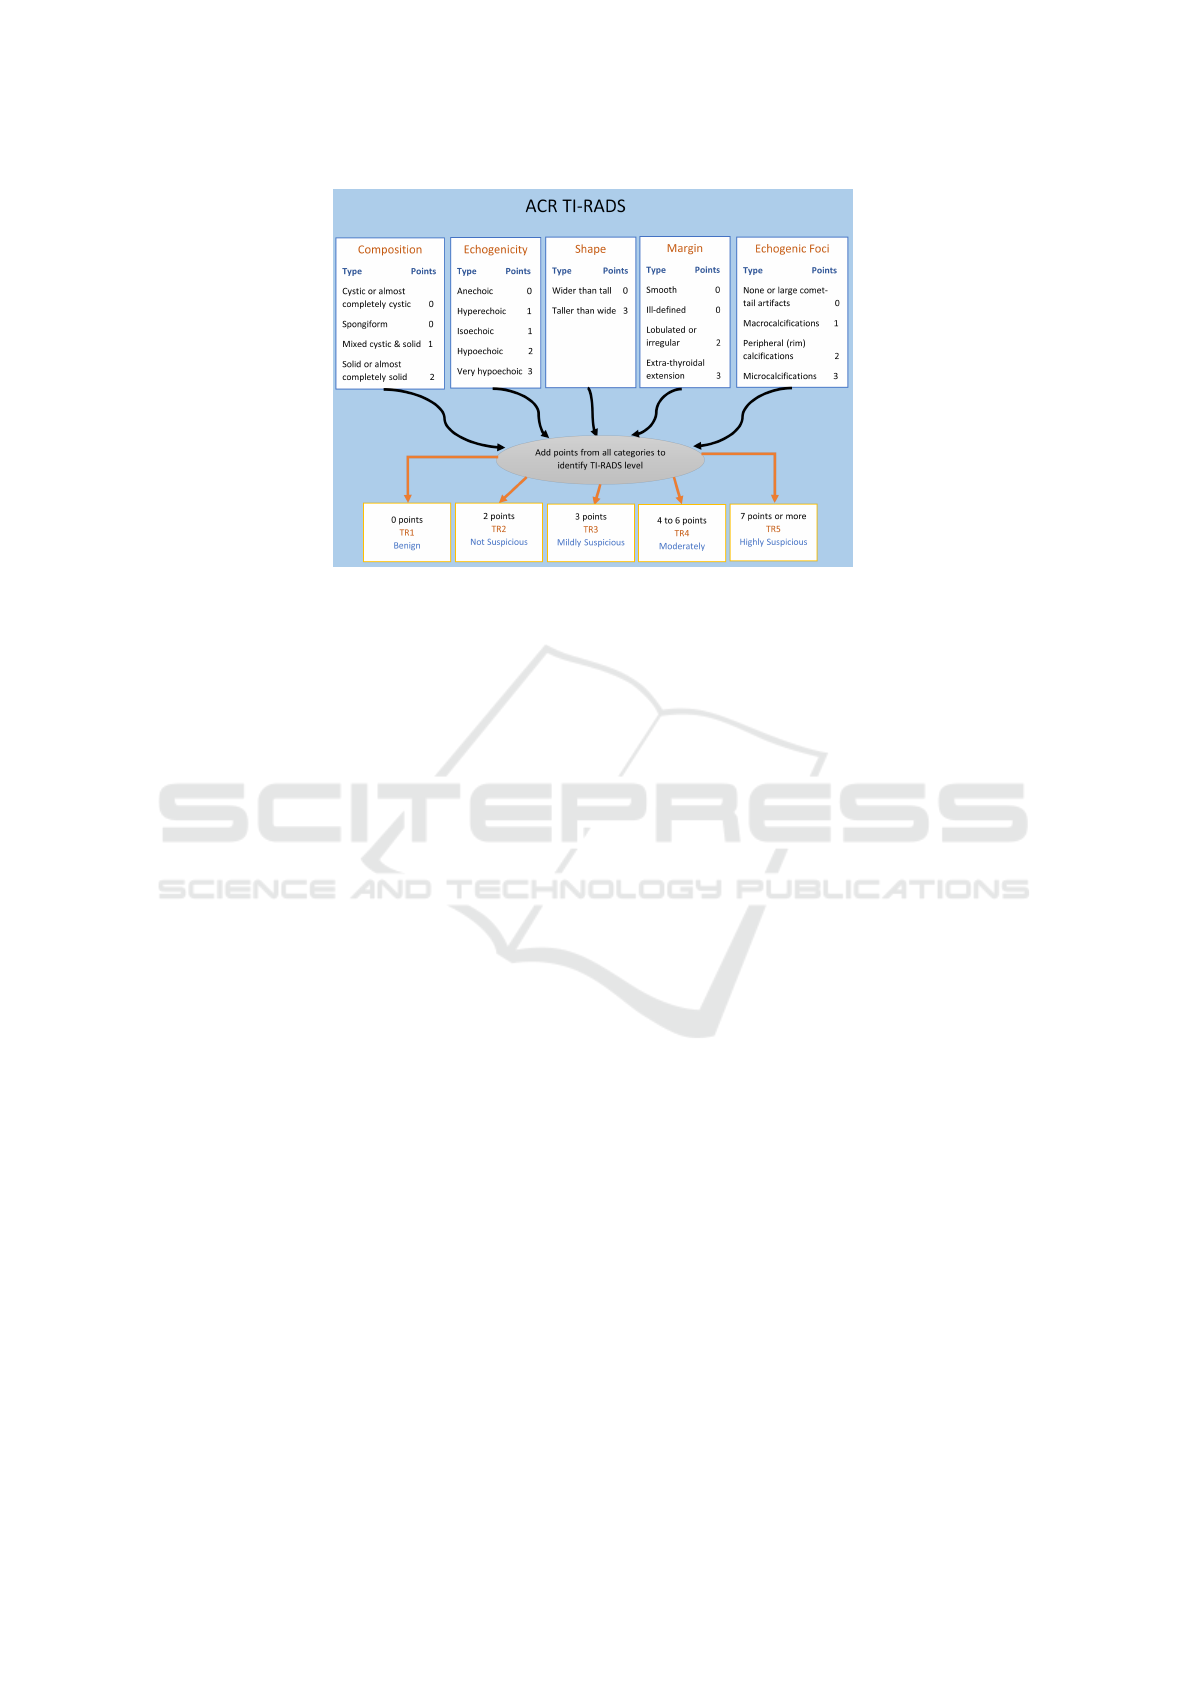
Figure 1: American College of Radiology (ACR) TI-RADS thyroid nodule scoring system. Points are assigned for features
belonging to five categories: composition, echogenicity, shape, margin and echogenic foci. The points are added for each
category, and the resulting point count is used to assess malignancy risk (the higher the point count, the higher the risk)
defined or smooth margins receive zero points.
Lobulated margins receive two points. When ex-
tensions outside of the thyroid are observed, it is
highly indicative of malignancy and this feature
receives three points.
• Echogenic foci refer to bright spots seen on a
sonogram. These can be not present, or very large
V-shaped and receive zero points. Macrocalcifica-
tions receive 1 point. If foci are observed periph-
erally, this receives 2 points. Microcalcifications
receive the highest score of three.
Existing work in the medical image analysis lit-
erature focuses heavily on providing additional auto-
mated diagnostic tools whose goal is to assist clini-
cians in their decision making processes. These sys-
tems are functionally black-box approaches, such as
deep convolutional neural networks (CNNs, along
with their many variants) that take images and meta-
data as the inputs and produce a probability of malig-
nancy, a score or a combination thereof. These exist-
ing systems can easily generate an answer to what?
but little attention has been given to the why?
Our work, inspired in part by (Marcos et al.,
2020), focuses on a method to help humans under-
stand the why? in decisions made by highly complex
multi-billion parameter models. Our primary contri-
bution is a method that automatically produces a hu-
man understandable explanation for a decision made
by a complex system. We achieve this by explicitly
modeling contextual information as defined by TI-
RADS, and automatically discovering features that
are meaningful to predict malignancy when linearly
combined into a final score.
In this paper, we use the Thyroid Digital Image
Database (TDID) (Pedraza et al., 2015) for our ex-
periments. We propose a technique for the predic-
tion of features or attributes of thyroid nodules from
sonograms using deep learning. These features are
then used to make interpretable predictions about the
possibility of malignancy for a given thyroid nodule.
Thus, the predicted features and the proposed frame-
work provide insights into why a thyroid nodule is
predicted as benign or malignant.
2 RELATED WORK
The recent successes of artificial intelligence (AI) sys-
tems has made it possible to design and implement
various systems. However, their results are often dif-
ficult to interpret leading to mistrust . “Explainable
Artificial Intelligence” or xAI is a field that aims to
bridge this gap by developing methods that try to
make the output of AI algorithms understandable.
eXplainable AI. A common distinction in xAI
methods is made on the basis of the timing with
respect to training at which explainability is imple-
mented (Speith, 2022). Ante-hoc methods are applied
before training while post-hoc methods, like ours, rely
on either pre-trained or end-to-end trained DNN mod-
els and generate explanations for a non-interpretable,
black box model.
Among post-hoc methods for explanations,
saliency-based methods (Simonyan et al., 2013)
assign an importance to each pixel with respect to
Prediction of Thyroid Malignancy Using Contextual Semantic Interpretability from Sonograms
95

the image’s predicted class. Saliency-based methods
are often unreliable due to highlighting edges in
images (Rudin, 2019).
Class Activation Maps for Explainability. In ad-
dition to the above techniques, Class Activation Map-
ping (CAM) is widely used to improve the ex-
plainability of CNN models. The method proposed
by (Zhou et al., 2015) uses the features output from
the final convolution layer to determine the impor-
tant parts of an image that were identified by a CNN
for classification. Gradient-weighted Class Activa-
tion Mapping (Grad-CAM) (Selvaraju et al., 2019)
and GradCAM++ (Chattopadhay et al., 2018), use the
gradients of a target to produce a localization map.
Ablation-CAM (Desai and Ramaswamy, 2020) uses
ablation studies to identify weights of individual fea-
ture maps for a specific class. Score-CAM (Wang
et al., 2019) uses the global contribution of the cor-
responding input features. While SS-CAM (Wang
et al., 2020) introduces smoothing to Score-CAM,
producing sharper visualization and localization, IS-
CAM (Naidu et al., 2020) introduces the use of inte-
gration in Score-CAM to generate sharper activation
maps.
Thyroid Ultrasound. Wu et al. (Wu et al., 2016)
showed echogenicity to be an important predictor of
malignancy while Alexander et al. (Alexander et al.,
2004) showed that spherical shape is associate with
an increased rate of malignancy in solid nodules.
Thus, the diagnosis of whether a thyroid nodule is
benign or malignant depends on a combination of fea-
tures (attributes). There have been several attempts to
directly classify sonograms of thyroid nodules as be-
nign or malignant (Kwon et al., 2020) (Wang et al.,
2022) (Koh et al., 2020a) (Liang et al., 2020), and
some techniques use features extracted from CNNs to
perform the classification using a separate model (Chi
et al., 2017) (Lee et al., 2019). However, the use
of post-hoc xAI and concept bottlenecks (Koh et al.,
2020b) to identify and verify the relation of features
or attributes such as echogenicity, margins, and com-
position in the automatic classification of thyroid nod-
ules as benign or malignant has not been explored.
3 PROPOSED METHOD
3.1 Data
The Thyroid Digital Image Database (Pedraza et al.,
2015) consists of 65 thyroid sonograms confirmed
malignant and 33 sonograms of benign cases. Each
image is annotated by a radiologist and contains clas-
sifications with respect to composition, echogenicity,
margins, and calcifications. With respect to composi-
tion, the nodules are classified as cystic, spongiform
in appearance, predominantly solid, or solid. With re-
spect to echogenicity nodules are classified as hypoe-
chogenic, hyperechogenic, marked hypoechogenic or
isoechogenic. In terms of margins, the categories
are ill-defined, micro-lobulated, spiculated or well-
defined smooth. Finally, the types of calcifications are
micro-calcifications, macro-calcifications or no calci-
fications. Besides, each image is is classified as be-
nign or malignant. We randomly split the dataset of
98 images into a training and a test set. Our training
set consists of 73 images and the test set consists of
25 images.
3.2 Proposed Deep Learning
Architecture
We design an end-to-end neural network that is
trained to classify images of thyroid nodules as be-
nign or malignant. Our method takes the thyroid nod-
ule sonograms as inputs and outputs the predicted
attributes with respect to composition, echogenicity,
margins and calcifications as well as a probabilistic
prediction of malignancy.
Our framework consists of two parts that are
trained in an end-to-end manner. The first part of the
model predicts the classification of nodules in terms
of the attributes (composition, echogenicity, margins
and calcifications) and the second part of the frame-
work uses the predicted attributes to predict nodule
malignancy.
3.2.1 Input and Data Augmentation
We use a two channel input, where the first chan-
nel consists of the original sonogram and the second
channel consists of the masked sonogram. The mask
blocks all parts of the image except the nodule(s). Our
decision to use this 2 channel image is based on the
work of Liang et al. (Liang et al., 2020) where the use
of the mask improved the accuracy of detection of the
type and the nature of the disease in comparison to
using the original image.
In this work, the input training images undergo
augmentations with a probability of 0.5. The augmen-
tations used are left-right flip and up-down flip.
3.2.2 Prediction of Attributes
We use a VGG-16 (Liu and Deng, 2015) backbone
for our end-to-end model, pre-trained on ImageNet.
BIOIMAGING 2023 - 10th International Conference on Bioimaging
96
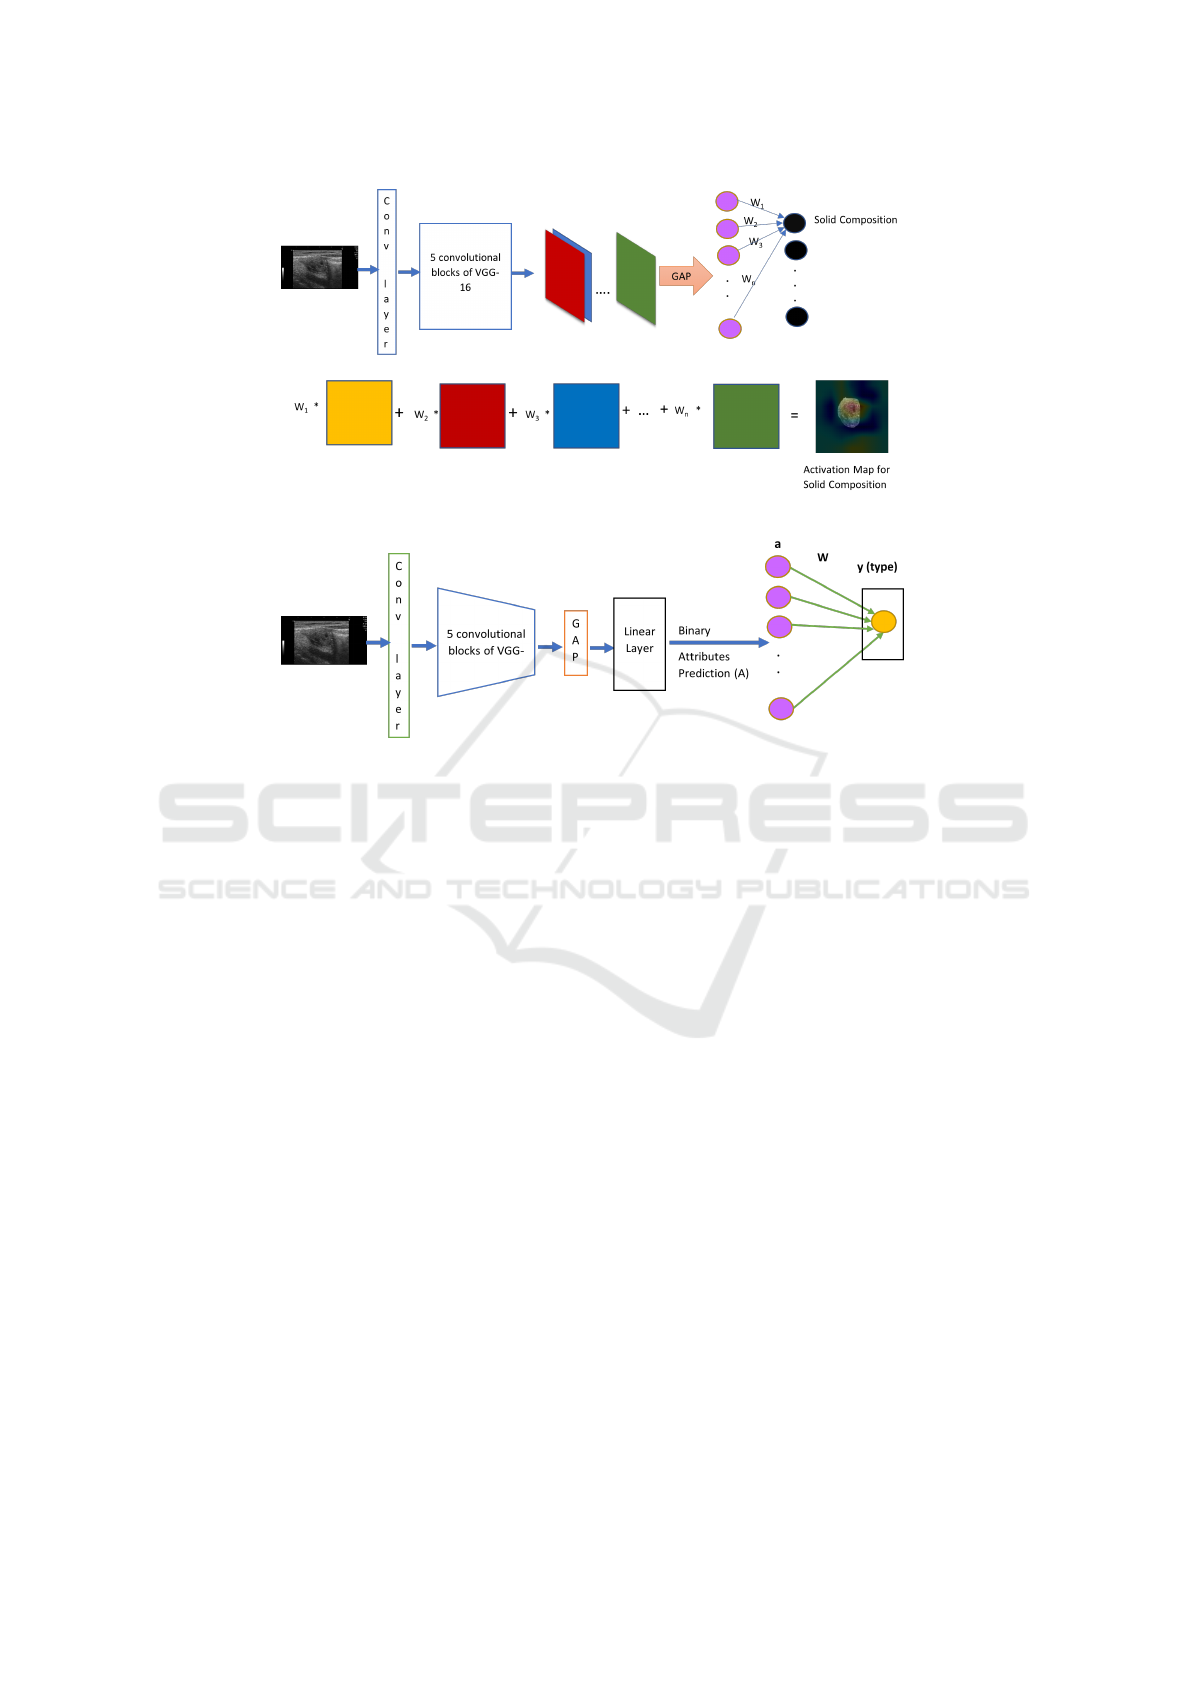
Figure 2: Figure showing the technique for generation of CAM for a specific binary attribute (solid composition).
Figure 3: Figure showing the end-to-end model. The binary attribute prediction is used to predict whether the tumor is benign
or malignant.
We fine-tune it for our application. Since the inputs
are two channel images, we introduce an additional,
convolutional layer to the original VGG-16 architec-
ture that takes a two channel image as an input and
outputs three feature maps.
Each attribute (e.g., echogenicity) has several po-
tential values (e.g., iso, hyper and hypoechoic). We
encode these attributes as groups of one-hot vectors.
The output from this part of our framework consists of
15 (sum of all possible values of all attributes) prob-
abilities, where each one of these indicates the prob-
ability that the nodule possesses a specific attribute
value. If the predicted probability for a specific bi-
nary attribute is 0.5 or more, the nodule is said to
possess the corresponding binary attribute. For this
purpose, we use the sigmoid activation function in-
stead of ReLU to re-scale the outputs of the final, lin-
ear layer, to values between 0 and 1, which indicate
probabilities.
3.2.3 Generation of Activation Maps
We further modify the modified VGG-16 network
from Section 3.2.2 to facilitate the generation of ac-
tivation maps for each image. This indicates the part
of the image that played an important role in making
a prediction for each attribute. For this purpose, we
implement the Class Activation Map (CAM) concept
proposed in (Zhou et al., 2015). We remove two of
the three linear layers in the VGG architecture, while
retaining the final linear layer to compute the outputs.
We introduce a Global Average Pooling (GAP) (Lin
et al., 2013) layer before the final, linear layer in the
VGG-16 model.
To generate the activation maps for a specific
class, we multiply each feature map that is output by
the layer preceding the GAP layer, by the correspond-
ing weight in the final, linear layer. This gives us
512 weighted feature maps for each class. We then
sum up the weighted feature maps for each class to
get the class activation map for each binary attribute.
Figure 2 contains a pictorial representation of how
the CAM technique is used to generate the activation
maps for the binary attributes.
3.2.4 Prediction of Nodule Type Using Binary
Attributes
We use the predicted probabilities of each binary at-
tribute to predict the tumor type using an interpretable
function. Our final model uses a linear layer to com-
pute the probability of malignancy for a thyroid nod-
ule by using the predicted probabilities for each bi-
nary attribute as inputs. The linear layer is restricted
to have zero bias and learns a matrix W, representing
the weight of each of the binary attributes in deciding
Prediction of Thyroid Malignancy Using Contextual Semantic Interpretability from Sonograms
97
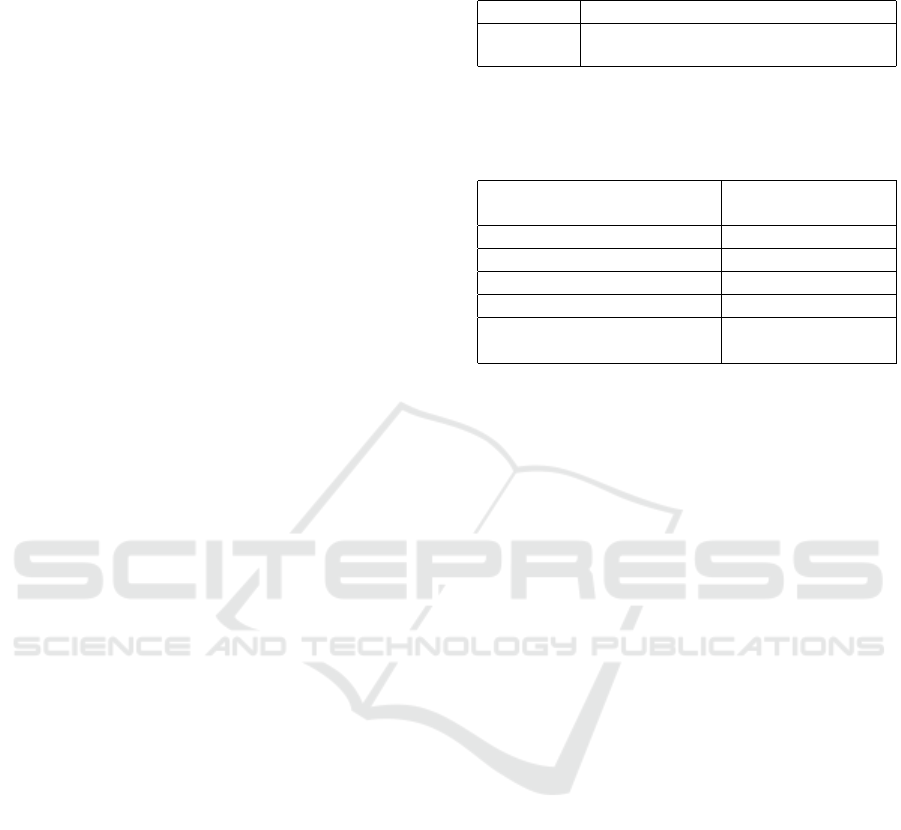
whether the nodule is benign or malignant. After each
training iteration, the weights are re-scaled to ensure
that they are all positive and that they sum up to 1. We
use Sankey plots to pictorially represent the weights
in the matrix W and to facilitate the process of un-
derstanding the model. We use a sigmoid function
to convert the output of the linear layer of this module
into a value between 0 and 1 to represent the predicted
probability of malignancy. Figure 3 provides a picto-
rial representation of our end-to-end architecture.
We attempt to use a second model that uses two
linear layers to predict malignancy using the binary
attribute predictions as the inputs, inspired by (Mar-
cos et al., 2020). The first layer groups A binary at-
tributes into Z groups. This operation is performed by
learning the weights in a A × Z matrix, G, which out-
puts group probabilities to group binary attributes to-
gether into groups. The group presence probabilities,
z are computed using z = Ga. We use another linear
layer to compute the probability of a thyroid nodule
being malignant by using the group presence proba-
bilities, z as the inputs and identifying the relation be-
tween group probabilities and predictions about ma-
lignancy. For this, the values (weights) in a Z × 1 ma-
trix, Q are learnt. The probability of a tumor being
malignant, y is computed using the equation y = Qz.
However, the two-layer model does not show any im-
provement in performance over the one layer model
for this problem,
4 EXPERIMENTS AND RESULTS
4.1 Experimental Setup
Our code is implemented in python, and we use Py-
torch to implement our framework. Our code is avail-
able at: https://github.com/rpmihail/thyroid.git. We
run our training and inference experiments on an
NVIDIA GeForce RTX 3090 GPU with 24 GB mem-
ory. The processor is a 64-bit, 3.7GHz Intel i9 com-
puter with 32 GB RAM. The OS used is Ubuntu 22.04
LTS.
4.2 Training
The framework described in Section 3.2, is trained in
an end-to-end manner. It is trained for 1000 epochs
using a learning rate of 0.00001 and the loss used is
binary cross-entropy loss both for the binary attributes
and for the prediction of nodule as benign or malig-
nant. The optimizer used is Adam optimizer.
Table 1: Table comparing the average binary attribute pre-
diction accuracy for ResNet50 and VGG-16 backbones.
Backbone Average accuracy (binary attributes)
VGG-16 76%
ResNet-50 75%
Table 2: Comparison of the average binary attribute predic-
tion accuracy (computed by averaging the accuracy of indi-
vidual binary predictions) using no augmentations or differ-
ent combinations of augmentations.
Augmentations Average accuracy
(binary attributes)
None 76%
Flip-ud 77%
Flip-ud + Flip-lr 79%
Flip-ud + Flip-lr + Rotate 76%
Flip-ud + Flip-lr 76%
+ Random Shift
4.3 Ablation Studies
We perform various ablation studies to identify the
best set of augmentations, backbone and the number
of layers for predicting type.
4.3.1 Identifying the Better Backbone
We tried ResNet50 (He et al., 2015) as an alternate
backbone. However, as shown in Table 3, the VGG-
16 backbone achieves marginally higher average ac-
curacy in terms of the prediction of binary attributes.
4.3.2 Selecting Augmentations
We consider four types of augmentations for our
framework: flip in left/right direction; flip in up/down
direction; rotate by a random multiple of 90
◦
; and ran-
dom shift in one of 4 directions by 100 to 126 pixels.
As shown in the results in Table 2, the use of
right/left and up/down flip result in improvements in
the binary attribute prediction accuracy.
4.3.3 Selecting the Number of Linear Layers for
Type Prediction
While our work is inspired by (Marcos et al., 2020),
the problem tackled in their work involves a concept
that depends not only on the attributes, but on dif-
ferent combinations of the attributes. Hence, a 2-
layer network is used for performing the final predic-
tion from the attributes. However, our problem can
be solved by a linear combination of the binary at-
tributes, We experiment with one layer and two layer
networks described in Section 3.2.4 to identify the
better option. For the two layer networks, we vary the
BIOIMAGING 2023 - 10th International Conference on Bioimaging
98
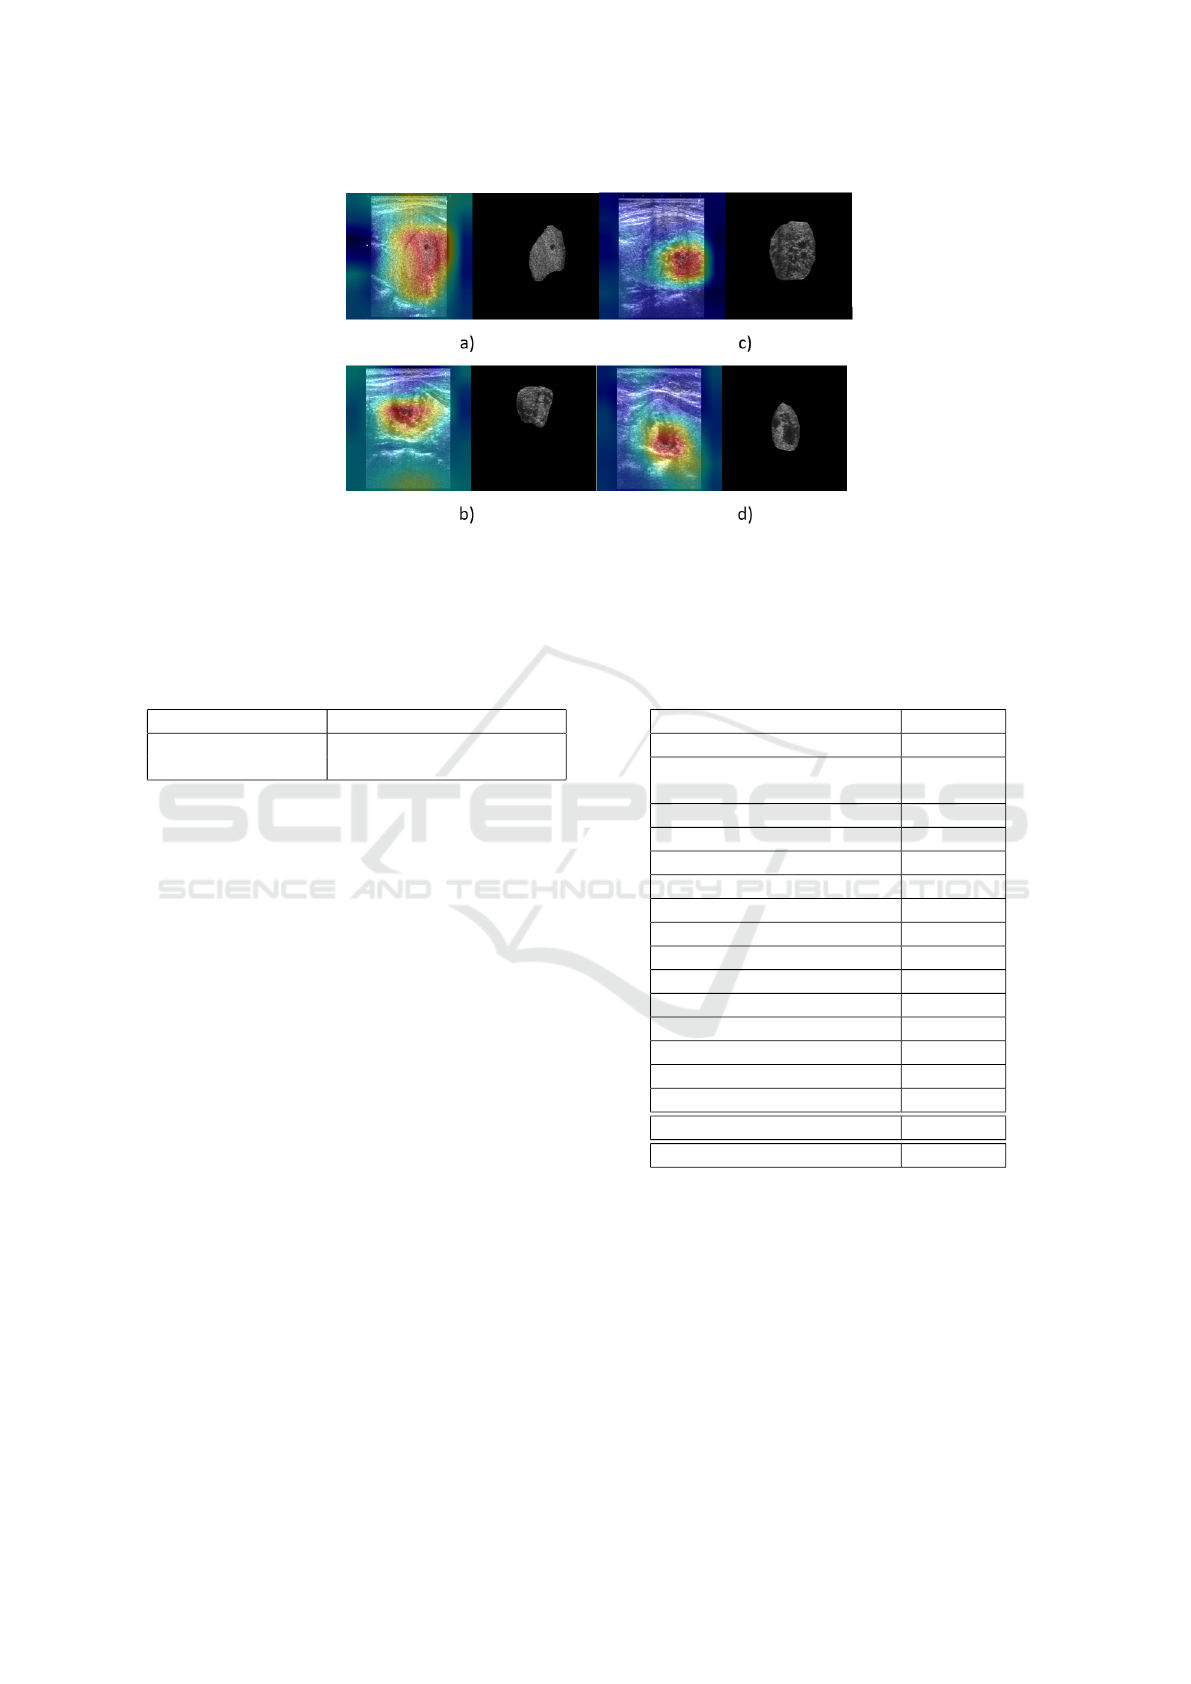
Figure 4: CAM for 4 different binary attributes using 4 sonograms. Each image has the mask for the nodule shown to the
right. It is evident that the relevant parts of the image are indeed more significant for the prediction of binary attributes.
Images are all for correct classification of images possessing the following attributes. a) Isoechogenicity b) Smooth margin c)
No calcification d) Spongiform composition.
Table 3: Comaparison of the type prediction accuracy when
the prediction of type (benign or malignant) from binary
attributes is performed using 1 and 2 layer linear networks.
Number of Layers Type prediction accuracy
1 72%
2 72%
number of groups from 1 to 29. However, the result
remains the same regardless of the number of groups
used. The reason we limit the number of groups to 30
is due to the fact that there are only 29 unique binary
attribute combinations in the training data, hence, it
is not possible to benefit from more than 29 groups.
The performance in terms of type prediction accuracy
remains the same in case of the one and two layer net-
works. Following Occam’s Razor and the discussion
in‘(Schaffer, 2015), we select the simpler model with
one linear layer.
4.4 Results
In Table 4, we tabulate the accuracy of our frame-
work with respect to each of the binary attributes. We
compute the average accuracy of prediction of the bi-
nary attributes by averaging the accuracy values we
get for each of the binary attributes and also tabulate
the type accuracy. As is evident from the table, there
are a few binary attributes, such as isoechogenicity
and smooth margins that have lower prediction accu-
racy. Since deep learning models perform better when
a large amount of data is used for training, the fact
that our training set has only 73 samples is one of the
major causes of this problem.
Our training set consists of only 29 different com-
binations of binary attributes. However, the total pos-
Table 4: Binary attribute prediction accuracy for each bi-
nary attribute as well as the average binary attribute predic-
tion accuracy and the type prediction accuracy.
Binary Attribute Accuracy
Cystic composition 96%
Predominantly solid compo-
sition
96%
Solid composition 64%
Spongiform composition 68%
Hyper echogenicity 96%
Hypo echogenicity 68%
Iso echogenicity 56%
Marked hypo echogenicity 96%
Ill-defined margin 68%
Microlobulated margin 92%
Spiculated margin 96%
Smooth margin 60%
Macro calcification 96%
Micro calcification 64%
No calcification 72%
Average binary attributes 79%
Benign / Malignant (type) 72%
sible combinations of attributes are 4×4×4×4×3 =
192. Besides, we identified that our randomly se-
lected test set has 5 attribute combinations that are
not present in the training set. This is a factor that
is negatively affecting our type prediction accuracy.
However, despite these challenges, our framework
achieves a type prediction accuracy of 72%.
In Figure 4, we show some samples where we use
CAM to identify the important parts of an image in
making a decision about a specific binary attribute.
For each image, we also show the masked version of
Prediction of Thyroid Malignancy Using Contextual Semantic Interpretability from Sonograms
99
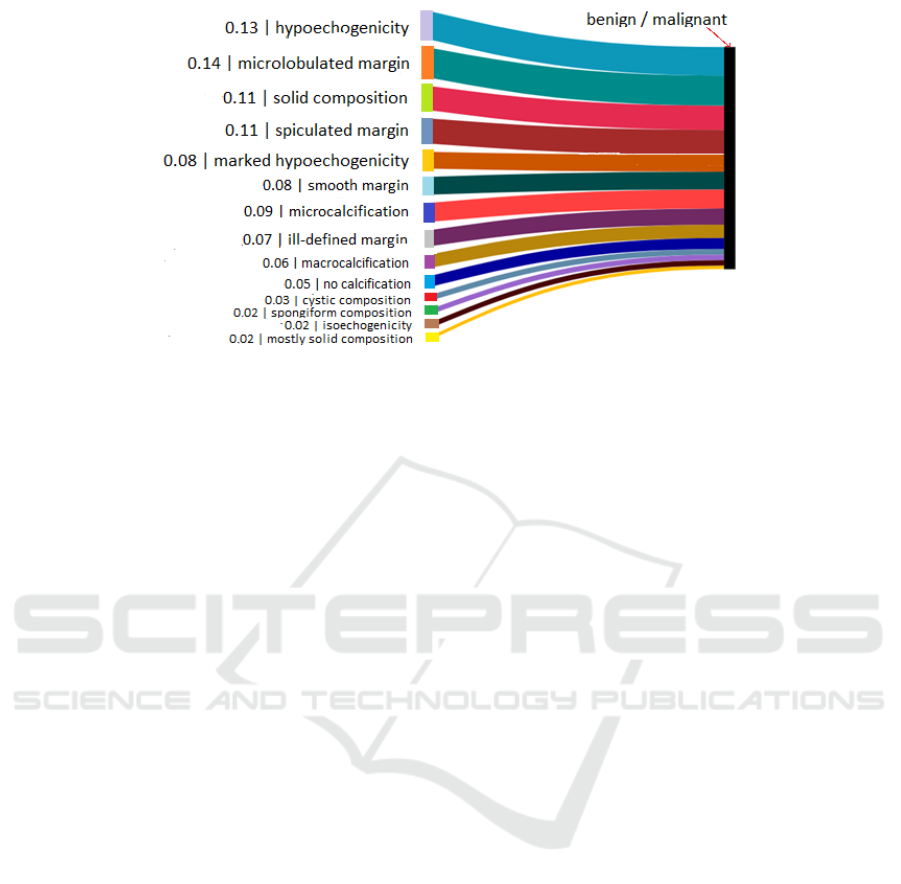
Figure 5: Figure showing importance (weight) of each binary attribute in predicting the type of the nodule. Malignant is 1 and
benign is 0. Hence, attributes with higher weight are more important in predicting a nodule as malignant. The number before
each binary attribute indicates the learnt weight for the binary attribute.
the image, where only the nodule is visible. We can
verify that the backbone of our framework is only
using the part of the image that corresponds to the
nodule to make decisions, ignoring other parts of
the sonogram such as tissues and artifacts.
In Figure 5, we plot a Sankey diagram to show
the weight of each binary attribute, learnt and used
for the computation of the probability of malignancy.
A binary attribute with higher weight should corre-
spond to attributes that are allocated larger values by
TI-RADS, since benign is 0 and malignant is 1.
5 DISCUSSION AND
LIMITATIONS
In Figure 5, the thickness of the edge connecting a
binary attribute to the node for benign/malignant in-
dicates its relative weight with respect to the other bi-
nary attributes. On matching our Sankey plot with
the TI-RADS values in Figure 1, we see that the top 5
weights in the plot correspond to binary attributes that
have a value of 2 or 3 according to TI-RADS. 6 of the
bottom 7, including the missing binary attribute hyper
echogenicity (which has a weight of 0), have a TI-
RADS value of 0 or 1. However, mostly solid compo-
sition is incorrectly assigned a very low weight. Over-
all, while the model identifies important features for
predicting the malignancy risk of nodules, there are
some inconsistencies from TI-RADS. Our model is
capable of separating the binary attributes with TI-
RADS values of 0 and 1 from binary attributes with
TI-RADS values of 2 and 3. However, it does not dis-
cover a decreasing order of importance according to
TI-RADS.
The biggest and most important limitation of this
study is the size of the dataset. The low number of
sonogram samples is a significant limitation and con-
tributes negatively to the prediction performance of
our approach. However, the goal of this work was to
add explainability to models in a domain where such
work has not yet been attempted, to the best of our
knowledge.
6 CONCLUSION
In this paper, we propose a framework for inter-
pretable malignancy classification of thyroid nodules.
Our framework uses deep learning to predict binary
attributes from sonograms, then uses the predicted at-
tributes in a linear layer to make predictions about the
type of the tumor. We use CAM to visualize the parts
of the images that are important for binary attribute
prediction and Sankey plots to visualize the impor-
tance of each binary attribute in predictions about
nodule type. The aim of this work is to ensure that
deep learning is used to provide interpretable results
in medical imaging.
In the future, we will explore different CAM tech-
niques to generate more accurate maps. We will
also work on improvements to the attribute prediction
pipeline and attempt to use a larger dataset.
REFERENCES
Alexander, E. K., Marqusee, E., Orcutt, J., Benson, C. B.,
Frates, M. C., Doubilet, P. M., Cibas, E. S., and Atri,
BIOIMAGING 2023 - 10th International Conference on Bioimaging
100

A. (2004). Thyroid nodule shape and prediction of
malignancy. Thyroid, 14(11):953–958.
Chattopadhay, A., Sarkar, A., Howlader, P., and Balasub-
ramanian, V. N. (2018). Grad-cam++: Generalized
gradient-based visual explanations for deep convolu-
tional networks. In 2018 IEEE Winter Conference on
Applications of Computer Vision (WACV). IEEE.
Chi, J., Walia, E., Babyn, P., Wang, J., Groot, G., and
Eramian, M. (2017). Thyroid nodule classification in
ultrasound images by fine-tuning deep convolutional
neural network. Journal of Digital Imaging, 30.
Desai, S. and Ramaswamy, H. G. (2020). Ablation-cam: Vi-
sual explanations for deep convolutional network via
gradient-free localization. In 2020 IEEE Winter Con-
ference on Applications of Computer Vision (WACV),
pages 972–980.
He, K., Zhang, X., Ren, S., and Sun, J. (2015). Deep
residual learning for image recognition. CoRR,
abs/1512.03385.
Koh, J., Lee, E., Han, K., Kim, E.-K., Son, E., Sohn, Y.-
M., Seo, M., Kwon, M.-R., Yoon, J. H., Lee, J., Park,
Y. M., Kim, S., Shin, J., and Kwak, J. (2020a). Di-
agnosis of thyroid nodules on ultrasonography by a
deep convolutional neural network. Scientific reports,
10:15245.
Koh, P. W., Nguyen, T., Tang, Y. S., Mussmann, S., Pierson,
E., Kim, B., and Liang, P. (2020b). Concept bottle-
neck models.
Kwon, S., Choi, I., Kang, J., Jang, W., Lee, G., and Lee, M.
(2020). Ultrasonographic thyroid nodule classification
using a deep convolutional neural network with surgi-
cal pathology (bmvc2020 oral). In Journal of digital
imaging, volume 33, pages 1202–1208.
Lee, E., Ha, H., Kim, H., Moon, H., Byon, J., Huh, S., Son,
J., Yoon, J., Han, K., and Kwak, J. (2019). Differen-
tiation of thyroid nodules on us using features learned
and extracted from various convolutional neural net-
works. Scientific Reports, 9:19854.
Liang, X., Yu, J., Liao, J., and Chen, Z. (2020). Convolu-
tional neural network for breast and thyroid nodules
diagnosis in ultrasound imaging. BioMed Research
International, 2020:1–9.
Lin, M., Chen, Q., and Yan, S. (2013). Network in network.
10.48550/ARXIV.1312.4400.
Liu, S. and Deng, W. (2015). Very deep convolutional
neural network based image classification using small
training sample size. In 2015 3rd IAPR Asian Confer-
ence on Pattern Recognition (ACPR), pages 730–734.
Marcos, D., Fong, R., Lobry, S., Flamary, R., Courty,
N., and Tuia, D. (2020). Contextual semantic inter-
pretability. In Proceedings of the Asian Conference
on Computer Vision.
Morris, L. G., Sikora, A. G., Tosteson, T. D., and Davies, L.
(2013). The increasing incidence of thyroid cancer:
the influence of access to care. Thyroid, 23(7):885–
891.
Naidu, R., Ghosh, A., Maurya, Y., K, S. R. N., and
Kundu, S. S. (2020). Is-cam: Integrated score-cam
for axiomatic-based explanations.
Pedraza, L., Vargas, C., Narv
´
aez, F., Dur
´
an, O., Mu
˜
noz, E.,
and Romero, E. (2015). An open access thyroid ultra-
sound image database. In 10th International Sympo-
sium on Medical Information Processing and Analy-
sis, volume 9287, page 92870W. International Society
for Optics and Photonics.
Rudin, C. (2019). Stop explaining black box machine learn-
ing models for high stakes decisions and use inter-
pretable models instead. Nature Machine Intelligence,
1(5):206–215.
Schaffer, J. (2015). What not to multiply without necessity.
Australasian Journal of Philosophy, 93(4):644–664.
Selvaraju, R. R., Cogswell, M., Das, A., Vedantam, R.,
Parikh, D., and Batra, D. (2019). Grad-CAM: Visual
explanations from deep networks via gradient-based
localization. International Journal of Computer Vi-
sion, 128(2):336–359.
Siegel, R. L., Miller, K. D., and Jemal, A. (2019). Cancer
statistics, 2019. CA: a cancer journal for clinicians,
69(1):7–34.
Simonyan, K., Vedaldi, A., and Zisserman, A. (2013).
Deep inside convolutional networks: Visualising im-
age classification models and saliency maps. arXiv
preprint arXiv:1312.6034.
Speith, T. (2022). A review of taxonomies of explainable
artificial intelligence (xai) methods. In 2022 ACM
Conference on Fairness, Accountability, and Trans-
parency, pages 2239–2250.
Tessler, F. N., Middleton, W. D., Grant, E. G., Hoang, J. K.,
Berland, L. L., Teefey, S. A., Cronan, J. J., Beland,
M. D., Desser, T. S., Frates, M. C., et al. (2017). Acr
thyroid imaging, reporting and data system (ti-rads):
white paper of the acr ti-rads committee. Journal of
the American college of radiology, 14(5):587–595.
Wang, H., Naidu, R., Michael, J., and Kundu, S. S. (2020).
Ss-cam: Smoothed score-cam for sharper visual fea-
ture localization.
Wang, H., Wang, Z., Du, M., Yang, F., Zhang, Z., Ding, S.,
Mardziel, P., and Hu, X. (2019). Score-cam: Score-
weighted visual explanations for convolutional neural
networks.
Wang, L., Zhou, X., Nie, X., Lin, X., Li, J., Zheng, H., Xue,
E., Chen, S., Chen, C., Du, M., Tong, T., Gao, Q., and
Zheng, M. (2022). A multi-scale densely connected
convolutional neural network for automated thyroid
nodule classification. Frontiers in Neuroscience, 16.
Wu, M.-H., Chen, C.-N., Chen, K.-Y., Ho, M.-C., Tai, H.-
C., Wang, Y.-H., Chen, A., and Chang, K.-J. (2016).
Quantitative analysis of echogenicity for patients with
thyroid nodules. Scientific reports, 6:35632.
Zhou, B., Khosla, A., Lapedriza,
`
A., Oliva, A., and Tor-
ralba, A. (2015). Learning deep features for discrimi-
native localization. CoRR, abs/1512.04150.
Prediction of Thyroid Malignancy Using Contextual Semantic Interpretability from Sonograms
101
