
Simulation Study for the Comparison of Power Flow Models for a Line
Distribution Network with Stochastic Load Demands
Mark Christianen
1 a
, Maria Vlasiou
1,2 b
and Bert Zwart
1,3
1
Eindhoven University of Technology, Eindhoven, The Netherlands
2
University of Twente, Enschede, The Netherlands
3
Centrum Wiskunde & Informatica, Amsterdam, The Netherlands
Keywords:
Electric Vehicle Charging, Power Flow Models, Bandwidth-Sharing Networks.
Abstract:
We use simulation to compare different power flow models in the process of charging electric vehicles (EVs)
by considering their random arrivals, their stochastic demand for energy at charging stations, and the char-
acteristics of the electricity distribution network. We assume the distribution network is a line with charging
stations located on it. We consider the Distflow and the Linearized Distflow power flow models and we assume
that EVs arrive at the network with an exponential rate, have an exponential charging requirement, and that
voltage drops on the distribution network stay under control. We provide extensive numerical results investi-
gating the effect of using different power flow models on the performance of the network.
1 INTRODUCTION
In recent years, the growing electricity consumption,
the active adoption of renewable generation, and the
energy transition result in congestion in the electric-
ity network. On one side, more companies use elec-
tricity for their production, more houses are heated
with heat pumps and more people drive electric cars.
On the other side, companies and citizens are gener-
ating more and more electricity from wind and sun,
which they mostly feed back to the electricity net-
work. This causes network capacity problems, or in
other words, congestion. This is illustrated in (Hoog-
steen et al., 2017), where the impact of the energy
transition on a real electricity network is evaluated.
Here, the authors showed that charging a small num-
ber of EVs is enough to cause a blackout in a neigh-
borhood. Therefore, it is imperative to study the per-
formance of the network under different power flow
models, since these models are used for the design
and control of the network.
Irrespective of the power flow model, it is impor-
tant to respect the physical laws of the network and
its constraints. In an electricity network, an impor-
tant constraint is the requirement of keeping voltage
losses, or in other words, the voltage drop, on a cable
a
https://orcid.org/0000-0002-9611-500X
b
https://orcid.org/0000-0002-0457-2925
in the network under control. These voltage losses
are caused by the physical properties of the cables in
the network. Keeping the voltage losses under con-
trol ensures that every user in the network receives
safe and reliable power at a voltage that is within
some standard range, which varies from one country
to another (Kersting, 2018). For example, according
to Dutch law, the voltage drop in a distribution net-
work, a small part of the electricity network, is not al-
lowed to be more than 4.5% (van Westering and Hel-
lendoorn, 2020).
In this paper, we consider the stochastic process
of charging EVs in a neighborhood such that the volt-
age drop in the distribution network stays under con-
trol. In this process, the stochasticity comes from ran-
dom arrivals (at parking lots with charging stations)
and charging requirements of EVs, while the power
allocated to each EV in the network depends on the
number of EVs and the corresponding location of EVs
that are currently charging in the network. We model
this process as a queue, with EVs representing jobs,
charging stations classified as servers, and the ser-
vice being delivered as the power supplied to EVs,
constrained by physical laws and network constraints.
The particular queuing model that we employ can be
seen as falling under a general class of queuing net-
works called bandwidth-sharing networks. To model
the physical laws and network constraints, we use two
Christianen, M., Vlasiou, M. and Zwart, B.
Simulation Study for the Comparison of Power Flow Models for a Line Distribution Network with Stochastic Load Demands.
DOI: 10.5220/0011670600003396
In Proceedings of the 12th International Conference on Operations Research and Enterprise Systems (ICORES 2023), pages 167-174
ISBN: 978-989-758-627-9; ISSN: 2184-4372
Copyright
c
2023 by SCITEPRESS – Science and Technology Publications, Lda. Under CC license (CC BY-NC-ND 4.0)
167

approximations of the alternating current (AC) power
flow equations (Molzahn and Hiskens, 2019), i.e.; we
study the Distflow and a linearized version of the Dis-
tflow model, by ignoring some power losses, that is
called the Linearized Distflow (Baran and Wu, 1989b;
Baran and Wu, 1989a).
In this simulation study, we assess the accuracy
and effectiveness of the Linearized Distflow model
compared to the Distflow model. Our goal is to com-
pare the different power flow models on the perfor-
mance of the stochastic process of EV charging, by
the mean number of EVs and the mean charging time
of each EV in the network. Furthermore, we gain in-
sights into the behavior of the network by including
variability in the distribution of the arrival rates to dif-
ferent parking lots.
The contributions we obtained from analyzing
such a network are summarized as follows. We ob-
serve that the performance of the Linearized Distflow
model is comparable to the Distflow model, i.e. the
mean number of EVs and the mean charging time of
an EV under both power flow models are similar and
the relative difference between critical arrival rates
(the specific arrival rates under both power flow mod-
els for which the mean number of EVs and the mean
charging time of an EV grow to its maximum capac-
ity) is below 5%. Thus, our first contribution is that
we obtain more evidence that using the much simpler
Linearized Distflow model is a valid and accurate ap-
proximation of the Distflow model, even if the system
is highly heterogeneous. Namely, in our numerical
examples, we consider cases where one station has
almost all the load of the system. Even for such het-
erogeneous cases, the performance of the network is
the same under the Linearized Distflow and the Dis-
tflow model. In other words, we do not lose much
accuracy from a performance perspective by ignoring
some power losses. The second contribution is rather
surprising. It is very well known from queuing the-
ory that variability in the network causes worse per-
formance. However, what is surprising in this case is
that the network does not perform symmetrically un-
der the same loads. If the load of an individual park-
ing lot is way larger than the other loads of the other
parking lots, the performance of the network is differ-
ent from the performance of the network if the (same)
largest load is put on another parking lot.
The structure of the paper is as follows. In Sec-
tion 2, we provide a literature review on work that has
been done on stability for EV-charging and specifi-
cally in the context of a queuing network, and a com-
parison between the Linearized Distflow model and
the Distflow power flow model. In Section 3, we pro-
vide a detailed model description. In particular, we
introduce the queuing network, the constraints and as-
sumptions of the electrical distribution network, and
the power flow models we consider. In Section 4, we
present several numerical experiments showing the
accuracy and effectiveness of the Linearized Distflow
model and the effect of including variability in the dis-
tribution of the arrival rates to the performance of the
network.
2 LITERATURE REVIEW
First, we discuss the literature on stability for EV-
charging and stability in queuing networks for EV-
charging which relate to the network capacity prob-
lems that we mentioned earlier. Second, we provide
literature that compares the Distflow model and the
Linearized Distflow model.
The term stability, from a queuing perspective,
means the stability of the queuing model and is de-
fined as the positive recurrence of a Markov process.
Informally speaking, stability means the ability of all
queues to complete the service of all jobs, without the
number of outstanding building up infinitely. In our
simulations, we consider a finite number of parking
spaces at all parking lots, which implies that the queu-
ing model is always stable. Therefore, we investigate
the performance of the network in terms of the mean
number of EVs and the mean charging time of an EV
in the network but still discuss the literature on stabil-
ity results.
Stability Results for EV-Charging. The literature
on stability results for EV charging is limited to nu-
merical experiments. An early paper on stability anal-
ysis in EV-charging is by Huang et al (Huang et al.,
2013). The authors present a new quasi-Monte Carlo
stability analysis method to assess the dynamic ef-
fects of plug-in electric vehicles in power systems.
They conclude that improvements in stability control
are worth further study since the number of EVs is
growing. Other simulation studies are conducted to
obtain stability conditions. In (de Hoog et al., 2014),
the authors explore the constraint of requiring a mini-
mum voltage to charge EVs throughout a network and
demonstrate that the physical locations of individual
demand and generation of energy play a significant
role in determining whether voltages throughout the
network remain within required limits or not. Simi-
larly, in (Zhang et al., 2016), the impact of charging
EVs on the voltage stability of the distribution net-
work is simulated and analyzed. The simulation re-
sults show that the voltage stability is related to the
individual loads, total load in the network, and physi-
ICORES 2023 - 12th International Conference on Operations Research and Enterprise Systems
168

cal properties of the network. In (Ul-Haq et al., 2015),
simulations are performed on another test network.
For this network, different charging strategies are im-
plemented and it is shown that for some scenarios this
can cause significant voltage instability. Last, in (Deb
et al., 2018), the authors perform a numerical study
on a specific test system, where they investigate the
impact of a single EV charging station on the volt-
age stability, power losses, and economic losses of the
distribution network. Here, it is also observed that the
location of the EV charging station is important in the
smooth operation of the grid.
Stability Conditions for Queuing Networks. The
literature of the stability of queuing networks for EV
charging is very limited. It has been studied in (Car-
valho et al., 2015). Here, the authors find by simu-
lation that there is a threshold on the arrival rates of
EVs, such that if the actual arrival rate is greater than
this threshold, some cars have to wait for increasingly
long times to fully charge. The first analytical study
is (Christianen et al., 2022), where the authors com-
pare these thresholds on the arrival rates under dif-
ferent power flow models and compute the difference
between these rates explicitly as the number of park-
ing lots grows to infinity.
Comparison of the Linearized Distflow and Dis-
tflow Model. The practical use of the Linearized
Distflow compared to the Distflow model is based on
the assumption that power losses on cables are typi-
cally small. It has been shown experimentally that this
only introduces a small relative error, on the order of
1% (Farivar et al., 2013). However, these small rela-
tive errors may be exaggerated when used in a com-
plex stochastic process and this is what we examine
in this paper. Multiple other numerical studies have
been conducted to verify the accuracy and effective-
ness of the Linearized Distflow model (Baran and Wu,
1989b; Wang et al., 2014a; Chen et al., 2016; Tan
et al., 2013; Yuan et al., 2016; Wang et al., 2014b;
Yeh et al., 2012; Li et al., 2019; Cao et al., 2019).
3 MODEL DESCRIPTION AND
FORMULATION
This section describes the main components of the
EV-charging model, i.e.; we describe the characteris-
tics of the queuing, the distribution network, and the
power flow models.
3.1 Queuing Model of EV-Charging
We use a queuing model to study the process of charg-
ing EVs in a distribution network. EVs referred to
as jobs require service. This service is delivered by
charging stations, referred to as servers and the ser-
vice being delivered is the power supplied to EVs.
At all parking lots, there is one charging station with
K > 0 parking spaces, and each parking space has its
own EV charger.
Thus, in the queuing system, we consider N
single-server queues, each having its own arrival
stream of jobs. Denote by X(t) = (X
1
(t), . . . , X
N
(t))
the vector giving the number of jobs at each queue
at time t. At all parking lots, all EVs arrive inde-
pendently according to Poisson processes with rate
λ
i
, i = 1, . . . , N and have independent service require-
ments which are Exp(1) random variables. If all park-
ing spaces are occupied, a newly arriving EV does not
enter the system but is assumed to leave immediately.
At each queue, all jobs are served simultaneously
and start service immediately (there is no queuing).
Furthermore, each job receives an equal fraction of
the service capacity, i.e. the charging rate, allocated
to a queue. Denote by
˜
p(t) = ( ˜p
1
(t), . . . , ˜p
N
(t)) the
vector of service capacities allocated to each queue
at time t. From now on, for simplicity, we drop the
dependence on time t from the notation. For example,
we write X
j
and ˜p
j
instead of X
j
(t) and ˜p
j
(t).
Service capacities are state-dependent and subject
to changes to the current vector X = (X
1
, . . . , X
N
) of
number of jobs. For each state of the system, i.e. a
given number of EVs charging at each parking lot,
we assume that the charging rates
˜
p are the unique
solution of the optimization problem
max
˜
p
∑
j
X
j
log
˜p
j
X
j
, (1)
which are called proportional fair allocations. For
the optimization problem, the feasible region can take
many forms and depends heavily on the power flow
model that is used. In Section 3.3, we discuss the
feasible regions for both power flow models in more
detail.
We can then represent the number of electric ve-
hicles charging at every station as an N-dimensional
continuous-time Markov process. The evolution of
the queue at node j is given by
X
j
(t) → X
j
(t) + 1 at rate λ
j
,
and
X
j
(t) → X
j
(t) − 1 at rate ˜p
j
.
Simulation Study for the Comparison of Power Flow Models for a Line Distribution Network with Stochastic Load Demands
169

3.2 Distribution Network Model
As distribution networks are typically radial (Avek-
louris et al., 2019), we model the distribution network
as a directed graph G = (I , E), where we denote by
I = {0, . . . , N} the set of nodes and by E its set of
directed edges, assuming that node 0 is the root node.
We assume that G has a line topology. Each edge
ε
j−1, j
∈ E represents a line connecting nodes j − 1
and j where node j is further away from the root node
than node j −1. Each edge ε
j−1, j
∈ E is characterized
by the impedance z = r + ix, where r, x ≥ 0 denote the
resistance and reactance along the lines, respectively.
We make the following natural assumption, given that
r >> x in distribution networks (Khatod et al., 2006;
Tonso et al., 2005).
Assumption 3.1. All edges have the same resistance
value r > 0 and reactance value x = 0.
Furthermore, let ˜s
j
= ˜p
j
+ i ˜q
j
be the complex
power consumption at node j. Here, ˜p
j
and ˜q
j
denote
the active and reactive power consumption at node
j, respectively. By convention, a positive active (re-
active) power term corresponds to consuming active
(reactive) power. Since EVs can only consume active
power (Carvalho et al., 2015), it is natural to make the
following assumption.
Assumption 3.2. The active power ˜p
j
is non-
negative and the reactive power ˜q
j
is zero at all charg-
ing stations j ∈ I .
Let
˜
V
j
denote the voltage at node j. Given As-
sumptions 3.1 and 3.2, the voltages at each node j,
˜
V
j
, can be chosen to have zero imaginary components
(Carvalho et al., 2015; Aveklouris et al., 2019). For
each ε
j−1, j
∈ E , let I
j−1, j
be the complex current and
˜
S
j−1, j
=
˜
P
j−1, j
+ i
˜
Q
j−1, j
be the complex power flow-
ing from node j − 1 to j. Here,
˜
P
j−1, j
and
˜
Q
j−1, j
de-
note the active and reactive power flowing from node
j − 1 to j. The model is illustrated in Figure 1.
Voltage Drop Constraint. The distribution net-
work constraints, that is in our case only the voltage
drop constraint, represent the feasible region of (1)
and are described by a set C. The set C is contained
in an N-dimensional vector space and represents fea-
sible power allocations. In our setting, a power al-
location is feasible if the maximal voltage drop; i.e.,
the relative difference between the base voltage
˜
V
0
and the minimal voltage in all buses between the root
node and any other node is bounded by some value
∆ ∈ (0,
1
2
]. Thus, the distribution network constraints
can be described as
C :=
˜
p :
˜
V
0
− min
1≤ j≤N
˜
V
j
˜
V
0
≤ ∆
, (2)
where 0 < ∆ ≤
1
2
. In Section 3.3, we give more con-
crete definitions of the constraint set C for each power
flow model.
3.3 Power Flow Models
We introduce two commonly used models to repre-
sent the power flow that is valid for radial systems;
i.e., systems where all charging stations have only one
(and the same) source of supply. They are called the
Distflow and Linearized Distflow model (Low, 2014;
Baran and Wu, 1989b). Both models are valid when
the underlying network topology is a tree, which is the
case in this paper (as we consider a line topology).
Given the impedance r, the voltage at the root
node
˜
V
0
and the power consumptions ˜p
j
, j = 1, . . . , N,
both power flow models satisfy three relations. First,
we have power balance at each node:
˜
S
j−1, j
− r
I
j−1, j
2
= ˜s
j
+
˜
S
j, j+1
, j ∈ I \{0}. (3)
Here, on the one hand, the quantity r|I
j−1, j
|
2
rep-
resents line loss so that
˜
S
j−1, j
− r|I
j−1, j
|
2
is the
receiving-end complex power at node j from node
j − 1. On the other hand, the delivering-end complex
power is the sum of the consumed power at node j
and the complex power flowing from node j to node
j + 1. Second, by Ohm’s law, we have for each edge,
˜
V
j−1
−
˜
V
j
= rI
j−1, j
, ε
j−1, j
∈ E , (4)
and third, due to the definition of complex power, we
have for each edge,
˜
S
j−1, j
=
˜
V
j−1
I
j−1, j
, ε
j−1, j
∈ E . (5)
However, for a line topology, the distribution net-
work constraints in (2), using (3)–(5), can be rewrit-
ten for both power flow models (Christianen et al.,
2022). Following the approach in (Christianen et al.,
2022), the distribution network constraints under the
Distflow model C
D
reduce to
C
D
:=
˜
p :
˜
V
D
0
≤
1
1 − ∆
, (6)
where
˜
V
D
0
can be found recursively by
˜
V
D
N−1
= 1 + r ˜p
N
, (7)
˜
V
D
j−1
= 2
˜
V
D
j
−
˜
V
D
j+1
+
r ˜p
j
˜
V
D
j
, j = 1, . . . , N − 1. (8)
In the Linearized Distflow model, it is assumed that
the active power losses r|I
j−1, j
|
2
are much smaller
than the active power flows
˜
P
j−1, j
. In other words,
the Linearized Distflow model neglects the loss
terms associated with the squared current magnitudes
|I
j−1, j
|
2
. In that case, the distribution network con-
straints under the Linearized Distflow C
LD
reduce to
C
LD
:=
(
˜
p : 2r
N
∑
j=1
N
∑
k= j
˜p
k
≤
∆(2 − ∆)
(1 − ∆)
2
,
)
. (9)
ICORES 2023 - 12th International Conference on Operations Research and Enterprise Systems
170

λ
1
λ
i
λ
N
Root node
˜
V
0
1
˜
V
1
i
˜
V
i
N
˜
V
N
(
˜
S
i j
, I
i j
, r)
Figure 1: Line network with N charging stations and arriving vehicles at rate λ
i
, i ∈ {1, . . . , N}.
4 NUMERICAL STUDY
In the previous section, we discussed our model for
the EV-charging process. Here, we obtain general in-
sights into the performance of the model by simula-
tion on a large range of parameter settings. Moreover,
this allows us to compare the behavior of the model
under the Distflow model and the Linearized Distflow
model. We vary the total arrival rate to the network
and the distribution of the total arrival rate to differ-
ent parking lots. We focus on the effect of the mean
number of EVs in the network and the mean charging
time of an EV, possibly at each parking lot.
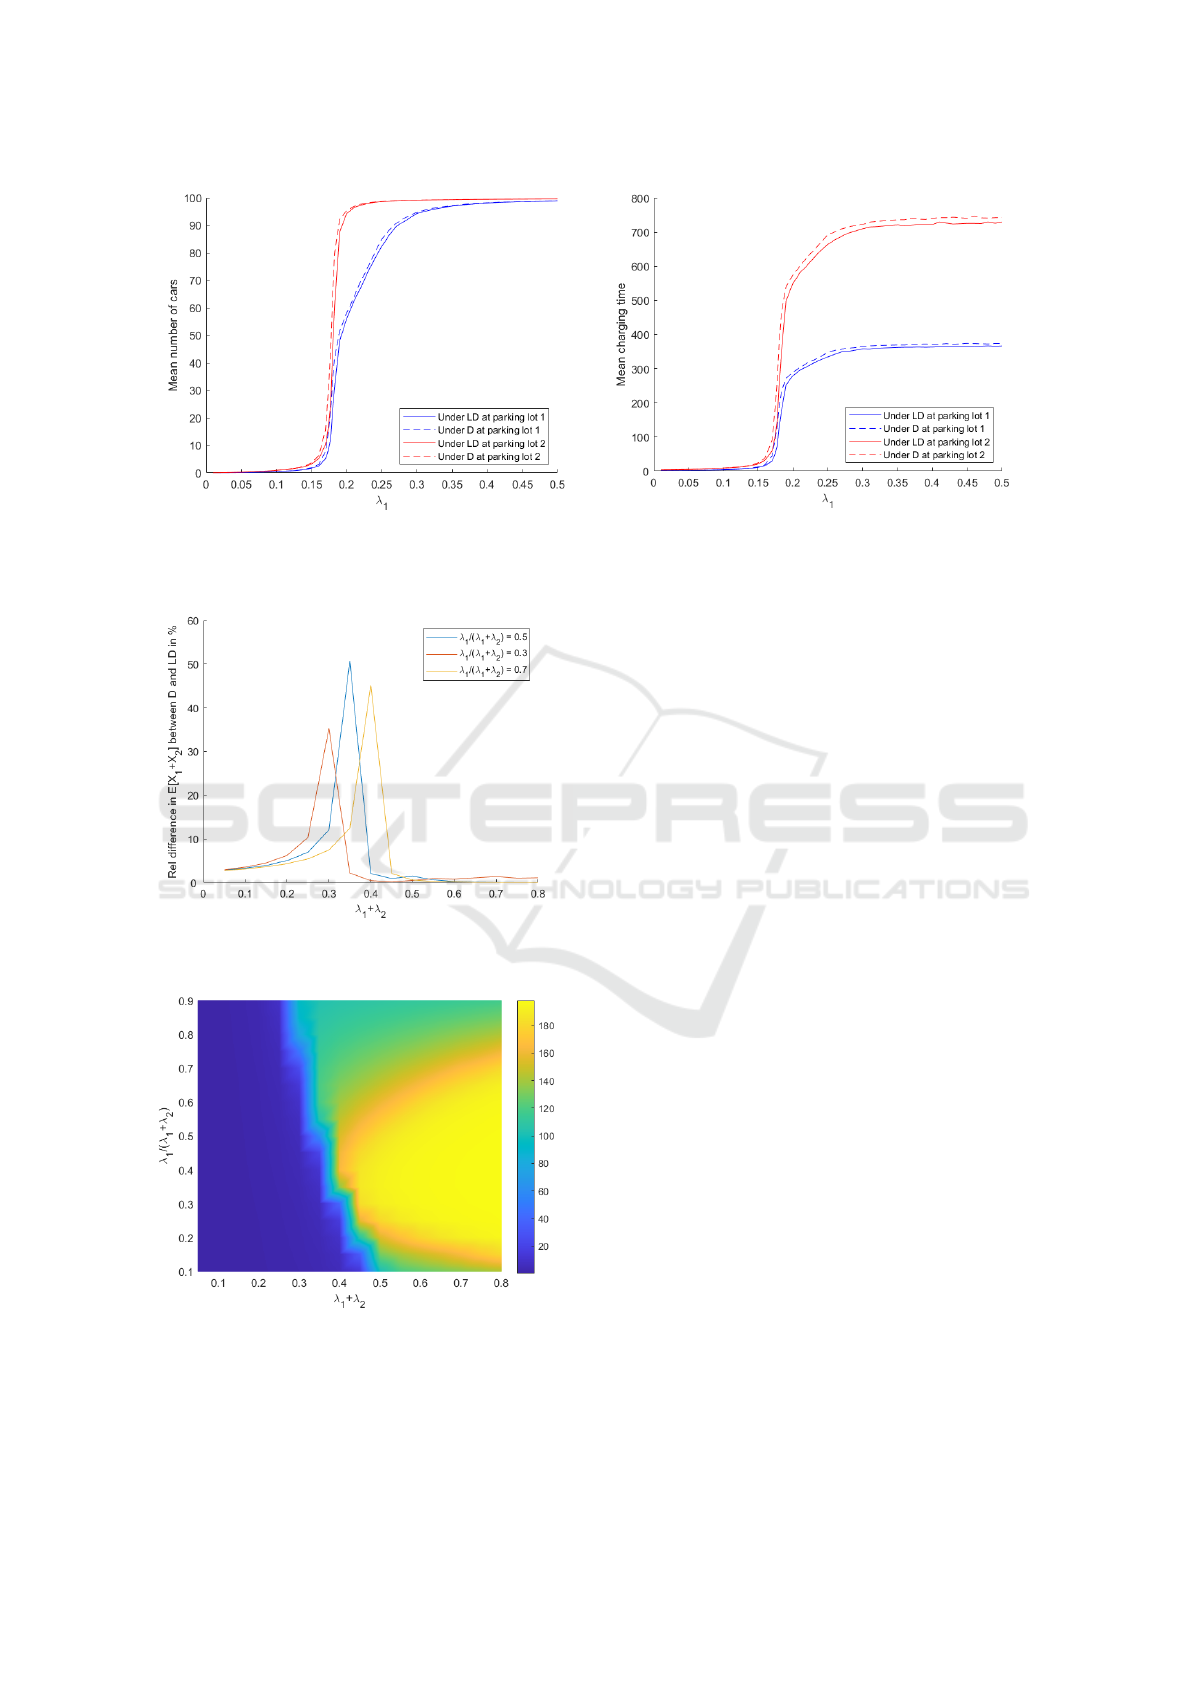
4.1 Critical Arrival Rate
To control the network, we observe that there is a crit-
ical arrival rate λ
c
(≈ 0.18) if the arrival rate to each
parking lot is assumed to be the same. At every park-
ing lot, the mean number of EVs and the mean charg-
ing time of an EV grow to maximum capacity as soon
as the actual arrival rate is greater than the critical ar-
rival rate. See Figure 2, where the mean number of
EVs and the mean charging time of an EV are plotted
versus the individual arrival rate to each parking lot.
We observe the mean number of EVs and the mean
charging time of an EV for both power flow models
at each parking lot. We fix the number of parking lots
at N = 2, the resistance for each cable at r = 0.1, the
maximal capacity at each parking lot at K = 100 and
the parameter to control the voltage drop at ∆ = 0.05
for the Distflow model (dashed) and the Linearized
Distflow model (solid) at parking lot 1 (blue) and at
parking lot 2 (red). Although the total arrival rate is
varied, the solid curves are close to the dashed lines
for the two parking lots. Moreover, the solid curves
are below the dashed curves. This is to be expected;
in (Christianen et al., 2022), the authors observed that
the Linearized Distflow power flow model allows for
too optimistic arrival rates since the Linearized Dist-
flow model overestimates the voltages in comparison
with the voltages given by the Distflow model. From
this, we observe that the allocated power to each park-
ing lot is higher under the Linearized Distflow than
the allocated power under the Distflow model. Higher
allocated power means faster charging. Hence, EVs
leave the parking lots faster and the mean number of
EVs charging is lower.
This statement is reinforced by Figure 3, where
the relative difference in the mean number of EVs
in the network in percentages between the Distflow
model and the Linearized Distflow model is plotted
versus the total arrival rate to the parking lots. It is still
assumed that N = 2, r = 0.1, K = 100 and ∆ = 0.05
for all of these lines. For the blue curve, we have
equal arrival rates for all parking lots. From Figure 3,
it is apparent that the relative difference in the mean
number of EVs between both power flow models is
below 5% for almost all total arrival rates to the net-
work. However, when the total arrival rate is close to
two times the critical arrival rate λ
c
(≈ 0.36), we have
already seen in Figure 2 that the mean number of cars
for both power flow models seem to reach their max-
imum capacity and that this happens slightly earlier
for the Distflow model than for the Linearized Dist-
flow model. This causes the high relative difference
in the mean number of EVs for both power flow mod-
els.
4.2 Variability of the Distribution of the
Total Arrival Rate
The previous section brings us naturally to the discus-
sion of adding variability to the distribution of the to-
tal arrival rate. Instead of assuming equal arrival rates
for all parking lots, we vary the fraction of EVs that
arrive at each parking lot for a wide range of the total
arrival rate to the network.
For all combinations of total arrival rates and frac-
tions of EVs that arrive at each parking lot, the heat
map of the mean number of cars has an interesting
structure. In Figure 4, we show the total mean num-
ber of EVs in the network as a function of the total
arrival rate and the fractions of EVs that arrive at each
parking lot. As we see in Figure 4, the mean num-
ber of EVs has a non-symmetric structure. When we
increase the fraction of EVs that arrive at parking lot
1 (and thus decrease the fraction of EVs that arrive
at parking lot 2) from the situation of equal arrival
Simulation Study for the Comparison of Power Flow Models for a Line Distribution Network with Stochastic Load Demands
171
(a) Mean number of cars.
(b) Mean charging time.
Figure 2: Performance measures vs. the individual arrival rate per parking lot for the Distflow model (dashed) and the
Linearized Distflow model (solid) at parking lot 1 (blue) and at parking lot 2 (red).
Figure 3: Relative difference in mean number of EVs be-
tween both power flow models.
Figure 4: Mean number of cars.
rates, the total mean number of EVs in the network
decreases faster than the total number of EVs in the
network decreases when we increase the fraction of
EVs that arrive at parking lot 2. This is natural given
the total available power that can be allocated to each
parking lot. Due to the power loss on the cables, the
available power that can be allocated to parking lot 1
is approximate twice the available power that can be
allocated to parking lot 2. We compare the following
two situations; one where we have a given number of
EVs charging at parking lot 1 and no EVs charging at
parking lot 2 (which corresponds to a situation where
the fraction of EVs that arrive at parking lot 1 is high),
and one where we have the same given number of EVs
charging at parking lot 2 and no EVs charging at park-
ing lot 1 (which corresponds to a situation where the
fraction of EVs that arrive to parking lot 2 is high).
Since the allocated power to parking lot 1 in the first
situation is higher than the allocated power to parking
lot 2 in the second situation, the mean number of EVs
at parking lot 1 tends to be smaller than the number
of EVs at parking lot 2. Moreover, if we consider a
fixed total arrival rate, e.g., λ
1
+ λ
2
= 0.8, the vari-
ability of the distribution of the total arrival rate has
a small influence on the mean number of EVs for a
wide range of the ratio of arrival rates. In Figure 5a,
where the relative difference between the total mean
number of EVs given any distribution of the total ar-
rival over both parking lots and the total mean number
of EVs given equal arrival rates to both parking lots is
plotted, we observe that this relative difference is be-
low 5% if the fraction of EVs that arrive at parking lot
1 range between 20% and 60%.
Another observation on the heat map of the mean
number of cars is that there is a clear distinction be-
tween networks that have reached their capacity or
not. In the blue region, the mean number of EVs
is relatively low. However, in the green and yellow
regions, the mean number of EVs is relatively high
ICORES 2023 - 12th International Conference on Operations Research and Enterprise Systems
172

(a) Relative difference for λ
1
+ λ
2
= 0.8.
(b) Approximation of critical arrival rates.
Figure 5: Observations based on the heat map of the mean number of cars.
and close to its maximum capacity, namely 200 EVs.
Moreover, the green region indicates a network where
the number of EVs charging at either one of the park-
ing lots reaches its capacity. The yellow region in-
dicates a network where the number of EVs at both
parking lots reaches its capacity.
In Figure 5b, we also plot a rough approximation
of the evolution of the critical arrival rates under both
power flow models as we vary the fraction of EVs that
arrive at parking lot 1 that we obtained as follows. As
can be seen in Figure 2, there is a steep increase in
the mean number of EVs and the mean charging time
of an EV at a certain point. Using a fine grid search,
we find the arrival rate for which the absolute differ-
ence between subsequent measurements in the mean
number of cars is the largest. In Figure 5b, we ob-
serve that as the fraction of EVs that arrive at park-
ing lot 1 increases, the critical arrival rates for both
power flow models decrease. Furthermore, the crit-
ical arrival rates for the Distflow model are always
below the critical arrival rates for the Linearized Dist-
flow model; a behavior that we observed in the setting
of equal arrival rates for both parking lots already.
Adding variability to the distribution of the total
arrival also influences the relative difference of the to-
tal mean number of EVs in the network between both
power flow models. This effect is observed in Figure
3, where we see that for a fraction of EVs that arrive
at parking lot 1 that deviates from the nominal situ-
ation of equal arrival rates, the maximal relative dif-
ference between the two power flow models is lower.
This has to do with parking lots reaching their maxi-
mum capacity. In the situation that we have different
arrival rates to the parking lots, the mean number of
EVs grows to maximum capacity only at one park-
ing lot while in the situation of equal arrival rates, the
mean number of EVs grows to maximum capacity at
both parking lots. The relative difference in the mean
number of EVs for both power flow models is highest
in these cases and therefore the maximal relative dif-
ference between the Linearized Distflow and the Dis-
tflow model is highest in the situation of equal arrival
rates. Furthermore, also for other distributions of the
total arrival rate than equal arrival rates to both park-
ing lots (red and yellow curves), we observe that the
relative difference is below 5% for almost all total ar-
rival rates to the network, except around those values
for the total arrival rate where we turn from a network
with a relatively low mean number of EVs to a net-
work with a relatively high number of EVs. For such
values, we could compute the critical arrival rate for
the Linearized Distflow model and adjust by a small
percentage to compensate for ignoring power losses,
since the critical arrival rates under both power flow
models are close to each other, see Figure 5b.
In summary, the performance of both power flow
models is approximately the same. Simulation results
show that for a wide range of total arrival rates to the
network the relative difference in the mean number of
EVs between the Distflow model and the Linearized
Distflow model is below 5%. Furthermore, the critical
arrival rates under both power flow models are close
to each other. Moreover, we can say that the variabil-
ity in the distribution of the total arrival to parking
lots for heavily loaded instances, as long as the frac-
tion of EVs that arrive at parking lot 1 range between
20% and 60%, does not influence the performance of
the network much, in the sense that the mean num-
ber of EVs and the mean charging time of an EV are
comparable to the mean number of EVs and the mean
charging time of an EV in the case where the arrival
rates to all parking lots are the same, respectively.
Simulation Study for the Comparison of Power Flow Models for a Line Distribution Network with Stochastic Load Demands
173

REFERENCES
Aveklouris, A., Vlasiou, M., and Zwart, B. (2019). A
stochastic resource-sharing network for electric vehi-
cle charging. IEEE Transactions on Control of Net-
work Systems, 6(3):1050–1061.
Baran, M. E. and Wu, F. F. (1989a). Optimal capacitor
placement on radial distribution systems. IEEE Trans-
actions on Power Delivery, 4(1):725–734.
Baran, M. E. and Wu, F. F. (1989b). Optimal Sizing of
Capacitors Placed On a Radial Distribution System.
IEEE Transactions on Control of Network Systems,
4(1):735–743.
Cao, Y., Wei, W., Wang, J., Mei, S., Shafie-Khah, M., and
Catalao, J. P. (2019). Capacity Planning of Energy
Hub in Multi-carrier Energy Networks: A Data-driven
Robust Stochastic Programming Approach. IEEE
Power and Energy Society General Meeting, (1):3–14.
Carvalho, R., Buzna, L., Gibbens, R., and Kelly, F. (2015).
Critical behaviour in charging of electric vehicles.
New Journal of Physics, 17(9):95001.
Chen, C., Wang, J., Qiu, F., and Zhao, D. (2016). Re-
silient Distribution System by Microgrids Formation
after Natural Disasters. IEEE Transactions on Smart
Grid, 7(2):958–966.
Christianen, M., Cruise, J., Janssen, A., Shneer, S., Vla-
siou, M., and Zwart, B. (2022). Comparison of
stability regions for a line distribution network with
stochastic load demands. Preprint available at:
https://arxiv.org/abs/2201.06405.
de Hoog, J., Muenzel, V., Jayasuriya, D. C., Alpcan, T.,
Brazil, M., Thomas, D. A., Mareels, I., Dahlenburg,
G., and Jegatheesan, R. (2014). The importance of
spatial distribution when analysing the impact of elec-
tric vehicles on voltage stability in distribution net-
works. Energy Systems, 6(1):63–84.
Deb, S., Tammi, K., Kalita, K., and Mahanta, P. (2018). Im-
pact of electric vehicle charging station load on distri-
bution network. Energies, 11(1):1–25.
Farivar, M., Chen, L., and Low, S. (2013). Equilibrium
and dynamics of local voltage control in distribution
systems. Proceedings of the IEEE Conference on De-
cision and Control, pages 4329–4334.
Hoogsteen, G., Molderink, A., Hurink, J. L., Smit, G. J.,
Kootstra, B., and Schuring, F. (2017). Charging elec-
tric vehicles, baking pizzas, and melting a fuse in
Lochem. CIRED - Open Access Proceedings Journal,
2017(1):1629–1633.
Huang, H., Chung, C. Y., Chan, K. W., and Chen, H. (2013).
Quasi-Monte Carlo based probabilistic small signal
stability analysis for power systems with plug-in elec-
tric vehicle and wind power integration. IEEE Trans-
actions on Power Systems, 28(3):3335–3343.
Kersting, W. (2018). Distribution System Modeling and
Analysis. CRC Press, fourth edition.
Khatod, D. K., Pant, V., and Sharma, J. (2006). A novel ap-
proach for sensitivity calculations in the radial distri-
bution system. IEEE Transactions on Power Delivery,
21(4):2048–2057.
Li, R., Wei, W., Mei, S., Hu, Q., and Wu, Q. (2019). Partic-
ipation of an Energy Hub in Electricity and Heat Dis-
tribution Markets: An MPEC Approach. IEEE Trans-
actions on Smart Grid, 10(4):3641–3653.
Low, S. H. (2014). Convex relaxation of optimal power
flow - Part {I}: Formulations and equivalence. IEEE
Transactions on Control of Network Systems, 1:15–27.
Molzahn, D. and Hiskens, I. (2019). A Survey of Relax-
ations and Approximations of the Power Flow Equa-
tions. A Survey of Relaxations and Approximations of
the Power Flow Equations, 4(1):1–221.
Tan, S., Xu, J. X., and Panda, S. K. (2013). Optimization of
distribution network incorporating distributed genera-
tors: An integrated approach. IEEE Transactions on
Power Systems, 28(3):2421–2432.
Tonso, M., Morren, J., De Haan, S. W., and Ferreira, J. A.
(2005). Variable inductor for voltage control in dis-
tribution networks. 2005 European Conference on
Power Electronics and Applications, 2005.
Ul-Haq, A., Cecati, C., Strunz, K., and Abbasi, E. (2015).
Impact of electric hehicle charging on voltage unbal-
ance in an urban distribution network. Intelligent In-
dustrial Systems, 1(1):51–60.
van Westering, W. and Hellendoorn, H. (2020). Low voltage
power grid congestion reduction using a community
battery: Design principles, control and experimental
validation. International Journal of Electrical Power
and Energy Systems, 114:105349.
Wang, Z., Chen, B., Wang, J., Kim, J., and Begovic,
M. M. (2014a). Robust optimization based optimal
DG placement in microgrids. IEEE Transactions on
Smart Grid, 5(5):2173–2182.
Wang, Z., Chen, H., Wang, J., and Begovic, M. (2014b).
Inverter-less hybrid voltage/var control for distribu-
tion circuits with photovoltaic generators. IEEE
Transactions on Smart Grid, 5(6):2718–2728.
Yeh, H. G., Gayme, D. F., and Low, S. H. (2012). Adap-
tive VAR control for distribution circuits with photo-
voltaic generators. IEEE Transactions on Power Sys-
tems, 27(3):1656–1663.
Yuan, W., Wang, J., Qiu, F., Chen, C., Kang, C., and Zeng,
B. (2016). Robust Optimization-Based Resilient Dis-
tribution Network Planning Against Natural Disasters.
IEEE Transactions on Smart Grid, 7(6):2817–2826.
Zhang, Y., Song, X., Gao, F., and Li, J. (2016). Re-
search of voltage stability analysis method in distribu-
tion power system with plug-in electric vehicle. Asia-
Pacific Power and Energy Engineering Conference,
APPEEC, 2016-Decem(51177152):1501–1507.
ICORES 2023 - 12th International Conference on Operations Research and Enterprise Systems
174
