
Opportunistic Maintenance of Multi-Component Systems Under
Structure and Economic Dependencies: A Healthcare System Case Study
Abdelhamid Boujarif
1 a
, David W. Coit
2 b
, Oualid Jouini
1 c
, Zhiguo Zeng
1 d
and Robert Heidsieck
3
1
Industrial Engineering Laboratory (LGI) CentraleSup
´
elec, Paris-Saclay University, Gif-sur-Yvette, France
2
Department of Industrial and Systems Engineering, Rutgers University, U.S.A.
3
General Electric Healthcare, 283 Rue de la Mini
`
ere, 78530 Buc, France
Keywords:
Multi-Component Systems, Opportunistic Maintenance, Reliability, Economic Dependence, Structure
Dependence, Genetic Algorithm.
Abstract:
This paper presents an opportunistic maintenance model for a multi-component system. We develop a model
that considers the ages and residual values of the non-failed components and component failure time distri-
butions. We also consider the structural and economical dependency between the items by favoring grouped
over individual replacement to reduce operation costs. We use a genetic algorithm to derive the optimal op-
portunistic maintenance plan by minimizing the long-run operational cost considering both maintenance cost
and potential penalty costs due to failure in the future. The model recommends additional preventive opera-
tions in cases where the reliability does not satisfy the quality condition and to reduce the long-run operational
cost. A sensitivity analysis shows that the optimal decision is mainly affected by the logistic cost, the interest
rate, and the planning horizon. The model’s performance has been evaluated using several real case problems,
demonstrating that the proposed method is very efficient.
1 INTRODUCTION
After-sale services are essential in today’s business
world (Zhang et al., 2019). However, only companies
with efficient operations can profit from their client
services (El Garrab et al., 2020). The key to a success-
ful service is to design maintenance activities care-
fully, as it can reduce the system’s downtime and en-
ables the desired performance.
Different Maintenance strategies are developed to
optimize the reparation process. The corrective strat-
egy (CM) performs maintenance activity only after a
system component fails, while under the preventive
strategy (PM), a maintenance plan of a system com-
ponent is made according to the operating rules and
could lead to the replacement of non-failed items in
a preventive way. However, the availability of spare
parts is the primary key to ensure a high mainte-
nance service level. Thus, their procurement may of-
a
https://orcid.org/0000-0003-0641-9470
b
https://orcid.org/0000-0002-5825-2548
c
https://orcid.org/0000-0002-9498-165X
d
https://orcid.org/0000-0003-4937-4380
ten cause critical issues, especially if they are expen-
sive and when systems require high-reliability (Pas-
cual et al., 2017). To ensure spare parts availabil-
ity, many companies adopt a closed-loop supply chain
strategy where the failed parts, called Line Replace-
able Units (LRU), are recovered from the field at sys-
tem failure and returned to their repair centers. The
repaired LRUs are used later to replace defective ones
in other systems. Therefore, the reparation event can
be viewed as an opportunity for preventive operations
since the failed parts must be returned to the repair
center. Replacing only the defective components in
LRU may shorten the spare part’s lifetime after main-
tenance because of the aging of the non-failed com-
ponents. As a result, using this unit may increase the
probability of the system’s failure and lead to addi-
tional logistic costs and loss of clients. Thus, oppor-
tunistic maintenance is the best strategy to provide
high-quality spare parts with minimum costs in this
closed-loop supply chain.
This paper presents an opportunistic replacement
model, which seeks near-optimal decision at a deci-
sion point by explicitly considering the ages and the
remaining life of the non-failed components, compo-
158
Boujarif, A., Coit, D., Jouini, O., Zeng, Z. and Heidsieck, R.
Opportunistic Maintenance of Multi-Component Systems Under Structure and Economic Dependencies: A Healthcare System Case Study.
DOI: 10.5220/0011669800003396
In Proceedings of the 12th International Conference on Operations Research and Enterprise Systems (ICORES 2023), pages 158-166
ISBN: 978-989-758-627-9; ISSN: 2184-4372
Copyright
c
2023 by SCITEPRESS – Science and Technology Publications, Lda. Under CC license (CC BY-NC-ND 4.0)

nent failure time distributions, and the scale of the
economy. We use a genetic algorithm to derive the
optimal maintenance plan by minimizing the long-run
operational cost considering both maintenance and
potential penalty costs due to failure in the future. The
model recommends additional preventive operations
in cases with high failure risk. A sensitivity analysis
shows that the optimal decision is mainly affected by
the interest rate and the planning horizon. We evalu-
ated the model’s performance using several real case
problems based on real data from General electric
Healthcare MR machines.
An opportunistic replacement policy (OM) is a
particular type of preventive replacement in which
working components of complex equipment are re-
placed simultaneously with a failed one when a down-
time opportunity has been created (Haque et al.,
2003). Different criteria are developed for compo-
nents’ selection. The age replacement policy is based
on replacing parts when it has achieved their esti-
mated lifetime (Jiang and Ji, 2002). In (Wang et al.,
2021), the authors propose an imperfect opportunistic
maintenance model for two unit series system consid-
ering random repair time. When a unit fails, the other
is maintained when it meets the required age. The ob-
jective is to minimize the average maintenance cost
by optimizing the thresholds of opportunistic mainte-
nance. (Li et al., 2021) studies a maintenance strategy
for wind farms by considering degradation failures
and random incidents. An operating part will only
be replaced if it reaches its critical age. However,
these strategies become complicated if implemented
in a multi-component system, even if it maximizes the
usage of a component. As the number of components
increases, more maintenance activities are conducted,
which may disturb production. Another issue is that
components may fail before their lifetime because of
environmental and external conditions.
Different approaches are developed to consider
the dependency between components for maintenance
planning. The block replacement strategy (BRP) sug-
gests that maintenance activities are conducted on a
block or a group of components. In (Nakagawa and
Zhao, 2013), the authors compared between different
modified BRP models using renewal process where
replacements are executed at constant and random
variable times to minimize the expected cost rates.
They analyze when the random replacements would
be better than the standard BRP. In (Rebaiaia and
Ait-Kadi, 2022), the authors build a model to group
parts based on their mean remaining useful life. In
(Laggoune et al., 2009), the authors focus on main-
tenance cost and suggest that deterioration-based de-
cisions can be included to solve the cost issue. The
model considers economic dependency between com-
ponents by replacing multiple units to minimize sys-
tem downtime. The solution is found by analyzing
the cost or benefit balance of the component that can
be preventively replaced during CM activities. In
(Satow et al., 2000), a model is developed to maxi-
mize the global reliability of n subsystem of k parallel
components that follow Weibull distributions while
considering age conditions and time spent for repa-
ration. Each k parallel items are replaced simulta-
neously. Nevertheless, the BRP policy increases the
wasted components due to the early replacement.
Other researchers evaluate the decision based on
the operation costs. Saranga estimates how cost-
effective opportunistic maintenance is compared to
a later grounding (Saranga, 2004). Using a genetic
algorithm, the model computes the remaining useful
life cost, the down cost, and the cost of risk for each
component individually. In (Nilsson et al., 2009),
the authors study maintenance plan for power plants.
Their results prove the impact of discount interest on
maintenance plan. However, to simplify the model,
they use a discrete-time space to calculate the cost
of failure. In (Haque et al., 2003), the authors de-
velop an optimization model to maximize the net ben-
efit gained from an opportunistic replacement. The
model calculates the system’s residual life with and
without opportunistic operations. The benefit is cal-
culated from savings made in replacement, residual
life, labor time, and the profit of increasing lifetime.
A genetic algorithm was used to solve the model.
It may be realized from the above review that
most of the mathematical models developed so far
are either limited in scope or burdened with exces-
sive computation, especially if the part to repair con-
sists of many deteriorating components. In addition,
few models consider the time needed to disassemble
a component. In addition, because of inflation, the
real value of failure cost may be discounted in the
future, especially for systems with a relatively long
mean useful lifetime.
The formulation of the model is described in Sec-
tion 2. In Section 3, we present a case problem based
on real data. The description of the genetic opera-
tors and the optimization technique is also described
in Section 3. We discuss the results in Section 4. Fi-
nally, Section 5 concludes the paper and highlights
some future research.
Opportunistic Maintenance of Multi-Component Systems Under Structure and Economic Dependencies: A Healthcare System Case Study
159

2 MODELING AND PROBLEM
FORMULATION
We consider a closed-loop supply chain of spare parts
where the failed units are recovered from the client’s
system and shipped back to the repair center for repa-
ration. The unit can be repaired only by replacing the
failed items. There are two possible choices for each
functional component: replace it preventively when
another component fails or use it without preventive
replacement. Under the second decision, the item will
either fail before the other components and lead to a
system failure or survive until another fails. We can
see that the optimization problem is dynamic because
each failure occasion creates a decision point. How-
ever, as soon as a replacement is made, one life cy-
cle for a component is ended, and a new one starts
with an identical time to failure distribution. The pro-
cess continues until we finally dispose of the LRU.
Thus, unlike many models in the literature where the
opportunity for preventive replacement is undefined,
we consider a one-time window to decide whether
to replace the non-failed components. This decision
should be based on the unit’s reliability after repara-
tion, the waste of the replaced components’ residual
lifetime, and the structural dependence between com-
ponents.
Structural dependence means that components
structurally form a connected set so that maintenance
of a part requires disassembling the others. A disas-
sembly sequence exists between elements in the sys-
tem, so dismantling all the preceding components in a
disassembly sequence is necessary to reach a particu-
lar element for maintenance (Dinh et al., 2020). Dis-
assembly operation may affect maintenance duration
and the degradation level of the disassembled compo-
nents.
Therefore, the objective is to select a set of com-
ponents that are easy to replace preventively, to pro-
vide repaired parts with a minimum failure risk during
the planning horizon of T years and a minimum waste
of residual lifetime. A minimum required reliability
can also be considered as a constraint quality.
Let us define the following notations:
• ζ = [1, 2, 3, ..n]: set of part components,
• Cost
c
: price of component c,
• M
c
: the average lifetime of component c,
• RV
c
=
cost
c
M
c
: waste weight of component c,
• LC: labor cost,
• Cost
0
: logistic cost (shipping cost to replace the
LRU with a new one at the client site),
• τ
c
: disassembling time for component c,
• a
c
: age of component c,
• R
c
(t): reliability function of component c,
• f
c
(t): probability density function of failure time
for component c,
• R
sys
(t;a
1
, a
2
, .., a
n
) = h(R
1
(t;a
1
), ..., R
n
(t;a
n
)):
reliability function of the system as a function of
components reliability,
• f
sys
(t;a
1
, a
2
, .., a
n
): probability density function
of system’s failure,
• T : planning horizon,
• r: interest rate,
• D = (D
i j
)
CXC
: disassembly matrix for the system,
• s
c
: state of component c,
s
c
=
1, if component c is in a failing state
0, otherwise
.
One of the characteristics of spare parts reparation is
that the components may have different ages with a
large variance; the fragile ones usually would have
young ages, while the robust items would be an-
cient. Therefore, estimating the unit reliability is not
straightforward. We propose to express the unit’s re-
liability R
sys
as a function of components’ reliabil-
ity and ages. For example, for a series units, the
reliability of the part can be expressed as R
sys
(t) =
Q
c∈ζ
R
c
(t;a
c
).
We then formulate the optimization problem as
follows.
Decision Variables: we define the binary decision
variable x
c
for each component c, with
x
c
=
1, if component c is replaced preventively
0, otherwise
Constraints: A failed component must be replaced
to restore the system to its operating state. Thus, we
can not select a part with a state variable s
c
= 1 for
opportunistic maintenance. As a result, we define the
relation between the decision variable x
c
and the state
variable s
c
as follows.
x
c
+ s
c
≤ 1, ∀c ∈ ζ (1)
Objective Function: An optimal solution mini-
mizes the total cost of maintenance, denoted by TC.
The model would suggest not replacing any compo-
nent preventively when opportunistic maintenance is
inefficient.
The total maintenance cost consists of four com-
ponents. The first cost, denoted by C
r
, is the sum of
the newly-bought components’ price to replace the se-
lected units. It includes the corrective replacements
ICORES 2023 - 12th International Conference on Operations Research and Enterprise Systems
160

as well as the preventive ones and can be calculated
as given in Eq.2.
C
r
=
X
c∈ζ
(x
c
+ s
c
) ×Cost
c
, (2)
The second cost, denoted by C
w
, penalizes for the un-
used remaining life of the items to be replaced pre-
ventively. It is given by
C
w
=
X
c∈ζ
x
c
×
RV
c
R
sys
(0;a
1
(1 − s
1
), .., a
n
(1 − s
n
))
(3)
×
Z
+∞
0
t f
c
(t;a
c
)dt.
The waste weight of a component, denoted by RV
c
,
monetizes the useful life of an item based on its pur-
chase price. Eq.3 represents the loss value of the se-
lected items since a portion of their life is lost for op-
portunistic activity.
The third component, denoted by C
f
, represents
the expected cost of failure during the planning hori-
zon. When a failure occurs, the logistic cost Cost
0
must be counted. However, to compare the future
payment to the present time, its present value must be
calculated. It means the amount of money that should
be deposited into the bank now at a specific interest
rate r to pay for an outlay C after duration T . At time
t ≤ T , the conditional probability of failure after repa-
ration can be expressed as follows:
P(T
sys
< t) =
F
sys
(t; a
1
(1 − (x
1
+ s
1
)), .., a
n
(1 − (x
n
+ s
n
))
R
sys
(0;a
1
(1 − (x
1
+ s
1
)), .., a
n
(1 − (x
n
+ s
n
))
.
(4)
For the replaced components correctively or oppor-
tunistically (x
c
+ s
c
= 1), their age would be restored
to zero, while it won’t change for the other compo-
nents. So for a small variation of time, this probability
can be expressed using the calculated probability den-
sity function (pdf ) of the system f
sys
and the present
value of the logistic cost is Cost
0
× (1 + r)
−t
. Thus,
the total present value of the expected cost of failure
during the planning horizon, C
f
, can be expressed as
C
f
=
Cost
0
R
sys
(0;a
1
(1 − (x
1
+ s
1
)), .., a
n
(1 − (x
n
+ s
n
))
×
Z
T
0
f
sys
(t; a
1
(1 − (x
1
+ s
1
)), .., a
n
(1 − (x
n
+ s
n
))
(1 + r)
t
dt.
(5)
The last cost component, denoted by C
L
, reflects the
needed time to repair the part. We use an approach
developed by (Dinh et al., 2020) to calculate the dis-
assembling time for a component group. Based on the
structure connection between components, the disas-
sembly matrix D is constructed. The elements of the
matrix are binary coefficients. The parameter D
i, j
= 1
if component j must be disassembled to reach compo-
nent i for maintenance. The cumulative disassembling
time of a component c, denoted by τ
D
c
, can be defined
as the sum of disassembling times for all the compo-
nents on the path of disassembly (Eq.6).
τ
D
c
=
X
k∈ζ
τ
k
× D
c,k
. (6)
For a group of components, there may be some in-
tersections between the disassembly path of different
items. As a result, the disassembly duration of the in-
tersection nodes must be counted only once, even if
it appears on several ones. Eq.7 gives the total disas-
sembly time, denoted by τ
group
, of the replaced com-
ponents. We have
τ
group
=
X
c∈ζ
(s
c
+ x
c
) × τ
D
c
(7)
−
X
c∈ζ
τ
D
c
× max(
X
k∈ζ
(s
k
+ x
k
) × D
k,c
− 1, 0),
Where the first term represents the total disassembly
duration of all replaced components when they are re-
placed separately. The second term is the time sav-
ing due to intersections among the disassembly paths.
Note that
P
k∈ζ
(s
k
+ x
k
) × D
k,c
represents the total
number of components in the replaced group that have
component c on their disassembly path. In case there
is no intersection, the second part will be equal to
zero. Therefore, the total labor cost is the total repa-
ration time times the labor cost per time unit, i.e,
C
L
= 2 × LC × τ
group
. (8)
Finally, the objective function can be written as
minTC = C
r
+C
w
+C
f
+C
L
. (9)
3 INDUSTRIAL CASE STUDY
We propose in this section an application of the de-
veloped model based on a real industrial case that we
describe below. First, we present the historical data
and the approach to extract the reliability functions.
Then, we explain the solution technique used to solve
the optimization problem.
GE Healthcare is the medical branch of conglom-
erate General Electric, one of the global leaders in
sales and services of medical systems, notably those
of medical imaging. Because of the criticality of
its products (medical devices) and the technological
Opportunistic Maintenance of Multi-Component Systems Under Structure and Economic Dependencies: A Healthcare System Case Study
161

characteristics of its components, GE Healthcare of-
fers a maintenance service to its customers. The ser-
vice’s main objective is to ensure its products’ relia-
bility (reducing the failure rate occurrence) while re-
ducing unavailability simultaneously. Global service
and operations (GSRO) department within the com-
pany is responsible for service parts. This depart-
ment covers parts supply chain management, ware-
house management, choice of transport, inventory
management policies throughout the network, and re-
pair strategies for defective parts.
3.1 Experiments Design
We study the impact of the developed strategy on a
critical LRU for MR machines. We consider spare
parts composed of 11 components in series. Figure 1
and Table 1 represent the physical structure between
components and the disassembling time for each one,
respectively. For example, components 4, 5, and 7
must be disassembled before component 10 is reached
for replacement.
Figure 1: System’s structure.
Table 1: Components’ dismantling time.
Component C1 C2 C3 C4 C5 C6
Disassembling
time (U.T)
3 1 1.5 0.2 2 4.5
Component C7 C8 C9 C10 C11
Disassembling
time (U.T)
9 4.5 1 1 1
GE spare parts supply chain is so particular that
it makes gathering parts’ lifetime challenging. De-
pending on forecasted demand and the stock level of
warehouses, one part can be shipped to different ware-
houses in different countries before being installed on
a system. It can also be used as a test unit on vari-
ous systems for a few hours before reaching its des-
tination. In addition, the same part can be repaired
multiple times in different centers.
Under these conditions, using shipments’ transac-
tions, we use a tracing system to reconstruct parts’
history. We build a timeline using the collected trans-
actions set linked to the part. Finally, we extract
installation and failure dates. Based on the calcu-
lated age of the spare parts and the number of re-
pairs, we estimate the age of components using the
replacements record. Component age is restored to
0 if replaced during reparation, while we accumu-
late the operating times if the component did not fail.
We construct the lifetime distribution for each com-
ponent separately by fitting different known distribu-
tions and selecting the one with the minimum value
of Akaike information criterion (AIC) metric. For a
statistical model of some data with a number k of es-
timated parameters and a maximized value L of the
likelihood function, the AIC value is the following
AIC = 2k − 2ln(L). We model parts’ reliability as the
product of component reliability distributions.
3.2 Solution Approach
We use genetic algorithm to get a near-optimal solu-
tion for the opportunistic strategy. This heuristic has
been widely applied in many cases to solve nonlinear
problems. It is characterized by balancing exploita-
tion and exploration in the search space. This bal-
ance is strongly affected by strategy parameters such
as population size, maximum generation, crossover
probability, and mutation. The procedure for the so-
lution of the opportunistic replacement model is de-
scribed below:
• We select the possible solutions based on two con-
ditions :
– The failed components should not be replaced
opportunistically to satisfy constraint 1.
– Since the main objective of the company is to
minimize the early failure of the repaired units,
we define the constraint below to set the num-
ber of failures before 6 months less than 10%.
R
sys
(180;a
1
(1 − (x
1
+ s
1
)), ..)
R
sys
(0;a
1
(1 − (x
1
+ s
1
)), ..)
≥ 0.9. (10)
• The classic genetic algorithm chooses a single
fixed mutation rate for all solutions, regardless of
their fitness values. As a result, mutations can
disturb good and bad chromosomes equally. We
use the adaptive technique with two fixed proba-
bilities p
max
= 1 for the low-quality solutions and
p
min
= 0.4 for the good ones. The bad solutions
have a fitness value less than the population’s av-
erage, while the high-quality chromosomes are
those with a higher value.
• We terminate the algorithm evolution if the fitness
does not change for 25 consecutive generations.
• To minimize the fitness function computational
time, we save the evaluated individuals’ score so it
can easily be extracted if the solution has already
been evaluated in previous iterations.
ICORES 2023 - 12th International Conference on Operations Research and Enterprise Systems
162
4 RESULTS AND ANALYSIS
Table 2 represents the purchase price for new compo-
nents and their average useful life Mul in Unit of time
(U.T). We consider logistic cost equal to 750 Unit of
Cost (U.C) and an interest rate of 15%. To evaluate
the model, we define two metrics: the net benefit and
benefit ratio, to compare the CM strategy to the op-
portunistic one. The net benefit, denoted by NB, is
the difference between the cost TC
0
of the corrective
solution (x
c
= 0, ∀c ∈ ζ) and the best solution, denoted
by TC
best
. We calculate the benefit ratio as the saved
ratio of the total corrective cost,
NB
TC
0
.
Table 2: Costs parameters.
Component C1 C2 C3 C4 C5 C6
Component
cost (U.C)
22 24 6 43 140 2
Mul (U.T) 71k 22k 54k 44k 1.5k 16k
Component C7 C8 C9 C10 C11
Component
cost (U.C)
34 23 6 9 8
Mul (U.T) 68k 183k 37k 58k 24k
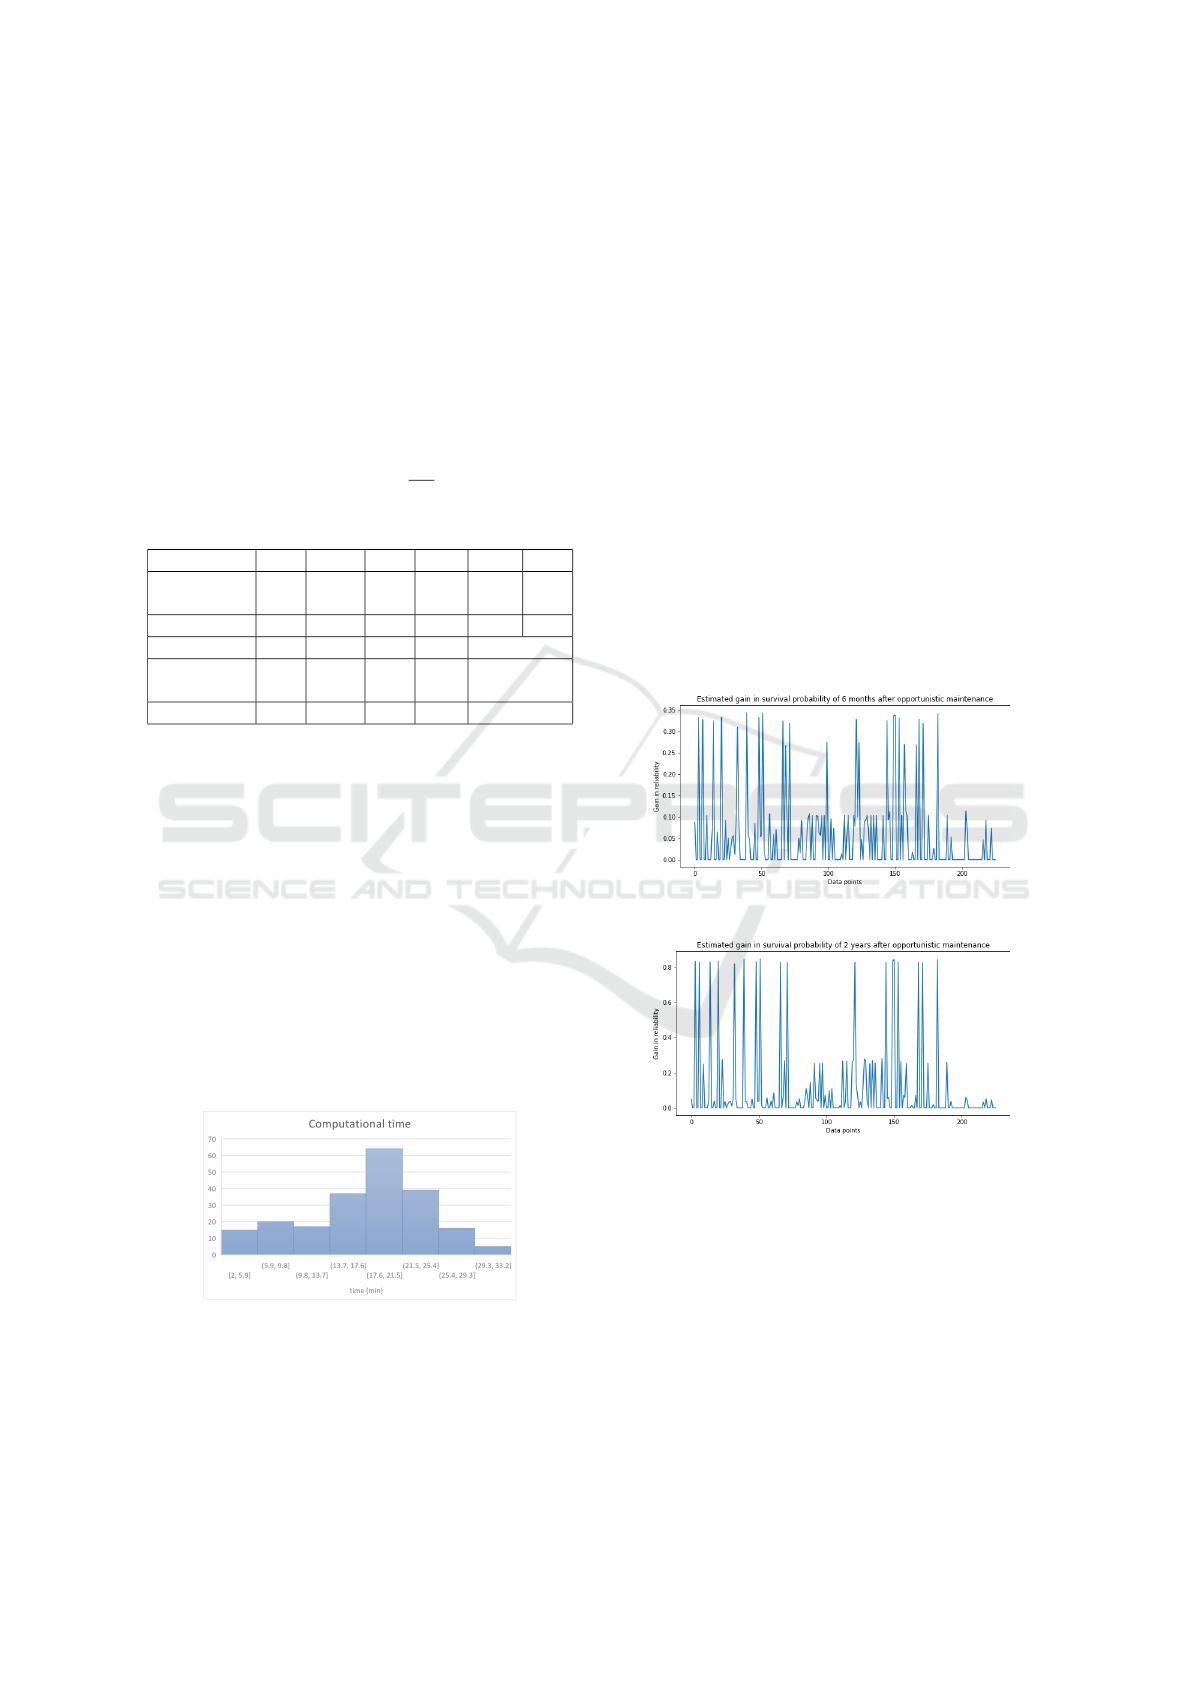
4.1 Computational Time
We have collected reparation data for 260 LRUs with
different ages and multiple sets of failed components.
Each part is composed of 11 components in series.
We calculate the ages of the components for all the
items. We apply the optimization model on the se-
lected parts for a planning horizon of 2 years. De-
pending on the set of possible solutions, the compu-
tational time can vary from 1 min to 30 min. Fig-
ure 2 represents the computational time distribution.
Unlike weak LRU, parts with higher strength (good
global reliability) have many possible solutions. As a
result, computing the best solutions usually takes 15
to 20 min.
Figure 2: Computational time distribution.
4.2 Impact on Parts Useful Life
In general, the developed strategy improves spare
parts reliability. Figures 3 and 4 compare the esti-
mated conditional reliability before and after conduct-
ing opportunistic replacements. They represent, re-
spectively, the gain in survival probability of 6 months
and 2 years after maintenance operations. Each data
point corresponds to a unique spare part with de-
fined ages for its components. It represents the dif-
ference between part’s reliability under CM and OM
strategies. The improvement in survival probability is
larger if it is evaluated at the end of the planning hori-
zon. In fact, the model suggests opportunistic replace-
ments for all parts with low reliability. As a result,
most of the reliability after two years of the simulated
parts becomes higher than 0.5. The model also recom-
mends minimum replacements for old units to satisfy
the quality constraint. In some cases, parts reliability
can be improved by 0.5 points just by changing few
sets of components.
Figure 3: Gain in survival probability of 6 months.
Figure 4: Gain in survival probability of 2 years.
Consequently, the additional replacements help
improve the remaining lifetime of the repaired parts.
Figure 5 represents the gain in Residual life after op-
portunistic maintenance. It is the difference between
the estimated remaining useful life before and after
adopting the OM strategy. For some parts, chang-
ing some components opportunistically can add more
than one year to their lifetime.
Opportunistic Maintenance of Multi-Component Systems Under Structure and Economic Dependencies: A Healthcare System Case Study
163
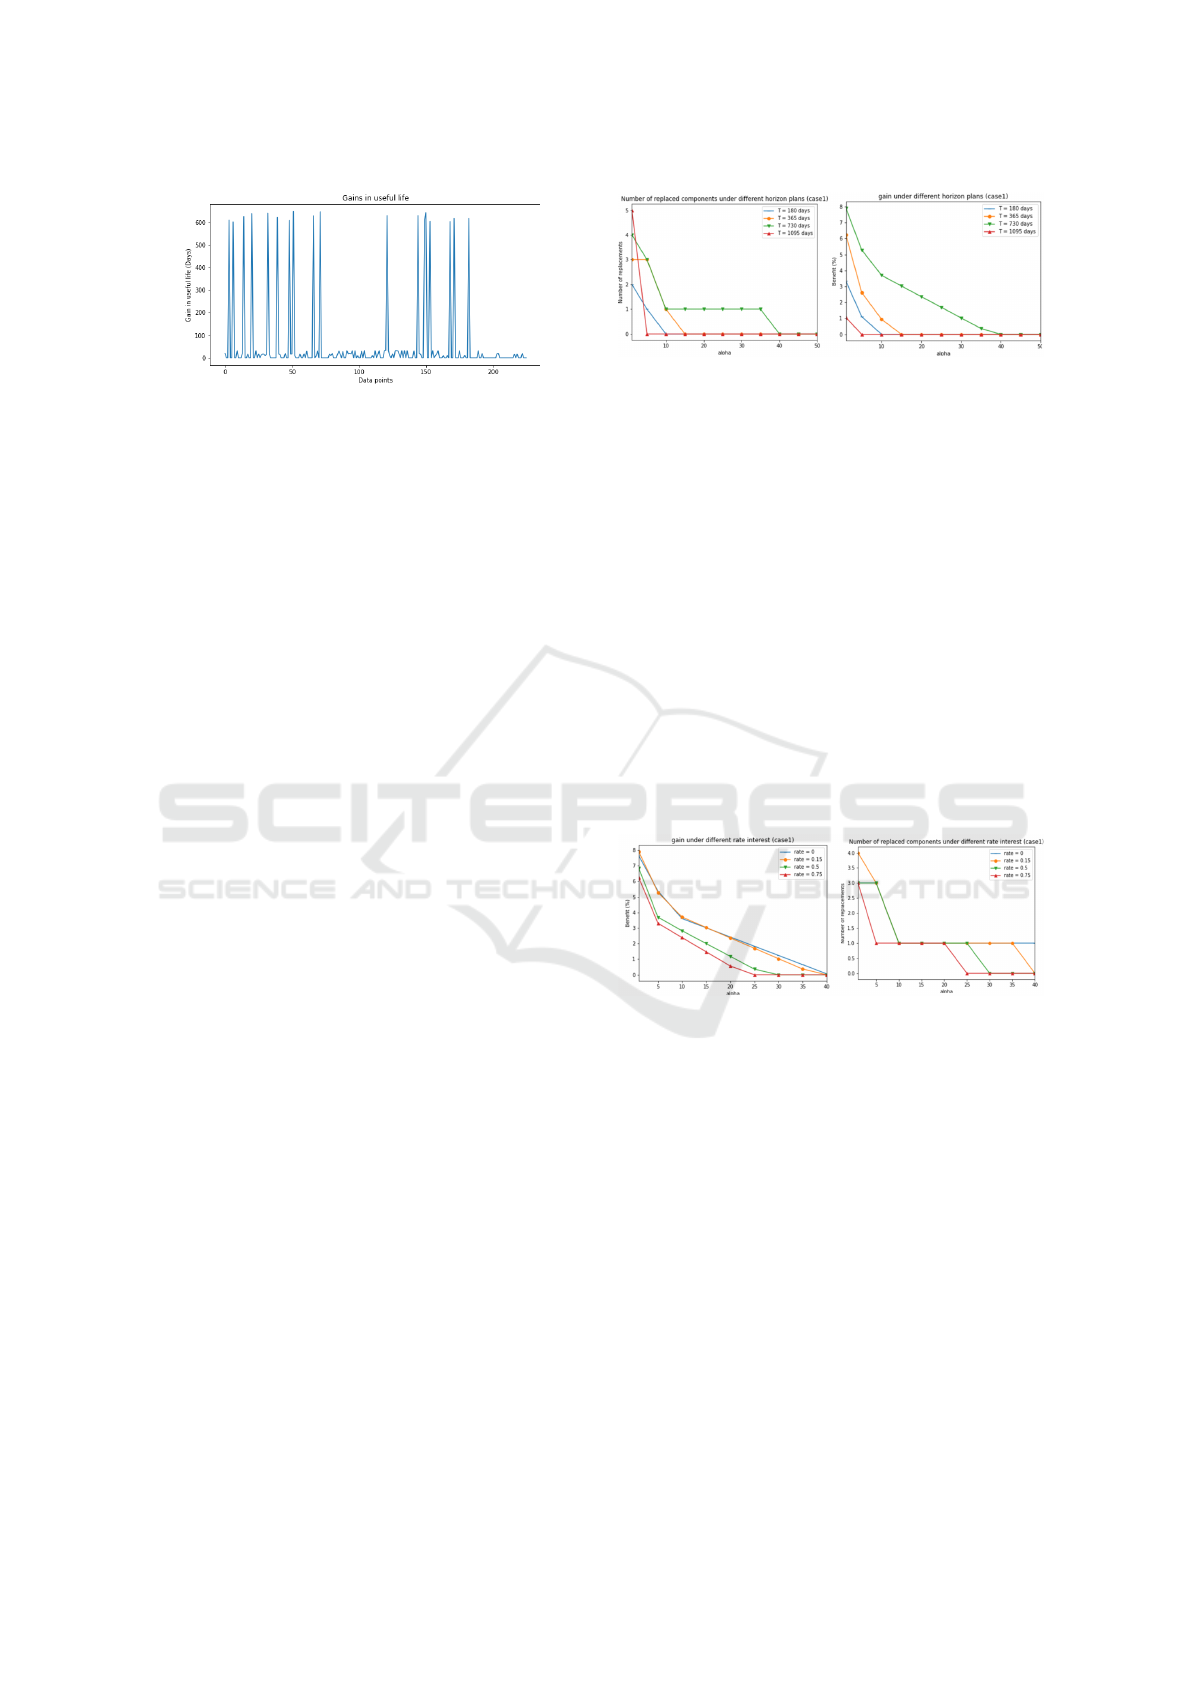
Figure 5: Estimated gain in parts lifetime.
4.3 Cost Analysis
In this section, we analyze the efficiency of the sug-
gested replacements using the defined metrics (net
benefit and benefit ratio). We consider 3 cases with
different component’s average age. Table 3 summa-
rizes the components’ ages and the probability of sur-
viving after the first six months. Table 4 represents
the decisions taken for each case. A value equal to 1
means the preventive replacement of the component.
Columns TC and TC
0
are the total cost of the best
and corrective solutions, respectively. NB is the ben-
efit defined at the beginning of this section.
Based on Table 4, all the decisions taken outper-
form the corrective strategy. The net benefit increases
with the risk of failure. The more the part is likely
to fail, the more consistent OM decisions are. In the
first case, the corrective operations satisfy the defined
quality constraint. However, the model chooses to
preventively change the cheapest and easiest compo-
nents to reduce the failure cost. In the second case, the
model selects linked components to replace, to maxi-
mize the part’s reliability and minimize the labor cost.
In the third case, the model recommends changing the
most critical components, C5 and C11, since their RV
is low compared to the other items.
4.4 Sensitivity Analysis
Sensitivity to the Planning Horizon T . Table 5 re-
sults lead to a twofold conclusion . First, the total cost
increases over time because of the failure risk. The
longer the horizon plan and the lower chance of sur-
vival. Thus, the model selects many components to
improve part’s reliability. In addition, increasing the
planning horizon makes the token decision more con-
sistent than the corrective approach. Second, setting a
very long horizon reduces the solution’s efficiency. If
the remaining useful life of many components is less
than the horizon plan, it would be better to change the
planning duration to minimize the number of replace-
ments and waste costs.
Sensitivity to the Waste Cost. To analyze the waste
cost impact on the decision, we add a coefficient α to
Figure 6: Impact of waste cost on maintenance decision.
Eq.9. The new total cost is expressed now as TC =
C
r
+ α ×C
w
+C
f
+C
L
.
From Figure 6, we notice that the number of re-
placed components decreases with the rise of α. The
cheaper the components, the higher the number of
replacements. It can easily be understood because
cheap items make it profitable to replace them preven-
tively to improve the part’s reliability. Nevertheless,
when the total costs of the components are compara-
ble with the logistic costs Cost
0
, the net benefits of the
chosen decision may drop to less than zero.
Sensitivity to Interest Rate r. As illustrated in Fig-
ure 7, the higher the rate r, the lower the number of
replacements for a fixed time horizon and coefficient
α. It can be explained because a high rate means we
focus on the present time and do not care much about
the future. As a result, the solution chosen is more
conservative than the one under a lower interest rate.
Figure 7: Impact of interest rate on maintenance decision.
5 CONCLUSION
In this paper, we developed a model for opportunis-
tic maintenance selection. The model considers the
age of the components, their residual value, and the
structural dependence between various items. It also
accounts for the present value of future losses due to
failures. The model recommends additional preven-
tive operations to minimize the failure cost and when
the reliability does not satisfy the quality condition.
The decision changes depending on the logistic cost,
the interest rate, and the planning horizon. The latter
helps control the life cycle of the part. If the sys-
tem is at the end of its life cycle, replacing many
components to repair the LRU may not be efficient.
Nevertheless, a high horizon plan makes the model
ICORES 2023 - 12th International Conference on Operations Research and Enterprise Systems
164
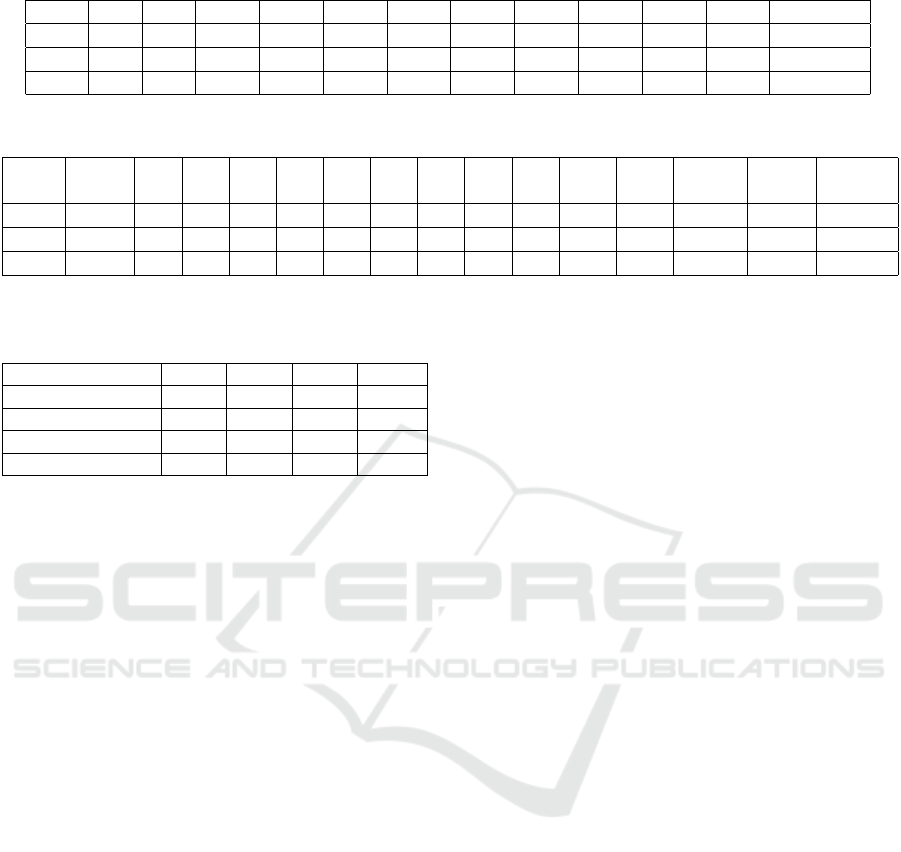
Table 3: Components’ age.
Case C1 C2 C3 C4 C5 C6 C7 C8 C9 C10 C11 R
sys
(180)
1 727 727 727 727 0 727 727 727 727 727 727 0.91
2 0 0 0 1364 637 1364 1364 1364 1364 1364 1364 0.86
3 0 0 1649 1649 1649 1649 1649 1649 1649 1649 1649 0.75
Table 4: Replaced components preventively and net benefit.
Case
TC
(U.C)
C1 C2 C3 C4 C5 C6 C7 C8 C9 C10 C11
TC
0
(U.C)
NB
(U.C)
Benefit
(%)
1 7671 1 0 1 0 0 1 0 0 0 0 1 8331 660 7.92
2 9012 0 0 0 0 0 1 0 0 1 0 1 9734 722 7.41
3 8788 0 0 0 0 1 0 0 0 0 0 1 13036 4248 32.58
Table 5: Impact of planning horizon T .
T (days) 180 365 730 1095
TC (U.C) 4451 5936 8788 11735
Total replacement 3 4 2 4
NB (U.C) 665 2709 4248 3125
Benefit (%) 12.98 31.34 32.58 21.02
recommend conservative decisions depending on the
corrective R
conditional
(180). The model suggests not
performing other replacements if it satisfies the hard
constraint. However, if the corrective conditional re-
liability is lower than 0.9, the model recommends re-
placing the cheapest components to satisfy the con-
straint even though the benefit is negative. Therefore,
the net benefit can be used as a metric to evaluate the
consistency of the proposed solution. On the other
hand, the computational time is still challenging. A
neural network can be built and trained to simplify
the integral computation time and improve the solu-
tions’ quality. In addition, the developed model does
not consider stochastic dependency between compo-
nents. Grouping components based on the correlation
coefficient can approximate the dependency. Never-
theless, it will increase the total number of replace-
ments. Therefore, another strategy to overcome this
limitation is required.
ACKNOWLEDGMENTS
The research of Zhiguo Zeng is partially financially
supported by ANR under grant number ANR-22-
CE10-0004 and the chaire of Risk and Resilience of
Complex Systems (Chaire EDF, Orange and SNCF).
The participation of David Coit in this research is par-
tially financed by the international visiting grant from
Centralesup
´
elec, and the Bourses Jean d’Alembert
from Universit
´
e Paris-Saclay.
REFERENCES
Dinh, D.-H., Do, P., and Iung, B. (2020). Maintenance op-
timisation for multi-component system with structural
dependence: Application to machine tool sub-system.
CIRP Annals, 69(1):417–420.
El Garrab, H., Castanier, B., Lemoine, D., Lazrak, A., and
Heidsieck, R. (2020). Towards hybrid machine learn-
ing models in decision support systems for predicting
the spare parts reverse flow in a complex supply chain.
In Information system, Logistics & Supply Chain-ILS
2020, pages 188–195.
Haque, S. A., Kabir, A. Z., and Sarker, R. A. (2003). Opti-
mization model for opportunistic replacement policy
using genetic algorithm with fuzzy logic controller.
In The 2003 Congress on Evolutionary Computation,
2003. CEC’03., volume 4, pages 2837–2843. IEEE.
Jiang, R. and Ji, P. (2002). Age replacement policy: a multi-
attribute value model. Reliability Engineering & Sys-
tem Safety, 76(3):311–318.
Laggoune, R., Chateauneuf, A., and Aissani, D. (2009).
Opportunistic policy for optimal preventive mainte-
nance of a multi-component system in continuous op-
erating units. Computers & Chemical Engineering,
33(9):1499–1510.
Li, M., Jiang, X., and Negenborn, R. R. (2021). Op-
portunistic maintenance for offshore wind farms with
multiple-component age-based preventive dispatch.
Ocean Engineering, 231:109062.
Nakagawa, T. and Zhao, X. (2013). Comparisons of re-
placement policies with constant and random times.
Journal of the Operations Research Society of Japan,
56(1):1–14.
Nilsson, J., Wojciechowski, A., Stromberg, A., Patriksson,
M., and Bertling, L. (2009). An opportunistic mainte-
nance optimization model for shaft seals in feed-water
pump systems in nuclear power plants. In 2009 IEEE
Bucharest PowerTech, pages 1–8. IEEE.
Pascual, R., Santelices, G., L
¨
uer-Villagra, A., Vera, J., and
Mac Cawley, A. (2017). Optimal repairable spare-
parts procurement policy under total business volume
discount environment. Reliability Engineering & Sys-
tem Safety, 159:276–282.
Opportunistic Maintenance of Multi-Component Systems Under Structure and Economic Dependencies: A Healthcare System Case Study
165

Rebaiaia, M.-L. and Ait-Kadi, D. (2022). A remaining
useful life model for optimizing maintenance cost
and spare-parts replacement of production systems
in the context of sustainability. IFAC-PapersOnLine,
55(10):1562–1568.
Saranga, H. (2004). Opportunistic maintenance using ge-
netic algorithms. Journal of Quality in Maintenance
Engineering.
Satow, T., Teramoto, K., and Nakagawa, T. (2000). Optimal
replacement policy for a cumulative damage model
with time deterioration. Mathematical and computer
modelling, 31(10-12):313–319.
Wang, J., Miao, Y., Yi, Y., and Huang, D. (2021). An im-
perfect age-based and condition-based opportunistic
maintenance model for a two-unit series system. Com-
puters & Industrial Engineering, 160:107583.
Zhang, S., Dan, B., and Zhou, M. (2019). After-sale ser-
vice deployment and information sharing in a supply
chain under demand uncertainty. European Journal of
Operational Research, 279(2):351–363.
ICORES 2023 - 12th International Conference on Operations Research and Enterprise Systems
166
