
Visual Anomaly Detection and Localization with a Patch-Wise
Transformer and Convolutional Model
Afshin Dini
a
and Esa Rahtu
b
Unit of Computing Sciences, Tampere University, Finland
{firstname.lastname}@tuni.fi
Keywords:
Anomaly Detection, Anomaly Localization, Combined Transformer and Convolutional Networks.
Abstract:
We present a one-class classification approach for detecting and locating anomalies in vision applications
based on the combination of convolutional networks and transformers. This method utilizes a pre-trained
model with four blocks of patch-wise transformer encoders and convolutional layers to extract patch em-
beddings from normal samples. The patch features from the third and fourth blocks of the model are then
combined together to form the final representations, and then several multivariate Gaussian distributions are
mapped on these normal embeddings accordingly. At the testing phase, irregularities are detected and located
by setting a threshold on anomaly score and map defined by calculating the Mahalanobis distances between
the patch embeddings of test samples and the related normal distributions. By evaluating the proposed method
on the MVTec dataset, we find out that not only can this method detect anomalies properly due to the ability
of the convolutional and transformer layers to present local and overall properties of an image, respectively,
but also it is computationally efficient as it skips the training phase by using a pre-trained network as the fea-
ture extractor. These properties make our method a good candidate for detecting and locating irregularities in
real-world industrial applications.
1 INTRODUCTION
Anomaly in vision applications refers to an image or
area of an image that differs significantly from the
normal behaviors of the majority of samples (Yang
et al., 2021). Detecting and locating visual irregulari-
ties, which refer to the task of finding dissimilar sam-
ples and specifying the exact defective area of anoma-
lous data (Chalapathy and Chawla, 2019), respec-
tively, are active research topics in computer vision
applications such as industrial inspections (Bergmann
et al., 2019), video surveillance (Liu et al., 2018), and
medical diagnosis applications (Fernando et al., 2021;
Tschuchnig and Gadermayr, 2022).
In general, data-driven approaches like deep learn-
ing techniques are suitable candidates to deal with
anomaly detection problems; however, they face
some challenges due to the intrinsic properties of
anomalies. Practically, irregularities rarely happen in
real-world applications (Pang et al., 2021), and an-
notating anomalous samples for training a deep neu-
ral network is cumbersome in most cases. Moreover,
a
https://orcid.org/0000-0001-6234-3322
b
https://orcid.org/0000-0001-8767-0864
irregularities are unknown before they occur (Chala-
pathy and Chawla, 2019). In other words, various
types of anomalies in terms of shape, texture, color,
and size can happen in real-world cases, and detecting
unforeseen defects is difficult. Due to these reasons,
most datasets such as MVTec (Bergmann et al., 2019)
and BTAD (Mishra et al., 2021) utilized for evalu-
ating anomaly detection problems only contain a few
normal samples for training purposes which limits the
selection and performance of the related deep learning
approach.
Several semi-supervised approaches (Pang et al.,
2021) that work properly with datasets containing
only normal samples for the training phase have been
developed recently to address the aforementioned
challenges. Autoencoders (AEs) (Masci et al., 2011)
and their extensions (Liu et al., 2020) are the most
popular and simplest methods; however, they have
difficulties in detecting subtle irregularities. Gen-
erative Adversarial Networks such GANomaly (Ak-
cay et al., 2018) perform well in capturing semantic
anomalies and are not appropriate for localizing ir-
regularities in most cases (Di Mattia et al., 2019).
On the other hand, many researchers have focused
on developing self-supervised approaches like Cut-
144
Dini, A. and Rahtu, E.
Visual Anomaly Detection and Localization with a Patch-Wise Transformer and Convolutional Model.
DOI: 10.5220/0011669400003417
In Proceedings of the 18th International Joint Conference on Computer Vision, Imaging and Computer Graphics Theor y and Applications (VISIGRAPP 2023) - Volume 5: VISAPP, pages
144-152
ISBN: 978-989-758-634-7; ISSN: 2184-4321
Copyright
c
2023 by SCITEPRESS – Science and Technology Publications, Lda. Under CC license (CC BY-NC-ND 4.0)

Paste (Li et al., 2021) and CutOut (DeVries and Tay-
lor, 2017), which attempt to train a network with nor-
mal and simulated anomalies. Although these meth-
ods can detect and locate different types of anoma-
lies with various sizes properly, simulating anomalies
might be cumbersome in the training phase.
Other semi-supervised methods such as VT-ADL
(Mishra et al., 2021) try to utilize transformers in
their architecture to improve their performance; how-
ever, large training datasets and powerful computa-
tional resources are required for training these models
as they have a large number of trainable parameters
(Yan et al., 2021).
In this work, we have proposed a new approach,
inspired by (Defard et al., 2021), to address some
of the aforementioned limitations. Our main goal
is to develop a method that has high performance
in anomaly detection and localization tasks while it
is computationally efficient and can be trained with
small datasets containing only a few normal sam-
ples. In this regard, we utilize a pre-trained network
(Yan et al., 2021) containing several blocks of convo-
lutional layers and patch-wise transformer encoders
with skip connections as our backbone model to ex-
tract suitable representations of data. In the training
phase, normal images are divided into patches with
the same size as the patches used in transformer en-
coders, and fetched into the pre-trained model. The
feature vectors from the last two blocks of the model
are extracted and combined together to form the final
representation of data. Then, the multivariate Gaus-
sian distribution of each patch is found by calculat-
ing the mean and covariance of the related position in
the combined feature vectors. At the testing phase,
the Mahalanobis distance between the normal distri-
bution and related feature vector of each patch is uti-
lized to define the anomaly map. An upsampling and
also Gaussian filtering is applied to the anomaly map
to modify its size. Then, anomalies are detected based
on assigning a threshold on the final anomaly map.
It is shown in section 4 that convolutional-
transformer architecture can describe the overall and
local properties of an image properly. Moreover, di-
viding images into patches of the same size as the
ones used in the transformer encoders allows the
model to be trained in such a way that it can de-
tect fine-grained anomalies appropriately. Besides,
this model is computationally efficient in the training
phase since a pre-trained network is used as the back-
bone model of the method, which makes it a suitable
candidate for real-world applications. We have eval-
uated our method on the MVTec dataset (Bergmann
et al., 2019) and compared the results with previous
state-of-the-art methods in section 4.
2 RELATED WORKS
From one point of view (Mohammadi et al., 2021),
anomaly detection methods can be classified into
three main categories as supervised, semi-supervised
and unsupervised approaches, based on the types the
available samples in the training datasets. Supervised
deep learning methods like (Mohammadi et al., 2021)
can be used only in specific applications with datasets
containing a significant amount of anomalous sam-
ples for training purposes (Kong et al., 2019). On the
other hand, unsupervised approaches (Ouardini et al.,
2019) do not require labeled data for training; how-
ever, they have problems detecting small anomalies
in high-dimensional space (Mohammadi et al., 2021).
Semi-supervised approaches that only utilize nor-
mal samples for training the model are the most pop-
ular ones. These methods vary from reconstruction-
based approaches to self-supervised, and one-class
detectors (Pang et al., 2021). Reconstruction-based
methods are divided into several categories such as
Autoencoders (AEs) (Masci et al., 2011) like VT-
ADL (Mishra et al., 2021), inpainting approaches like
InTra (Pirnay and Chai, 2022), Generative Adversar-
ial Networks (GANs) (Di Mattia et al., 2019) like
AnoGAN (Schlegl et al., 2017). These models are
trained in such a way that they can reconstruct only
normal images from a latent space while irregularities
cannot be recreated properly, as a result of which the
difference between the original and the reconstructed
images can be utilized for detecting anomalies. Al-
though these methods are various and simple in struc-
ture, they have their own limitations. For example,
GAN-based approaches are sometimes hard to stabi-
lize (Di Mattia et al., 2019), and Autoencoders are
not able to detect fine-grained anomalies in some ap-
plications where the difference between original and
reconstructed images is not significant (Pang et al.,
2021).
One-class classifiers such as FCDD (Liznerski
et al., 2020), and PSVDD (Yi and Yoon, 2020) at-
tempt to specify a decision boundary on the fea-
ture space of normal images and detect anomalous
samples as they are outside this area. Although
these methods perform well in detecting subtle irreg-
ularities, they have some scalability problems (Pang
et al., 2021) as the related feature space dimension
increases. Moreover, patch-wise one-class classifiers
like PSVDD (Yi and Yoon, 2020) are also computa-
tionally heavy as they utilize patches of images in the
training and testing phases.
Self-supervised approaches such as CutPaste (Li
et al., 2021) are two-stage frameworks that train a
model in the first stage, also known as the proxy task,
Visual Anomaly Detection and Localization with a Patch-Wise Transformer and Convolutional Model
145
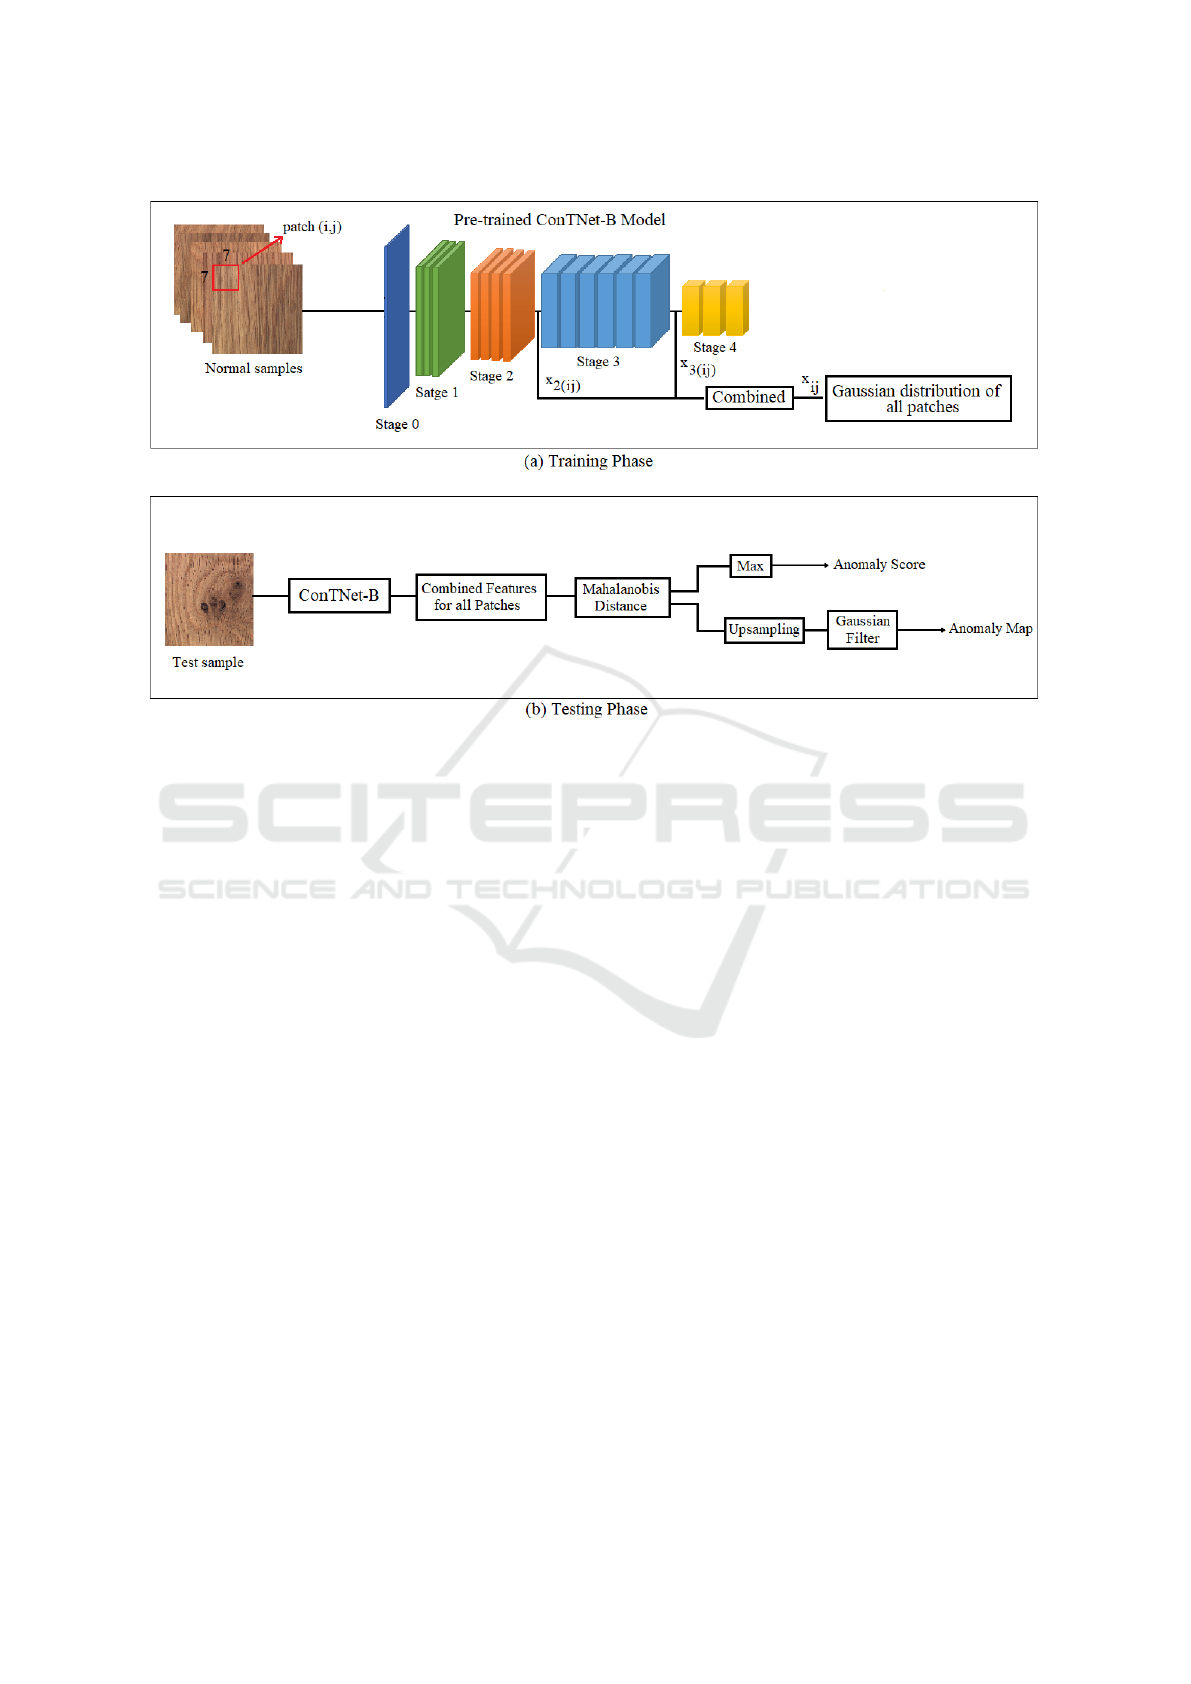
Figure 1: Overview and model architecture of the proposed method for visual anomaly detection and localization. (a) A
pre-trained ConTNet-B network is considered as the feature extractor in the training phase, and the Gaussian distributions
of image patches are calculated based on the combined features. (b) Anomaly scores and maps are defined based on the
Mahalanobis distance (Mahalanobis, 1936) calculated between normal and related test representations.
with normal samples and simulated anomalies created
by applying different transformations on normal sam-
ples, and then utilize the trained model to extract fea-
tures for the second stage which is the anomaly de-
tection task (DeVries and Taylor, 2017). Although
these methods are able to detect and locate defects ap-
propriately, they are not generalized enough in some
cases as they cannot simulate various types of un-
foreseen irregularities properly. Moreover, simulating
anomalies can increase the computational costs of the
training phase significantly based on the size of the
network and the required number of anomalous sam-
ples (Li et al., 2021).
It is also good to mention that convolutional net-
works are used as the model architectures of most
anomaly detection approaches. It is shown in (Yan
et al., 2021) that although convolutional networks are
good at describing the local features of an image,
they are deficient in representing large receptive ar-
eas, as a result of which they restrict the performance
of anomaly detection methods. On the other hand,
transformer-based architectures can increase the per-
formance of anomaly detection methods significantly
as they can give suitable local and overall presenta-
tions of an image; however, they are much larger than
convolutional networks, and more samples and com-
putational resources are required for training them.
Due to these reasons, only a few anomaly detec-
tion methods, such as VT-ADL (Mishra et al., 2021)
and InTra (Pirnay and Chai, 2022) use transform-
ers as their backbone models, and their performances
are limited considering the fact that the number of
training samples is limited to few hundreds in most
anomaly detection datasets.
Our proposed method can address some of the
aforementioned limitations while it leads to higher
performance, as is discussed in more detail in section
3.
3 METHOD
3.1 Overview
We propose a method that attempts to extract the en-
riched patch features of normal samples utilizing a
specific pre-trained network, ConTNet-B (Yan et al.,
2021), and fit a multivariate Gaussian distribution on
the combined embedding vector of each patch at the
training step. Then, at the testing phase, the Maha-
lanobis distances (Mahalanobis, 1936) between the
patch features of test samples and the related normal
VISAPP 2023 - 18th International Conference on Computer Vision Theory and Applications
146
distributions are calculated and utilized for detecting
and locating anomalies.
The overview and model architecture of the pro-
posed method is described in detail in Fig.1. Select-
ing an architecture containing both convolutional and
transformer encoders as a powerful feature extractor,
dividing images into appropriate patches in the train-
ing stage in such a way that the model is able to ex-
tract enriched features, and combining specific mid-
dle layer features for anomaly detection task is the
important properties of our method which we will dis-
cuss in detail in this section.
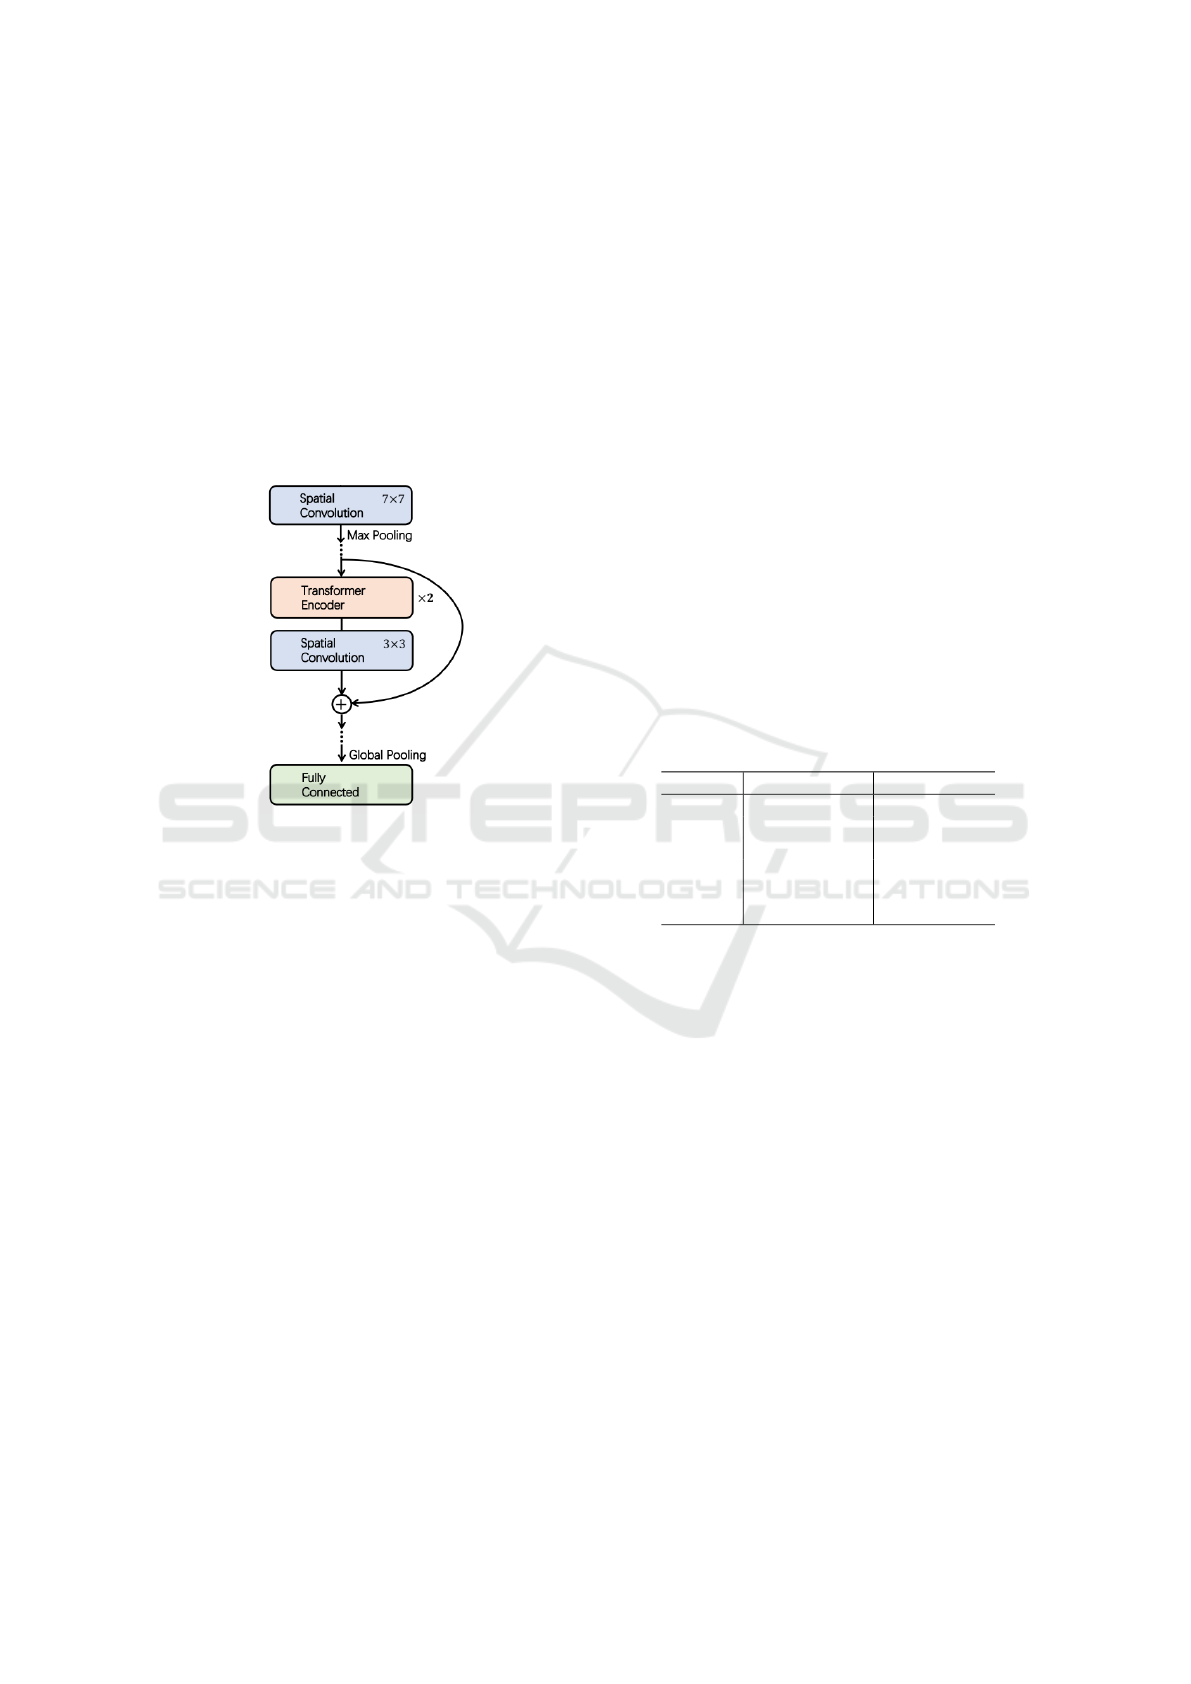
Figure 2: Illustration of ConT blocks, used in ConTNet-B
model (Yan et al., 2021).
3.2 Model Architecture
One of the most important issues that can affect the
performance of an anomaly detection method is the
ability of the model to represent features for the de-
tection task (Pang et al., 2021). If the feature embed-
dings can represent the semantic and local properties
of the image properly, the anomaly detector would be
able to identify the various types of subtle and large
anomalies. It is shown that although convolutional
networks are able to extract suitable local features of
an image for anomaly detection problems (Bergman
et al., 2020), they cannot represent large and seman-
tic receptive areas appropriately in some cases (Yan
et al., 2021).
On the other hand, transformers (Dosovitskiy
et al., 2020) perform well in presenting overall fea-
tures of data, as a result of which it seems that
they can be utilized alongside the convolutional net-
works for extracting more detailed features; however,
as we have tested several pre-trained convolutional-
transformer-based architectures like CvT (Wu et al.,
2021), CCT (Hassani et al., 2021), and ConViT
(d’Ascoli et al., 2021) in our method in ablation study,
we discover that they will not improve the perfor-
mance of the anomaly detection method as they are
not able to detect small anomalies in most cases. It
seems that the convolutional layers in the combined
models are not able to detect anomalies properly as it
is supposed to be.
To solve this issue, we discover that using
a convolutional-transformer-based architecture with
patch-wise transformer encoders and skip connec-
tions between convolutional and transformer outputs
(Yan et al., 2021) is a suitable candidate for our prob-
lem. We utilize the ConTNet-B model (Yan et al.,
2021), pre-trained on ImageNet (Deng et al., 2009),
as the feature extractor in our method, Fig.1(a). This
model contains four stages, Tab.1, of several ConT
blocks, Fig.2, containing convolutional layers and
transformers. It is shown in section 4 that dividing the
image into patches that match the patch-wise trans-
former encoders, in addition to the skip connections
between outputs of transformers and convolutional
layers, allows the model to represent more detailed
embedding features for the detection problem.
Table 1: Illustration of ContNet-B model architecture in de-
tails (Yan et al., 2021).
Stage No. of blocks Type
Stage 0 1 CNN
Stage 1 3 ConT
Stage 2 4 ConT
Stage 3 6 ConT
Stage 4 3 ConT
Stage 5 1 Average, FC
Moreover, since ConTNet-B (Yan et al., 2021)
has around 39.6 million trainable parameters, it is al-
most impossible to train this model from scratch using
anomaly detection datasets like MVTec (Bergmann
et al., 2019) that have only a few numbers of normal
samples for training purposes. Even with data aug-
mentation methods, training large networks like this
model is cumbersome and requires a lot of computa-
tional resources, as a result of which we utilize the
pre-trained model in our approach.
3.3 Patch Feature Extraction
We follow a similar patch feature extraction proce-
dure in our method as SPADE (Cohen and Hoshen,
2020) and PaDiM (Defard et al., 2021), considering
the fact that we select the patch size to match the
patch-wise transformer encoders in the model archi-
tecture in order to extract detailed features from each
patch. Therefore, an input image with size W × H is
divided into square patches of size P. P
i, j
is the image
patch at location (i, j) where (i, j) ∈ [1, W ] × [1, H].
Visual Anomaly Detection and Localization with a Patch-Wise Transformer and Convolutional Model
147

The embedding vectors from the third and fourth
stages of the model are extracted for each patch, x
2(i j)
and x
3(i j)
, and combined together to form the final
representation of each patch, x
(i j)
, as is shown in
Fig.1(a). The reason behind selecting the third and
fourth embeddings is that not only it gives the best re-
sult amongst all possible combinations, as we experi-
mentally find this, but also by considering the fact that
deeper layers contain more detailed information than
the shallower ones in deep models. The patch features
are extracted and combined for all normal samples at
all possible positions according to Eq.1 and utilized
in the next step.
X
i j
= {x
m
i j
: (i, j) ∈ [1, W ] × [1, H], m ∈ [1, N]} (1)
where X
i j
is the set of patch features at position (i, j)
for all N normal samples, and x
m
i j
is the combined fea-
ture vector of sample m at position (i, j).
3.4 Learning Normal Pattern
To learn the normal behavior of patches, we fit a mul-
tivariate Gaussian distribution, N (µ
i j
, Σ
i j
), on every
set of image patches, X
i j
, extracted from all normal
samples at position (i, j). µ
i j
is the mean of all sam-
ples in X
i j
while the covariance, Σ
i j
, is calculated ac-
cording to Eq.2.
Σ
i j
=
1
N − 1
N
∑
m=1
(x
m
i j
− µ
i j
)(x
m
i j
− µ
i j
)
T
+ εI (2)
where εI is a small term to make sure that the covari-
ance matrix is full rank and inversible as it is required
for calculating the anomaly map and score.
Since the combined feature representations are
created from embeddings of two middle layers, fitting
the Gaussian distribution model on this embedding
vector allows the model to capture various detailed
information from different semantic levels, which can
increase the performance of our method.
3.5 Anomaly Map and Score
In order to detect anomalous samples, a specific value,
also known as anomaly score, should be assigned to
each data sample, based on which we can identify
defective samples by defining a threshold on these
scores. Similarly, an anomaly map can be defined by
assigning anomaly scores to pixels of an image ac-
cording to which irregularities can be located in the
related anomalous samples.
In order to define anomaly score and anomaly
map, we follow the general approach (Rippel et al.,
2021) and use Mahalanobis distance (Mahalanobis,
1936), Eq.3, to find the difference between patch fea-
tures of test samples and their related normal distri-
butions. This distance is considered as the anomaly
score of all the pixels in the related patch.
M
i j
=
q
(x
t
i j
− µ
i j
)
T
Σ
−1
i j
(x
t
i j
− µ
i j
) (3)
where M
i j
and x
t
i j
are the anomaly map of the patch
feature of the test sample at position (i, j), respec-
tively.
The calculated distance is assigned to all pixels
of the related patch, and the maximum value will be
considered as the anomaly score of the related test
sample. The final anomaly map is created by upsam-
pling the distance map to match the size of the orig-
inal image and by applying a Gaussian filter to make
it smoother.
By setting appropriate thresholds on anomaly
scores and anomaly maps of all test samples, anoma-
lies can be detected and located properly. We eval-
uated our method on the MVTec dataset (Bergmann
et al., 2019) and discuss the results in section 4.
4 EXPERIMENT
4.1 Dataset and Metric
Following the common practice in the anomaly de-
tection literature, we evaluate our approach on the
MVTec dataset (Bergmann et al., 2019), which con-
tains fifteen sub-datasets of high-resolution images
from real-world industrial applications. This dataset
comprises images with different sizes, types, colors,
and textures which makes it a suitable candidate for
assessing the performance and generalizability of the
proposed method.
This dataset is made of five sub-datasets contain-
ing texture-type images and ten sub-datasets contain-
ing various object-type data samples. They comprise
only a few normal images, varying from 60 to 391,
for training a model, which seems to be a big chal-
lenge in developing deep models containing a huge
number of trainable parameters. They also contain a
few normal and anomalous test samples with defects
of various sizes, shapes, colors, and types for testing
the generalizability and performance of a method.
Moreover, images in this dataset have different
resolutions varying from 700 × 700 to 1024 × 1024,
which may be colorful or greyscale depending on the
sub-dataset. This dataset also contains ground truth
data, specifying the exact locations of anomalous ar-
eas in test samples according to which it can be used
to assess the performance of the anomaly localization
method.
VISAPP 2023 - 18th International Conference on Computer Vision Theory and Applications
148

Table 2: Comparison of our approach with patch-SVDD (Yi and Yoon, 2020), InTra (Pirnay and Chai, 2022), VT-ADL
(Mishra et al., 2021), and CutPaste (Li et al., 2021) results in image-level anomaly detection on MVTec AD dataset (Bergmann
et al., 2019), using AUROC metric.
Category PSVDD InTra VT-ADL CutPaste Our Method
bottle 98.6 100.0 94.9 98.3 100.0
cable 90.3 70.3 77.6 80.6 99.4
capsule 76.7 86.5 67.2 96.2 95.9
hazelnut 92.0 95.7 89.7 97.3 100.0
metal nut 94.0 96.9 72.6 99.3 99.8
object pill 86.1 90.2 70.5 92.4 95.6
screw 81.3 95.7 92.8 86.3 92.2
toothbrush 100 100.0 90.1 98.3 91.7
transistor 91.5 95.8 79.6 95.5 99.8
zipper 97.9 99.4 80.8 99.4 97.4
average 90.8 93.0 81.6 94.3 97.2
carpet 92.9 98.8 77.3 93.1 100.0
grid 94.6 100.0 87.1 99.9 98.3
texture leather 90.9 100.0 72.8 100.0 100.0
tile 97.8 98.2 79.6 93.4 99.9
wood 96.5 97.5 78.1 98.6 99.1
average 94.5 98.9 79.0 97.0 99.4
average 92.1 95.0 80.7 95.2 97.9
Table 3: Comparison of our approach with InTra (Pirnay and Chai, 2022), patch-SVDD (Yi and Yoon, 2020), CutPaste (Li
et al., 2021), and PaDiM (Defard et al., 2021) methods in pixel-level anomaly detection on MVTec AD dataset (Bergmann
et al., 2019), using AUROC metric.
Category InTra PSVDD PaDiM CutPaste Our Method
bottle 97.1 98.1 98.1 97.6 96.7
cable 91.0 96.8 95.8 90.0 97.5
capsule 97.7 95.8 98.3 97.4 97.4
hazelnut 98.3 97.5 97.7 97.3 97.8
metal nut 93.3 98.0 96.7 93.1 96.4
object pill 98.3 95.1 94.7 95.7 93.7
screw 99.5 95.7 97.4 96.7 96.8
toothbrush 98.9 98.1 98.7 98.1 97.6
transistor 96.1 97.0 97.2 93.0 98.5
zipper 99.2 95.1 98.2 99.3 96.2
average 96.9 96.7 97.3 95.8 96.9
carpet 99.2 92.6 98.9 98.3 99.3
grid 98.8 96.2 94.9 97.5 96.5
texture leather 99.5 97.4 99.1 99.5 98.6
tile 94.4 91.4 91.2 90.5 93.4
wood 88.7 90.8 93.6 95.5 92.9
average 96.1 93.7 95.6 96.3 96.1
average 96.6 95.7 96.7 96.0 96.6
Visual Anomaly Detection and Localization with a Patch-Wise Transformer and Convolutional Model
149

Area Under the Receiver Operating Characteris-
tic curve or AUROC is used to assess and compare
the detection and the related localization performance
of our method with the previous state-of-the-art re-
sults. In this regard, the anomaly detection ROC
curve is created based on setting various thresholds on
anomaly score, which is the maximum Mahalanobis
distance of pixels of a test image as calculated in sec-
tion 3.5. For the anomaly localization problem, the
ROC curve is created based on setting thresholds on
distance values of all patches of an image. In other
words, for the localization problem, the true posi-
tive rate is plotted against the false positive rate at
various threshold settings by considering the Maha-
lanobis distances of all pixels of test images from their
related normal distributions.
4.2 Implementation Details
The ConTNet-B model (Yan et al., 2021), pre-trained
on the ImageNet (Deng et al., 2009) is considered
the feature extractor of our method. The images are
resized to 224 × 224 at first and then divided into
patches of size 7 × 7 in order to match the size of
transformer encoders. It is good to mention that dif-
ferent patch sizes are tested in the ablation study;
however, the best results are obtained with 7 × 7
patches as the larger patches cannot detect some small
anomalies and smaller patches do not improve the
performance and are sensitive to noises in few cases.
The extracted embeddings from the fourth layer
are unfolded to match the size of the features from the
third layer and then stacked together to form the final
representations. Then, the calculated distance map is
interpolated bilinearly in order to be the same size as
the size of the original image, and a Gaussian filter
with the variance of σ = 4 is applied to this map to
form the final anomaly map. The maximum value
of each anomaly map is considered as the anomaly
score of the related test sample based on which, by
setting an appropriate threshold, anomalous samples
are specified.
4.3 Results
In order to assess the performance of our method and
compare it with the results of previous methods, we
run our approach on each sub-dataset and calculate
the AUROC of each sub-dataset as well as the aver-
age AUROC for all texture-type and object-type sub-
datasets.
The result of evaluating our method for the
anomaly detection task is presented in Tab.2 and com-
pared with the results of PSVDD (Yi and Yoon, 2020),
InTra (Pirnay and Chai, 2022), VT-ADL (Mishra
et al., 2021), and CutPaste (Li et al., 2021) methods. It
is obvious that our method is able to detect anomalies
precisely in the bottle, hazelnut, carpet, and leather
sub-datasets. Moreover, the average AUROC is im-
proved by 2.9 percent in object-type datasets, 0.5 per-
cent in texture-types datasets, and 2.7 percent in all
datasets, compared to the previous state-of-the-art re-
sults.
It is clear from Tab.2 that our method has a better
performance by utilizing a feature-extractor with the
combined convolutional and patch-wise transformer
architecture compared to transformer-based methods
such as InTra (Pirnay and Chai, 2022) and VT-ADL
(Mishra et al., 2021), or convolutional-based model
such as PSVDD (Yi and Yoon, 2020), and CutPaste
(Li et al., 2021). Moreover, the computational cost of
our method is much less than other patch-wise meth-
ods such as PSVDD (Yi and Yoon, 2020) since we
take advantage of a pre-trained network instead of
training the backbone model from scratch.
Our method also shows appropriate performance
in the localization task since it defines the anomaly
maps and anomaly scores at the same time from a pre-
trained model without any additional effort for train-
ing a new model like what is implemented in CutPaste
(Li et al., 2021) and PSVDD (Yi and Yoon, 2020).
The result of evaluating our method for the anomaly
localization task is presented in Tab.3 and compared
to the previous methods.
It is shown that our method can locate defects in
cable, transistor, and carpet sub-datasets better than
previous methods and almost the same in other sub-
datasets. For the anomaly localization problem, the
average AUROC of our method is almost the same
as InTra (Pirnay and Chai, 2022) and PaDiM (Defard
et al., 2021) while it is improved by around one per-
cent compared to other methods.
It is also important to notice that our method is
able to locate the defective locations of an image
properly in most cases, as it is shown in Fig.3; how-
ever, the results, presented in Tab.3, are based on the
ability of the model to detect the correct number of
anomalous pixels, as a result of which our method
may get less AUROC in some datasets although the
anomalous locations are detected properly. Various
types of defects localization by our method for some
texture and object-type samples are shown in Fig.3.
VISAPP 2023 - 18th International Conference on Computer Vision Theory and Applications
150
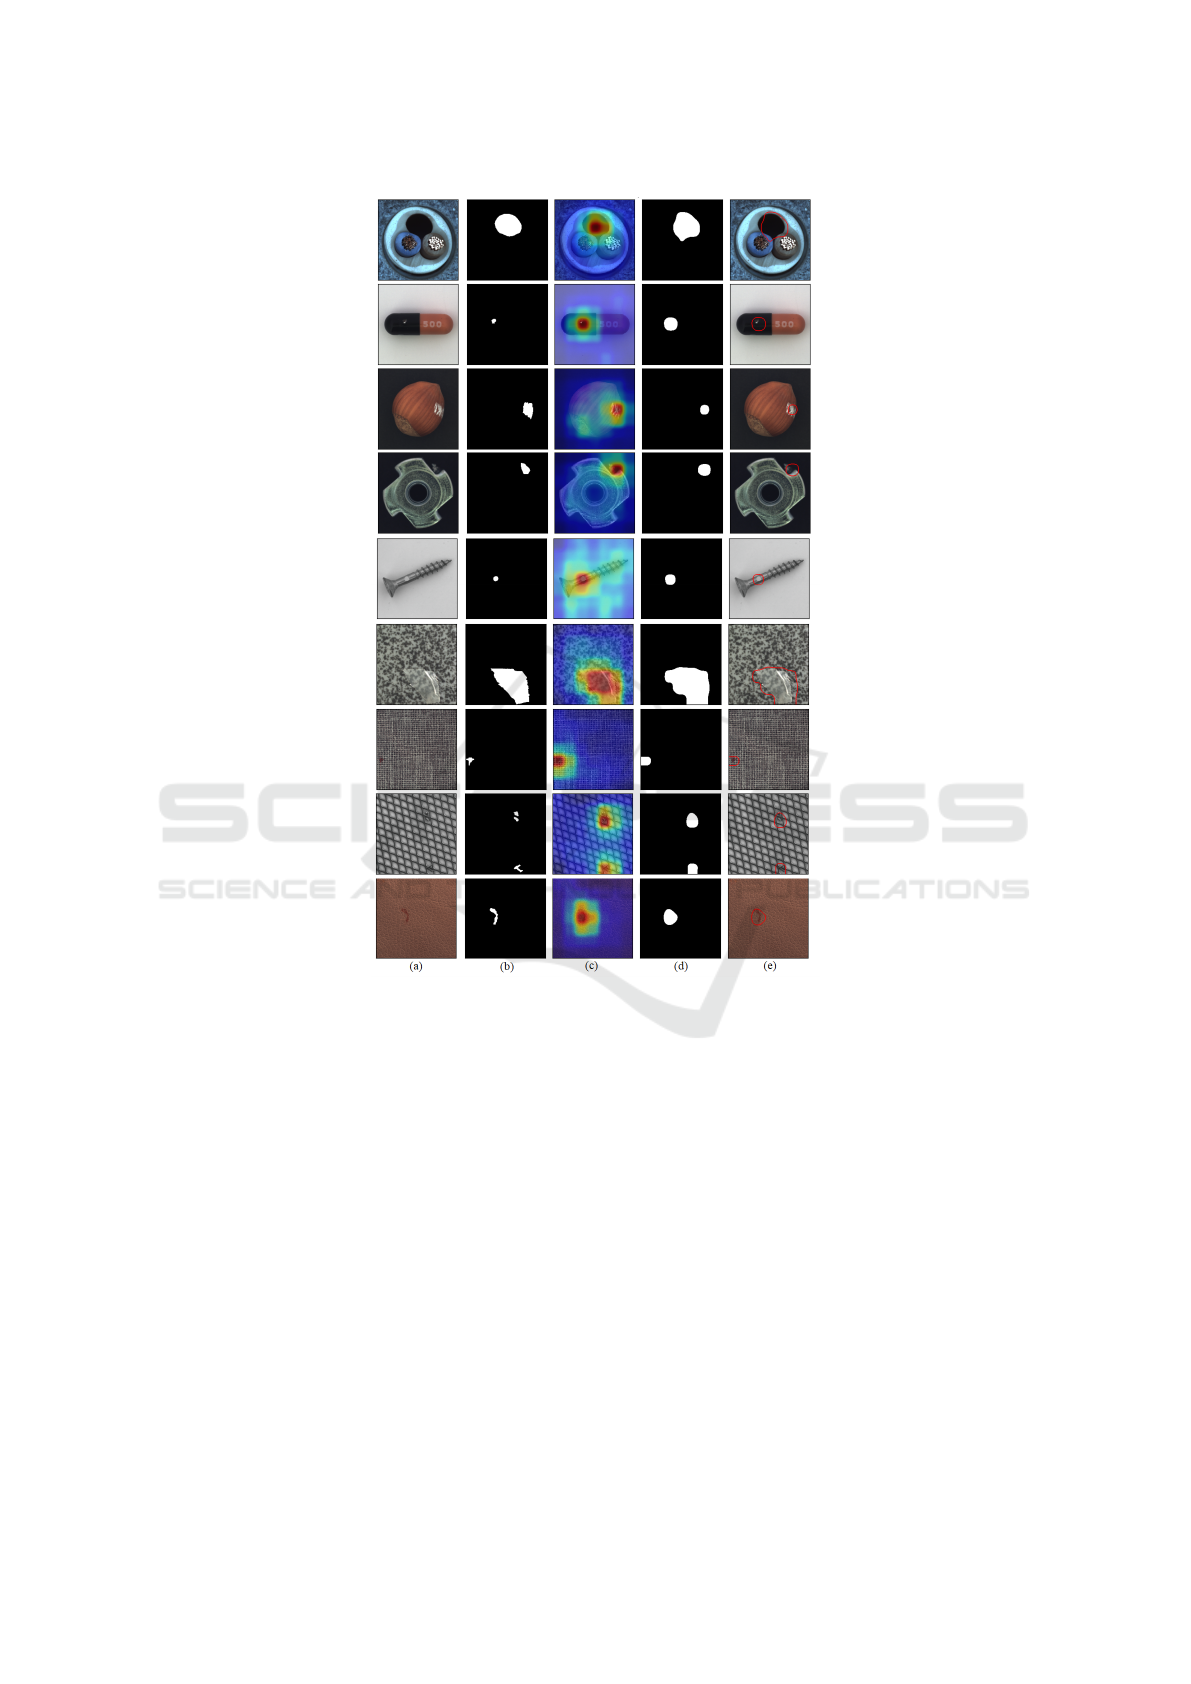
Figure 3: Visualization of defect localization using the proposed method. (a) Original image, (b) Ground truth map, (c)
Predicted heat map, (d) Predicted map, (e) Predicted localization results.
5 CONCLUSION
We develop a new approach for detecting and locat-
ing anomalies in vision applications based on find-
ing the Gaussian distribution of patch features of nor-
mal samples, extracted by a pre-trained patch-wise
transformer and convolutional model which is able
to present overall and local characteristics of samples
precisely, and detecting anomalies based on the dif-
ference between these normal distributions and the re-
lated patch features in test samples.
We show that the proposed method has a supe-
rior ability to detect and locate different types and
sizes of irregularities properly as we evaluate it on the
MVTec dataset. Our method is also computationally
efficient in the training phase as it skips the cumber-
some training procedure of deep models from scratch,
which makes it an appropriate approach to be used in
real-world applications.
REFERENCES
Akcay, S., Atapour-Abarghouei, A., and Breckon, T. P.
(2018). Ganomaly: Semi-supervised anomaly detec-
tion via adversarial training. In Asian conference on
computer vision, pages 622–637. Springer.
Bergman, L., Cohen, N., and Hoshen, Y. (2020). Deep
nearest neighbor anomaly detection. arXiv preprint
arXiv:2002.10445.
Bergmann, P., Fauser, M., Sattlegger, D., and Steger, C.
(2019). Mvtec ad–a comprehensive real-world dataset
for unsupervised anomaly detection. In Proceedings
Visual Anomaly Detection and Localization with a Patch-Wise Transformer and Convolutional Model
151

of the IEEE/CVF conference on computer vision and
pattern recognition, pages 9592–9600.
Chalapathy, R. and Chawla, S. (2019). Deep learning
for anomaly detection: A survey. arXiv preprint
arXiv:1901.03407.
Cohen, N. and Hoshen, Y. (2020). Sub-image anomaly
detection with deep pyramid correspondences. arXiv
preprint arXiv:2005.02357.
d’Ascoli, S., Touvron, H., Leavitt, M. L., Morcos, A. S.,
Biroli, G., and Sagun, L. (2021). Convit: Improv-
ing vision transformers with soft convolutional induc-
tive biases. In International Conference on Machine
Learning, pages 2286–2296. PMLR.
Defard, T., Setkov, A., Loesch, A., and Audigier, R. (2021).
Padim: a patch distribution modeling framework for
anomaly detection and localization. In International
Conference on Pattern Recognition, pages 475–489.
Springer.
Deng, J., Dong, W., Socher, R., Li, L.-J., Li, K., and Fei-
Fei, L. (2009). Imagenet: A large-scale hierarchical
image database. In 2009 IEEE conference on com-
puter vision and pattern recognition, pages 248–255.
Ieee.
DeVries, T. and Taylor, G. W. (2017). Improved regular-
ization of convolutional neural networks with cutout.
arXiv preprint arXiv:1708.04552.
Di Mattia, F., Galeone, P., De Simoni, M., and Ghelfi, E.
(2019). A survey on gans for anomaly detection. arXiv
preprint arXiv:1906.11632.
Dosovitskiy, A., Beyer, L., Kolesnikov, A., Weissenborn,
D., Zhai, X., Unterthiner, T., Dehghani, M., Minderer,
M., Heigold, G., Gelly, S., et al. (2020). An image is
worth 16x16 words: Transformers for image recogni-
tion at scale. arXiv preprint arXiv:2010.11929.
Fernando, T., Gammulle, H., Denman, S., Sridharan, S.,
and Fookes, C. (2021). Deep learning for medical
anomaly detection–a survey. ACM Computing Sur-
veys (CSUR), 54(7):1–37.
Hassani, A., Walton, S., Shah, N., Abuduweili, A., Li,
J., and Shi, H. (2021). Escaping the big data
paradigm with compact transformers. arXiv preprint
arXiv:2104.05704.
Kong, Y., Huang, J., Huang, S., Wei, Z., and Wang, S.
(2019). Learning spatiotemporal representations for
human fall detection in surveillance video. Journal
of Visual Communication and Image Representation,
59:215–230.
Li, C.-L., Sohn, K., Yoon, J., and Pfister, T. (2021). Cut-
paste: Self-supervised learning for anomaly detection
and localization. In Proceedings of the IEEE/CVF
Conference on Computer Vision and Pattern Recog-
nition, pages 9664–9674.
Liu, W., Li, R., Zheng, M., Karanam, S., Wu, Z., Bhanu, B.,
Radke, R. J., and Camps, O. (2020). Towards visually
explaining variational autoencoders. In Proceedings
of the IEEE/CVF Conference on Computer Vision and
Pattern Recognition, pages 8642–8651.
Liu, Y., Li, C.-L., and P
´
oczos, B. (2018). Classifier two
sample test for video anomaly detections. In BMVC,
page 71.
Liznerski, P., Ruff, L., Vandermeulen, R. A., Franks,
B. J., Kloft, M., and M
¨
uller, K.-R. (2020). Ex-
plainable deep one-class classification. arXiv preprint
arXiv:2007.01760.
Mahalanobis, P. C. (1936). On the generalized distance in
statistics. National Institute of Science of India.
Masci, J., Meier, U., Cires¸an, D., and Schmidhuber, J.
(2011). Stacked convolutional auto-encoders for hi-
erarchical feature extraction. In International con-
ference on artificial neural networks, pages 52–59.
Springer.
Mishra, P., Verk, R., Fornasier, D., Piciarelli, C., and
Foresti, G. L. (2021). Vt-adl: A vision transformer
network for image anomaly detection and localization.
In 2021 IEEE 30th International Symposium on In-
dustrial Electronics (ISIE), pages 01–06. IEEE.
Mohammadi, B., Fathy, M., and Sabokrou, M. (2021). Im-
age/video deep anomaly detection: A survey. arXiv
preprint arXiv:2103.01739.
Ouardini, K., Yang, H., Unnikrishnan, B., Romain, M.,
Garcin, C., Zenati, H., Campbell, J. P., Chiang, M. F.,
Kalpathy-Cramer, J., Chandrasekhar, V., et al. (2019).
Towards practical unsupervised anomaly detection on
retinal images. In Domain Adaptation and Represen-
tation Transfer and Medical Image Learning with Less
Labels and Imperfect Data, pages 225–234. Springer.
Pang, G., Shen, C., Cao, L., and Hengel, A. V. D. (2021).
Deep learning for anomaly detection: A review. ACM
Computing Surveys (CSUR), 54(2):1–38.
Pirnay, J. and Chai, K. (2022). Inpainting transformer
for anomaly detection. In International Conference
on Image Analysis and Processing, pages 394–406.
Springer.
Rippel, O., Mertens, P., and Merhof, D. (2021). Model-
ing the distribution of normal data in pre-trained deep
features for anomaly detection. In 2020 25th Inter-
national Conference on Pattern Recognition (ICPR),
pages 6726–6733. IEEE.
Schlegl, T., Seeb
¨
ock, P., Waldstein, S. M., Schmidt-Erfurth,
U., and Langs, G. (2017). Unsupervised anomaly de-
tection with generative adversarial networks to guide
marker discovery. In International conference on in-
formation processing in medical imaging, pages 146–
157. Springer.
Tschuchnig, M. E. and Gadermayr, M. (2022). Anomaly
detection in medical imaging-a mini review. Data
Science–Analytics and Applications, pages 33–38.
Wu, H., Xiao, B., Codella, N., Liu, M., Dai, X., Yuan,
L., and Zhang, L. (2021). Cvt: Introducing convo-
lutions to vision transformers. In Proceedings of the
IEEE/CVF International Conference on Computer Vi-
sion, pages 22–31.
Yan, H., Li, Z., Li, W., Wang, C., Wu, M., and Zhang,
C. (2021). Contnet: Why not use convolution and
transformer at the same time? arXiv preprint
arXiv:2104.13497.
Yang, J., Xu, R., Qi, Z., and Shi, Y. (2021). Visual
anomaly detection for images: A survey. arXiv
preprint arXiv:2109.13157.
Yi, J. and Yoon, S. (2020). Patch svdd: Patch-level svdd for
anomaly detection and segmentation. In Proceedings
of the Asian Conference on Computer Vision.
VISAPP 2023 - 18th International Conference on Computer Vision Theory and Applications
152
