
Predicting Off-Block Delays: A Case Study at Paris - Charles de Gaulle
International Airport
Thibault Falque
1,2 a
, Bertrand Mazure
2 b
and Karim Tabia
2 c
1
Exakis Nelite, Paris, France
2
CRIL, Universit
´
e d’Artois and CNRS, Lens, France
Keywords:
Machine Learning, Application, Real Time Delay.
Abstract:
Punctuality is a sensitive issue in large airports and hubs for passenger experience and for controlling opera-
tional costs. This paper presents a real and challenging problem of predicting and explaining flight off-block
delays. We study the case of the international airport Paris Charles de Gaulle (Paris-CDG) starting from the
specificities of this problem at Paris-CDG until the proposal of modelings then solutions and the analysis of
the results on real data covering an entire year of activity. The proof of concept provided in this paper allows us
to believe that the proposed approach could help improving the management of delays and reduce the impact
of the resulting consequences.
1 INTRODUCTION
In the context of an airport, there are several typi-
cal problems of artificial intelligence, such as plan-
ning, optimization, simulation, and prediction. In-
deed, many air transport problems exist where deci-
sion support systems are used while integrating artifi-
cial intelligence components.
Before the COVID-19 health crisis, the Inter-
national Air Transport Association (IATA) forecasts
showed that passengers would double by 2036, reach-
ing 7.8 billion. The COVID-19 pandemic has slowed
air traffic considerably, especially in 2020 and early
2021, but competitive pressure is always present, even
in reduced activity. In recent months, air traffic has
picked up in several world regions. In France, Paris-
Charles de Gaule airport (Paris-CDG) Air France’s
main hub will see its passenger numbers increase by
35 to 40 million to reach 100 million by 2036. This
will require around 400 additional aircraft movements
(take-offs and landings) per day. The development
project for Paris-CDG airport does not include any
extension or new runway. It is, therefore, essential
to improve the following:
• passenger flows by offering a simplified, fluid,
and personalized route;
a
https://orcid.org/0000-0003-2803-1530
b
https://orcid.org/0000-0002-3508-123X
c
https://orcid.org/0000-0002-8632-3980
• the punctuality of flights by anticipating delays as
far as possible;
• aircraft movements with optimized and adaptive
planning of resources such as aircraft parking lots,
check-in counters, baggage chutes, etc.
The problem of flight delays, for example (landing
and take-off delays), does not only have immediate
financial consequences. These delays can also cause
a chain effect, other delays, and problems that affect
the delays and rankings of airlines and airports.
In (Xu et al., 2008), the authors point out that
about 84% of delays are generated by the airports.
The problem of delay prediction is studied in a few
works, but it mainly concerns landing or taxiing de-
lays. The delay at departure from the parking lot (the
delay between the scheduled time and the actual time
at which an aircraft leaves its parking position or gate)
depends on several factors. Many of these are specific
to each airport (such as the amount of traffic and re-
sources, passenger processes, weather conditions, air
traffic control, Etc.). At Paris-CDG, there is a take-
off almost every minute, and the slightest delay can
have a cascading effect on the takeoff schedule, which
can take several hours to be resolved and return to a
normal situation. Predicting and forecasting delays in
real-time will allow us to anticipate management by
providing delay management plans and adjustments
to established schedules such as gateway, check-in,
and baggage chutes.
180
Falque, T., Mazure, B. and Tabia, K.
Predicting Off-Block Delays: A Case Study at Paris - Charles de Gaulle International Airport.
DOI: 10.5220/0011668200003393
In Proceedings of the 15th International Conference on Agents and Artificial Intelligence (ICAART 2023) - Volume 2, pages 180-189
ISBN: 978-989-758-623-1; ISSN: 2184-433X
Copyright
c
2023 by SCITEPRESS – Science and Technology Publications, Lda. Under CC license (CC BY-NC-ND 4.0)

One of the specificities of our work is that we fo-
cused on very fluctuating data due to the COVID-19
pandemic. The main contributions of the paper are
the study of the existing situation at Paris-CDG, the
needs, and then the identification of three main tasks
real-time prediction of parking delays, forecasting,
and explicability of predictions. Concerning the mod-
eling, we have identified five categories of data for our
problem: flight data, data on the progress of passen-
ger processes (security, boarding, Etc.), weather data,
current delay status data, Etc. Finally, we have con-
ducted an empirical study to perform the data, feature,
and model selection, and we provide an overview of
the results obtained.
2 FLIGHT DELAYS: STATE OF
THE ART
The problem of aircraft delays is a well-known prob-
lem. Different models among random forests, sup-
port vector machines and logistic regression have
been studied (Natarajan et al., 2018) to predict
whether a flight will be delayed. A logistic regres-
sion model to predict a class of departing flights
is proposed in (Nigam and Govinda, 2017). In
(Venkatesh et al., 2017), the authors study arrival
delays and propose different approaches to predict
whether a specific flight will be delayed. In (Ibrahem
et al., 2021) the authors compared different machine-
learning approaches (random forest, logistic regres-
sion, Bayesian naive classifier, and decision trees)
for delay prediction on arrival. In (Tang, 2021), a
comparison of seven binary models is performed. In
(Yi et al., 2021), the authors have proposed several
stacked approaches for the Boston Logan Interna-
tional Airport flight dataset from January to Decem-
ber 2019.
We also find different studies on the impact of
different factors on flight delays. For example, the
authors of (Wang et al., 2003) studied the impact
of flight connections on delay. In (Markovic et al.,
2008), a statistical study on the impact of weather
at Frankfurt airport is proposed. In (Yogita Borse
et al., 2020), the authors focused on weather data
as the main feature to predict the delay class. In
(Esmaeilzadeh and Mokhtarimousavi, 2020), a sup-
port vector machine (SVM) model is used. Based on
20 days, this latter study examines some causes of
air traffic delays at the three major airports in New
York City. In the study (Cai et al., 2021), a deep
learning approach for flight delay prediction consid-
ering a multi-airport scenario is proposed. Regarding
regression-based approaches, the authors (Rebollo
and Balakrishnan, 2014) have proposed approaches
based on classification and regression with random
forests for US airports.
To our knowledge, there is only one study that at-
tempts to predict takeoff delay, but it only attempts
to predict one hour before the estimated takeoff time,
and it is intended for the Maastricht (Dalmau-Codina
et al., 2019).
3 Paris-CDG AIRPORT
In this section, we provide factual information about
Paris-CDG airport. Paris-CDG airport is the most
important airport in France. It was opened in 1974
to cope with the saturation of Paris Orly airport (the
main Parisian airport before the opening of Paris-
CDG). It is located north of Paris and is the hub of
Air France. This company represents 50% of the traf-
fic at Paris-CDG. Three main terminals numbered 1
to 3 makeup Paris-CDG.
At Paris-CDG, there is more than one flight de-
parture per minute. There are about 720, 000 flights
per year, or about 2, 000 flights per day. On aver-
age, there are 145 passengers per flight. At Paris-
CDG, resources are currently planned using solutions
powered by constraint solvers. Among the critical
resources are the parking lots (or ”stands”) assigned
to the flights. When a parking lot is released late,
this can lead to complex scheduling changes and cas-
cading delays. It is, therefore, essential to anticipate
and predict these delays as accurately as possible, ex-
plain them, and propose actions to limit them. Before
presenting the problem, we will first introduce some
terms. We call rotation the set composed of an ar-
rival flight and a departure flight. This set generally
consists of two flights, but there may be only one, in
which case the flight begins a new rotation. The ro-
tation period is the time between the arrival of an air-
craft (landing) and its departure (takeoff). A flight has
a scheduled departure time, called SOBT (Scheduled
Off-Block Time), at which it is supposed to leave its
parking area. The moment when the flight leaves its
parking position is called AOBT. The delay is then the
period between AOBT and SOBT.
3.1 Milestones Before Off-Block
We present here the main milestones preceding the
pushback of an aircraft. These milestone stands are
presented in Figure. 1. Before the flight arrives at
the airport, the flight estimates its arrival time at the
block (EIBT: Estimated In-Block Time). The AIBT
(Actual In Block Time) is the right time when the
Predicting Off-Block Delays: A Case Study at Paris - Charles de Gaulle International Airport
181

EIBT Period
TOBT Period
0 5 10 15 20 25 30 35 40 45 50 55 60
-2h30
SIBT
Arrival
delay
AIBT
SOBT
Departure delay
TSAT AOBT
CTOT
+2h30
Figure 1: Milestones of a flight at Paris-CDG.
flight arrives at its stand. We call arrival delay the
difference between AIBT and SIBT. The boarding
starts between 1 hour and 30 minutes before SOBT.
During the turn-around period (or rotation), the air-
line sends an estimated time that the aircraft is ready
(TOBT: Target Off Block Time) to the management
system. For heavy traffic in the sky or congestion
on the runway, air traffic control can ”slot” a flight,
i.e., force its takeoff between a calculated time called
CTOT (Calculated TakeOff Time) and CTOT plus 15
minutes. If the aircraft fails to takeoff during this pe-
riod, it can be slotted again. The last milestone is the
TSAT (Target Start-Up Approval Time) is the time
provided by air control taking into account TOBT,
CTOT and/or the traffic situation that an aircraft can
expect startup/pushback approval.
3.2 Off-Block Delays at CDG
Punctuality is a sensitive issue in large airports and
hubs for passenger experience and controlling costs
at the airport level. Paris-CDG is ranked
1
in 2018 in
10th place in terms of punctuality. Around half of the
flights arrive on time, but only 20% take off on time.
A study of delays at Paris-CDG has highlighted
different causes (eg. extreme weather conditions,
congestion, breakdowns, incidents at the airport, pas-
senger processes, etc.) of these delays at different
phases (parking/pushback, taxi-ing, etc.). Figure. 2
gives an overview of off-block delays over the year
considered in our study (March 2021 - March 2022).
It should be noted that during this period, some termi-
nals were closed and are still closed, while some other
terminals have reopened. Over this period, the pro-
portion of flights with off-block delays is 77%. Fig-
ure. 2b shows the number of delayed flights per ter-
minal. We can observe that the two terminals corre-
sponding to Air France (2E and 2F) have the most de-
layed flights. Figure. 2c shows the number of flights
and the mean of delay for each terminal. Terminal 2E
has an average delay 37% above the airport average.
Figure. 2e shows the cumulated delays (in minutes)
each day of the considering period. We can observe
an increase during summer 2022, corresponding to a
resumption of traffic and some terminals’ reopening.
1
According to OAG Flightview
Figure 2f depicts the sum and the mean of the delays
for each time band of the day, ranging from p1 (6am
- 8am) to p6 (8pm - 11pm). We can observe that the
morning periods, particularly p2 (9am - 11am) and p3
(12pm - 2pm), accumulate most of the delay. Since
the majority of delays occur in the morning and there
is a cascading delay effect, it is crucial to predict and
manage these delays in these time slots accurately.
4 PROBLEM STATEMENT AND
OBJECTIVES
This section presents the problem and the objectives
of our off-block delay prediction approach at Paris-
CDG. Recall that we call off-block delay the time sep-
arating the moment that the aircraft leaves the board-
ing gate (this operation is called pushback) from the
scheduled off-block time (between Actual Off-Block
Time and Scheduled Off Block Time).
Let Y be the target variable to predict for an input
sample describing the flight under study. We distin-
guish two regression tasks:
4.1 Real-Time Off-Block Delay
Prediction
The problem considered here is the one of predict-
ing at any time t, the off-block delay Y (expressed in
minutes) that this flight will indeed have. These pre-
dictions are updated every 5 minutes until the flight
leaves its stand. Indeed, for every slot (each slot lasts
5 minutes), we can acquire new relevant data from
the Paris-CDG operational information system. These
data can be used to update the predictions (this is valid
for dynamic variables such as weather conditions, the
progress of passenger processes, etc.). Real-time off-
block delay predictions are intended mainly to:
• Draw managers’ attention in real-time to flights
likely to have significant delays and which may
have cascading consequences.
• Explain and identify actionable causes if neces-
sary to resolve the situation.
ICAART 2023 - 15th International Conference on Agents and Artificial Intelligence
182
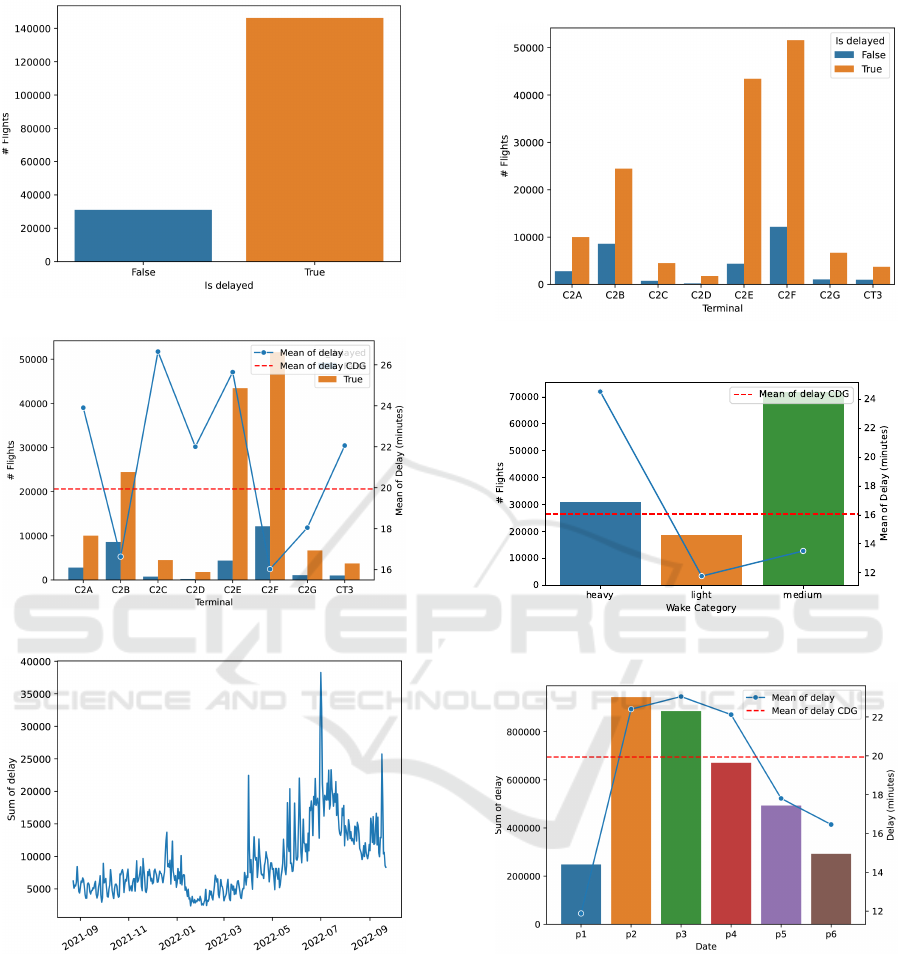
(a) number of on-time flights vs. number of late flights.
(b) proportion of off-block delayed flights per terminal.
(c) number of delayed flights and mean delay per termi-
nal.
(d) Number of flights by wake category and mean of the
delay by wake category.
(e) Cummulative delay for each day of the considering
period.
(f) Cummulative and mean delay for each period of a
day.
Figure 2: Overview of off-block delays at Paris-CDG from August 2021 to September 2022.
4.2 Off-Block Delay Forecast
We call forecasts the prediction of delays before the
opening of the flights. This may be a few hours or
several days before the flight. In our case, the forecast
cannot rely on dynamic information on the progress
of passenger processes, weather conditions, Etc. A
such forecast may serve to :
• Establish several plans and mitigation measures
according to the expected delays. Then managers
can activate the plan provided for each situation
when it occurs.
• Identify the causes and anticipate the chaining ef-
fect and the consequences.
• Use forecasts to make plausible simulations on
Predicting Off-Block Delays: A Case Study at Paris - Charles de Gaulle International Airport
183

Table 1: Basic flight features (BFF).
Feature Description Type Example
Airline airline unique company code Categorical AF
AircraftType aircraft type code Categorical 77W
Destination IATA code of the destination
airport
Categorical JFK
Terminal CDG Terminal Categorical C2E
Customs Customs Criteria Categorical Schengen
Season The IATA Season Categorical W
Week A week index calculated
from a reference date.
Numeric 1000
Day Day number in the week (1-
7)
Numeric 1
Bus True if the flight has bus ac-
cess.
Boolean True
Parking True if the arrival flight and
the departure flight have the
same parking
Boolean False
SOBT The Scheduled off-block
time in minutes since mid-
night
Timestamp 360
Rotation duration between landing
and takeoff in minutes
Numeric 300
Pax Count Number of passengers on the
flight (estimated)
Numeric 140
Total Pif Passenger Number of passengers that
must pass through the secu-
rity point (estimated)
Numeric 75
Service Type Transport category Categorical J
congestion and queues according to delay fore-
casts, then consider solutions and management
plans.
5 MODEL DEFINITION
In this section, we present and motivate the essential
information currently available in the Paris-CDG op-
erational information system and which is likely to
be relevant for predicting off-block delays. The pro-
posed features come from the analysis of a recent re-
port on takeoff delays at Paris-CDG and the analysis
of an entire year of real data.
5.1 Basic Flight Features (BFF)
These are the basic characteristics of a flight, and they
do not change over time (these features are listed in
Table 1). For example, the name of the airline operat-
ing the flight, the type of the aircraft, the IATA code
of the destination of the flight, the terminal, the type
of customs (national, Schengen, or international), and
the IATA season (Summer or Winter).
5.2 Off-Block Milestone Features
(OMF)
These are milestones corresponding to each off-block
and its management by the various stakeholders, such
as air traffic control, the airline, and the airport.
For this study, we focused on milestones around the
SOBT (-2h30 to +2h30, see Figure. 1). This period is
split into 60 slots of 5 minutes. Each new milestone
(EIBT, TOBT, CTOT, TSAT) has a timestamp. The
OMF features are listed in Table. 2.
5.3 Previous and Current Flights Delay
Features (PCFDF)
Relevant information on the probability of a delay for
a given flight is the proportion of flights scheduled just
before the flight under study and which are late. This
could, for example, be due to congestion, a break-
down at the airport, or extreme weather conditions.
We compute the proportion of late flights and the
average duration of these delays for each flight slot.
At a time t, these features are calculated during a time
window w, ranging from a few minutes to a few hours.
As we will show empirically, the optimal window du-
ration is a few minutes. For example, if w =10 min-
utes and the current slot of the flight is 25, we com-
pute the different values from the flights whose AOBT
is between slot 23 and slot 25.
ICAART 2023 - 15th International Conference on Agents and Artificial Intelligence
184

Table 2: Off-block milestone features (OMF).
Feature Description Type
Arrival Delay Time in minutes between the last
EIBT and the SIBT.
Numeric
TOBT
di f f
time in minutes between the last
TOBT and the SOBT.
Numeric
TOBT
count
The number of TOBTs Numeric
CT OT
di f f
time in minutes between the last
CTOT and the SOBT.
Numeric
T SAT
di f f
time in minutes between the last
TSAT and the SOBT.
Numeric
Table 3: Previous and current flights delay features (PCFDF).
Feature Description Type
Delay Airport Mean off-block delay from all
the airport (regardless of the ter-
minal)
Numeric
Delay Terminal Mean off-block delay from the
same terminal
Numeric
Delay airline Mean off-block delay from the
same airline
Numeric
Percent delayed flights Airport Proportion of off-block delayed
flights over all the airport (re-
gardless of the terminal)
Numeric
Percent delayed flights Terminal Proportion of off-block delayed
flights from the same terminal
Numeric
Percent delayed flights Airline Proportion of off-block delayed
flights from the same airline
Numeric
5.4 Weather Condition Features (WCF)
Certain weather conditions, such as low visibility and
strong winds, are known to be factors that can cause
takeoff delays and therefore delay the departure of
the flight from its stand. Table 4 shows examples of
weather-related faults.
5.5 Passenger Flow Features (PFF)
These features provide information at any time on the
progress of specific passenger processes, which may
cause an off-block delay. In particular, the relevant
information is the percentage at slot t of passengers
who have already passed boarding or passed security
checkpoints. These features are used only to predict
and update the off-block delay prediction in real-time
(each flight slot).
6 DATA AND FEATURE
EXTRACTION,
PREPROCESSING AND
SELECTION
In this section, we present our main findings concern-
ing the selection of variables and the selection of data
(in particular, the choice of the best parameters for
the time window duration, the training data amount,
Etc.).
6.1 Data Extraction and Preprocessing
Paris-CDG’s operational information system (called
AOP for Airport Operation Plan) collects much in-
formation about each flight and its progress. For our
prediction tasks, a new flight entry is created with the
associated time stamp and updated data at each time
slot. It is, therefore, possible to trace the status of
a flight back to its departure. Therefore, for static
Predicting Off-Block Delays: A Case Study at Paris - Charles de Gaulle International Airport
185

Table 4: Weather condition features (WCF).
Feature Description Type
Low Visibility Procedures These procedures are applied at
an airport to ensure safe opera-
tions when there is low visibility.
Boolean
Humidity rate (in percent) Humidity rate Numeric
Wind speed (in meter/sec) Wind speed Numeric
Air pressure (in hectoPascal) Air pressure Numeric
Temperature (in degrees Celsius) Temperature Numeric
characteristics, we extract them only once. For dy-
namic characteristics, such as delays of other flights,
these are calculated variables that we perform with
queries on past flights. For example, to compute
the proportion of flights that have been delayed in
the last w minutes, we need to review all flights in-
volved in the w time window. The delay characteris-
tics of previous and current flights (PCFDF) are com-
puted after extraction with different w windows. In
our study, we considered one year of data (August
2021-September 2022) and constructed a dataset with
10, 633, 920 rows and 31 columns (each flight is re-
peated 60 times with dynamic values for each slot).
6.2 Feature Selection
Once our data set was extracted and preprocessed we
proceeded to the selection of variables in order to
confirm our intuitions and to eliminate attributes that
would prove irrelevant to our prediction tasks. We
first performed a simple correlation analysis between
each characteristic and the target variable (delay to
parking departure). The Figures. 3 show the results
of the Pearson correlation coefficient.
It can be seen in Figure. 3 that the most relevant
variables at the slot 0 are :
• the difference between the SOBT and the TSAT
with a score of 0.4,
• the difference between the TOBT between TOBT
and SOBT with a Pearson score of 0.33.
In contrast, the variables representing the rotation
time (Rotation) and the arrival delay of a flight (Ar-
rival delay) seem to have little relevance. These vari-
ables have a negative Pearson score of −0.66 and
−0.29, respectively. For the slot 30, the order of the
essential variables is confirmed. The durations be-
tween SOBT and TSAT or TOBT are the essential
variables with a Pearson score of 0.74 and 0.68.
The importance of the TSAT variable is explained
by the fact that it is one of the last pieces of infor-
mation obtained for a flight before it leaves its park-
ing lot and that departure is most often at the time
indicated by the TSAT. Nevertheless, air traffic con-
trol may send this information very early before the
departure of the aircraft. The variable Percent Flight
Airport, representing the proportion of delayed flights
airport (for the calculation of the values, we used the
10-minute time window), becomes more important
with a progression of its score from 0.16 to 0.23. Fi-
nally, we can note that the dynamic variables (in par-
ticular, the variable concerning the progression of the
boarding) have a score in progression. This progres-
sion shows the importance of using dynamic flight
data for real-time predictions.
In order to validate the findings on the correla-
tion scores obtained, we performed another empirical
analysis by varying the set of variables used for de-
lay prediction. We also varied the window w used
to calculate the dynamic variables from the nearby
history and the amount of history to use (twelve
months, nine months, six months, or three months).
We used an ensemble model of boosted regression
trees regression trees called LightGbm. In the fol-
lowing, we denote by D
m
w
the dataset with m the
number of months used (m ∈ {3, 6, 9, 12}) and w the
duration of the window used for the computation
of the dynamic variables (w ∈ {10, 30, 60}). V de-
note the set of variables used for the dataset (V ∈
{{BFF}, {BFF, WCF, OM F, PFF},
{BFF, PCFDF, WCF, OMF, PFF}}).
For our study, we tested our configuration on 40
days (from August 12 to September 21, 2022). For
each day, we trained the model until the day be-
fore the test day and evaluated it on the test day.
Table 5 shows the optimal configurations. The er-
rors and R2 score presented in this table are for the
40 days tested. The hyperparameters are noted as
#Tree/#Leaves/LearningRate.
Table 5 presents the results for the different con-
figurations. The use of dynamic variables dynamic
variables bring a real gain, reducing the error by half
and significantly improving the R2 score. Thus the
best configuration uses all of the history (12 months),
with a time window of 60 minutes.
ICAART 2023 - 15th International Conference on Agents and Artificial Intelligence
186
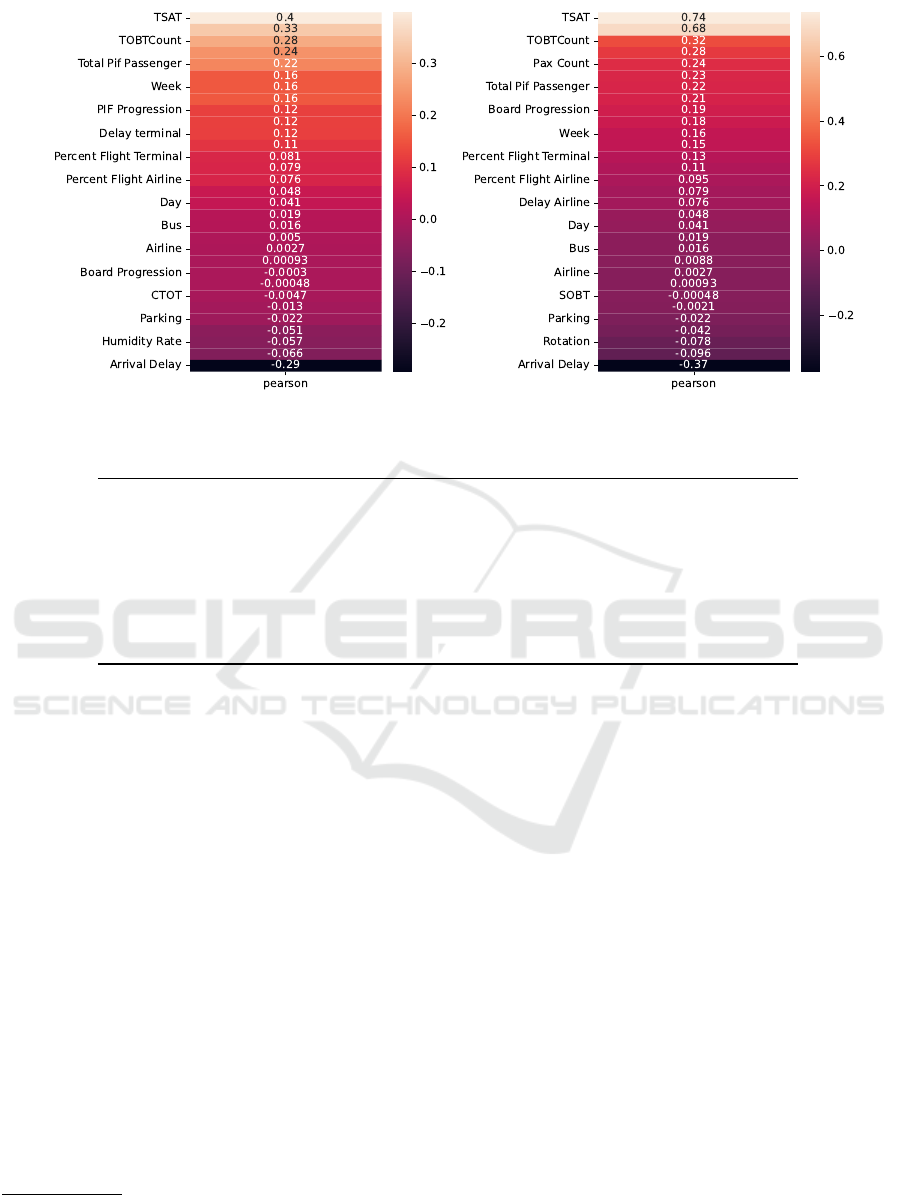
Figure 3: Results of statistical correlation measure at slots 0 (left side figure) and at slot 30 (right side figure).
Table 5: Results of feature selection and historical data.
Dataset Features (V ) Hyperparameters MAE RMSE R2
D
12
60
BFF, PCFDF, WCF, OMF, PFF 75/256/0.05 9.645 13.858 0.731
D
12
10
BFF,WCF, OMF, PFF 75/256/0.05 9.709 14.009 0.725
D
12
60
BFF, PCFDF, WCF, OMF, PFF 32/64/0.05 10.376 14.500 0.705
D
12
60
BFF, PCFDF, WCF, OMF, PFF 32/128/0.05 10.473 14.584 0.702
D
3
60
BFF, PCFDF, WCF, OMF, PFF 32/128/0.05 11.637 15.414 0.667
D
12
10
BFF,WCF, OMF, PFF 32/64/0.05 13.922 20.812 0.393
D
9
60
BFF 75/256/0.05 17.443 26.576 0.0108
7 REAL TIME PREDICTIONS
Table 6 presents the mean absolute error (MAE) for
a subset of the days (for space reasons) tested with
the best model selected in the previous section. We
notice that the proposed model is more accurate and
stable in terms of error than the reference model (e.g.,
a model predicting the average delay at CDG all the
time). However, we can also notice that September
16 significantly increased errors.
2
. The delays could
go up to 4h30 (the average delay over the day was
1h20). Addition, as the period covered for each flight
is between -2h30 and +2h30, we only collect some of
the data on these delays.
Figure 4 gives an overview of the five most impor-
tant features for our model
3
. The features are sorted
by the sum of the SHAP values over all samples at slot
0 and slot 30. The color represents the value of the
feature (red corresponds to high, blue to low). This
reveals, for example, that when the slot is 30, a high
2
On Thursday, September 16, the delays are due to an
air traffic controllers’ strike
3
Full figures are available in appendices.
value for TSAT increases the predicted delay. Finally,
the SHAP values largely confirm the coefficients of
Pearson from the 6.2 section and the importance of
the impact of the TSAT and TOBT variables.
8 CONCLUSIONS
Punctuality is a sensitive issue in major airports and
hubs for the passenger experience. In this article,
we have addressed the problem of predicting delays
at the departure of parking lots at Paris-CDG airport,
one of the largest airports in the world and the hub
of the airline Air France. Our study started with ana-
lyzing the problem (its magnitude, form, causes, Etc.)
and the needs (real-time forecasting and prediction) at
Paris-CDG. Based on this analysis, we proposed two
types of feature categories that could be useful for de-
lay prediction: static features used for the forecasting
task and dynamic features (which can be updated in
real-time) used for real-time delay prediction. The
next step was to build a pipeline to extract the raw
data we needed from the operational information sys-
Predicting Off-Block Delays: A Case Study at Paris - Charles de Gaulle International Airport
187
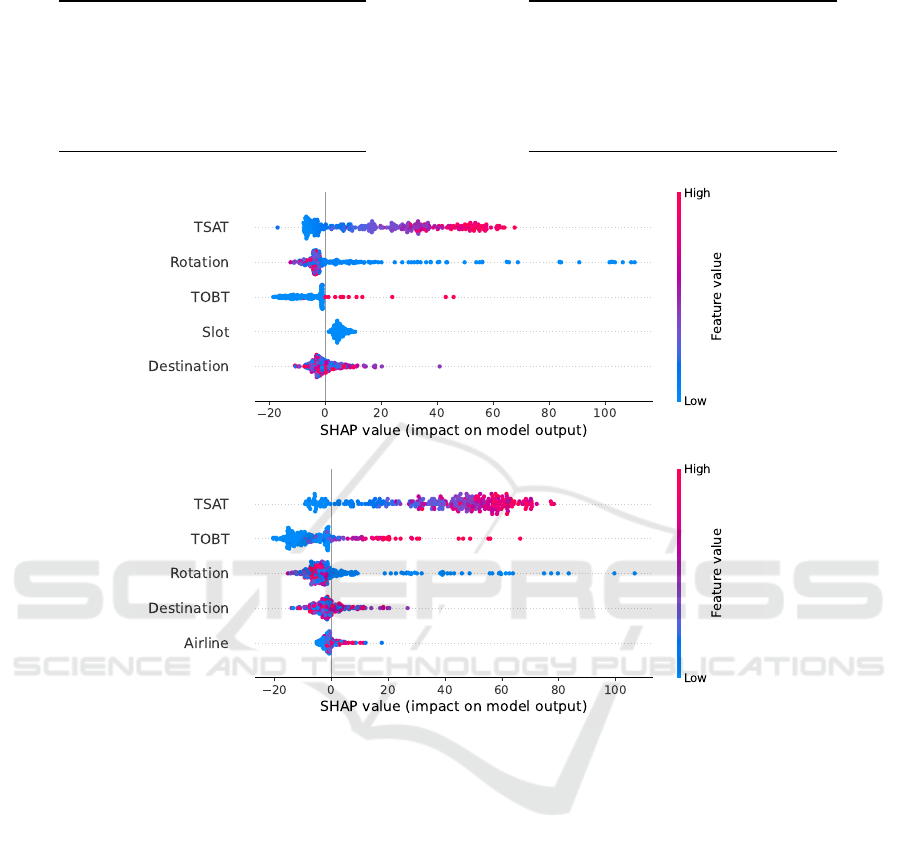
Table 6: MAE for off-block delay forecast.
Date MAE Baseline model
2022-08-13 8.196 18.814
2022-08-14 8.490 18.176
2022-08-15 8.026 16.877
2022-08-16 9.911 20.869
2022-08-17 8.288 18.728
2022-09-05 9.340 19.727
2022-09-10 7.429709 16.339208
2022-09-11 8.311289 19.677116
2022-09-12 7.088036 16.854864
2022-09-13 7.252672 15.125720
2022-09-14 8.613775 17.317014
2022-09-15 7.553985 17.969956
2022-09-16 31.250517 65.622123
Figure 4: SHAP values for 16th September 2022 at slot 0 (top figure) and slot 30 (bottom figure).
tem of Paris-CDG. This allowed us to build a dataset
representing one year of authentic activity. We con-
ducted an empirical study to select the characteristics
and the data and then to select the models. One of
the specificities of our work is that we worked with
very fluctuating data due to the COVID-19 pandemic
pandemic and its consequences in terms of air travel
restrictions on several occasions, as well as other air
traffic hazards. The results show that some delays
can be predicted much better than the baseline model.
This result can be significantly improved by system-
atically exploring other models and their best hyper-
parameters. In addition to the accuracy improvement,
one of the crucial elements for our application will be
the explicability of the predictions, in particular, the
identification of explanations that can help in delay
management.
REFERENCES
Cai, K., Li, Y., Fang, Y.-P., and Zhu, Y. (2021). A
Deep Learning Approach for Flight Delay Prediction
Through Time-Evolving Graphs. IEEE Trans. Intell.
Transport. Syst., pages 1–11.
Dalmau-Codina, R., Ballerini, F., Naessens, H., Belkoura,
S., and Wangnick, S. (2019). Improving the pre-
dictability of take-off times with machine learning a
case study for the maastricht upper area control centre
area of responsibility.
Esmaeilzadeh, E. and Mokhtarimousavi, S. (2020). Ma-
chine Learning Approach for Flight Departure Delay
Prediction and Analysis.
Ibrahem, A., Elbeh, H., and Mousa, H. M. (2021). A Com-
parative Analysis of Models for Predicting Airline Ar-
rival Delays. page 5.
Markovic, D., Hauf, T., R
¨
ohner, P., and Spehr, U. (2008).
A statistical study of the weather impact on punctual-
ICAART 2023 - 15th International Conference on Agents and Artificial Intelligence
188

ity at Frankfurt Airport. Meteorological Applications,
15(2):293–303.
Natarajan, V., Meenakshisundaram, S., Balasubramanian,
G., and Sinha, S. (2018). A Novel Approach: Airline
Delay Prediction Using Machine Learning. In 2018
International Conference on Computational Science
and Computational Intelligence (CSCI), pages 1081–
1086.
Nigam, R. and Govinda, K. (2017). Cloud based flight delay
prediction using logistic regression. In 2017 Interna-
tional Conference on Intelligent Sustainable Systems
(ICISS), pages 662–667.
Rebollo, J. J. and Balakrishnan, H. (2014). Characterization
and prediction of air traffic delays. Transportation Re-
search Part C: Emerging Technologies, 44:231–241.
Tang, Y. (2021). Airline Flight Delay Prediction Using Ma-
chine Learning Models. In 2021 5th International
Conference on E-Business and Internet, pages 151–
154, Singapore Singapore. ACM.
Venkatesh, V., Arya, A., Agarwal, P., Lakshmi, S., and
Balana, S. (2017). Iterative machine and deep learn-
ing approach for aviation delay prediction. 2017 4th
IEEE Uttar Pradesh Section International Conference
on Electrical, Computer and Electronics (UPCON).
Wang, Schaefer, and Wojcik (2003). Flight connections
and their impacts on delay propagation. In 22nd Digi-
tal Avionics Systems Conference Proceedings (Cat No
03CH37449) DASC-03, pages 5.B.4–5.1, Indianapo-
lis, IN, USA. IEEE.
Xu, N., Sherry, L., and Laskey, K. B. (2008). Multifactor
Model for Predicting Delays at U.S. Airports. Trans-
portation Research Record, 2052(1):62–71.
Yi, J., Zhang, H., Liu, H., Zhong, G., and Li, G. (2021).
Flight Delay Classification Prediction Based on Stack-
ing Algorithm. Journal of Advanced Transportation,
2021:1–10.
Yogita Borse, Dhruvin Jain, Shreyash Sharma, Viral Vora,
Aakash Zaveri, and K J Somaiya College of Engineer-
ing (2020). Flight Delay Prediction System. IJERT,
V9(03):IJERTV9IS030148.
Predicting Off-Block Delays: A Case Study at Paris - Charles de Gaulle International Airport
189
