
Development, Implementation and Validation of a Stochastic
Prediction Model of UICC Stages for Missing Values in Large Data
Sets in a Hospital Cancer Registry
Sebastian Appelbaum
1
, Daniel Krüerke
2,3
, Stephan Baumgartner
2
, Marianne Schenker
3
and
Thomas Ostermann
1
1
Department of Psychology and Psychotherapy, Faculty of Health, Witten/Herdecke University, Witten, Germany
2
Society for Cancer Research, Hiscia Institute, Arlesheim, Switzerland
3
Clinic Arlesheim, Research Department, Arlesheim, Switzerland
{daniel.krueerke, Marianne.schwenker}@klinik-arlesheim.ch
Keywords: Clinical Registry, Cancer Staging, Missing Values, Prediction Models, Integrative Oncology.
Abstract: Cancer is still a fatal disease in many cases, despite intensive research into prevention, treatment and follow-
up. In this context, an important parameter is the stage of the cancer. The TNM/UICC classification is an
important method to describe a cancer. It dates back to the surgeon Pierre Denoix and is an important
prognostic factor for patient survival. Unfortunately, despite its importance, the TNM/UICC classification is
often poorly documented in cancer registries. The aim of this work is to investigate the possibility of
predicting UICC stages using statistical learning methods based on cancer registry data. Data from the Cancer
Registry Clinic Arlesheim (CRCA) were used for this analysis. It contains a total of 5,305 records of which
1,539 cases were eligible for data analysis. For prediction classification and regression trees, random forests,
gradient tree boosting and logistic regression are used as statistical methods for the problem at hand. As
performance measures Mean misclassification error (mmce), area under the receiver operating curve (AUC)
and Cohen’s kappa are applied. Misclassification rates were in the range of 28.0% to 30.4%. AUCs ranged
between 0.73 and 0.80 and Cohen kappa showed values between 0.39 and 0.44 which only show a moderate
predictive performance. However, with only 1,539 records, the data set considered here was significantly
lower than those of larger cancer registries, so that the results found here should be interpreted with caution.
1 INTRODUCTION
Cancer is still a fatal disease in many cases, despite
intensive research into prevention, treatment and
follow-up. With a deeper understanding of the
pathogenesis of cancer in the 19th century, first ideas
were developed to produce reliable statistics on
cancer-related mortality or morbidity rates Wagner,
1991). Around 1900, the first nationwide survey on
cancer was launched (Meyer 1911). Another 30 years
later, a first population-based cancer registry was
established in Germany, allowing to follow the
treatment process including survival time and
survival rate of cancer patients, which was one of the
starting points of cancer epidemiology (Alam 2011).
In cancer epidemiology, survival rates play an
important role: they provide information on the
percentage of people with the same cancer and cancer
stage who survived a certain period of time after
diagnosis (usually five years) following a specific
therapy. This information can be used to predict
treatment success. In particular, cancer registry data
can be used to identify patients with prolonged survival,
which is one of the main goals in clinical oncology.
In this context, an important parameter is the stage
of the cancer. The TNM classification is an important
method to describe a cancer. It dates back to the
surgeon Pierre Denoix (1944) and is an important
prognostic factor for patient survival (Takes et al.,
2010). It is based, as the title of the original paper
suggests, on the three pillars:
T = Tumor, extent and behavior of the primary
tumor.
N = Nodus (Latin nodus lymphoideus = lymph
node) absence or presence of regional lymph node
metastases
Appelbaum, S., Krüerke, D., Baumgartner, S., Schenker, M. and Ostermann, T.
Development, Implementation and Validation of a Stochastic Prediction Model of UICC Stages for Missing Values in Large Data Sets in a Hospital Cancer Registry.
DOI: 10.5220/0011667700003414
In Proceedings of the 16th International Joint Conference on Biomedical Engineering Systems and Technologies (BIOSTEC 2023) - Volume 5: HEALTHINF, pages 117-123
ISBN: 978-989-758-631-6; ISSN: 2184-4305
Copyright
c
2023 by SCITEPRESS – Science and Technology Publications, Lda. Under CC license (CC BY-NC-ND 4.0)
117
M = Metastases, absence or presence of distant
metastases
According to the definition of the International
Union against Cancer (Union internationale contre le
cancer (UICC)), founded in 1933, stages of cancer
can be grouped into five stages (UICC 0 to 4)
according to the TNM classification. These are:
- Stage 0: Tumors with no spread to connective
tissue, no lymph node involvement, and no
metastases.
- Stage I: Small and medium-sized tumors (T1,
T2) without lymph node involvement and metastases
- Stage II: Medium to large tumors (T3, T4)
without lymph node involvement and metastases
- Stage III: Tumors of any size with metastases in
1-4 lymph nodes in the surrounding area without
distant metastases
- Stage IV: tumors of any size with metastases in
1-4 lymph nodes in the surrounding area with distant
metastases.
Unfortunately, despite its importance, the
TNM/UICC classification is often poorly
documented in cancer registries (Søgaard et al., 2012).
For example, in one of the oldest national cancer
registries, the Danish Cancer Registry (DCR), a
proportion of 25% missing TNM information is
reported in patients with prostate cancer aged 0-39
years. In the same registry, the missing TNM
information of colon and rectal cancer was examined
with respect to age, comorbidities, and year.
For colon cancer, the percentage of missing TNM
information increased, from 28.7% in 2004 to a value
of 35.2% in 2009 (Ostenfels et al., 2012). Missing
TNM values are also observed in other cancer
registries, such as the Mallorca Cancer Registry
(Ramos et al. 2015).
The aim of this work is to investigate the
possibility of predicting the TNM classification into
the five UICC stages using statistical learning
methods based on cancer registriy data.
2 MATERIAL AND METHODS
The aim of this work is to investigate the possibility
of predicting the TNM classification into UICC
stages using statistical learning methods based on
cancer registry data.
2.1 Data Acquisition
Data from the Cancer Registry Clinic Arlesheim
(CRCA) were used for the analysis. The CRCA was
established in the 1960s. It has contained data from a
follow-up database since 1961, additional data from
the documentation of the international oncology
database QuaDoSta since 2010 (Schad, 2016), and
data from its own hospital information system (HIS)
since 2016. They contribute with different magnitude
to the documentation of the clinical course of
different cancer entities in the CRCA (Ostermann et
al. 2022).
The complexity of the data structure is already
evident from the different components from which
the CRCA obtains its data, which makes it likely that
the UICC stages will be missed, especially in the area
of the older follow-up database.
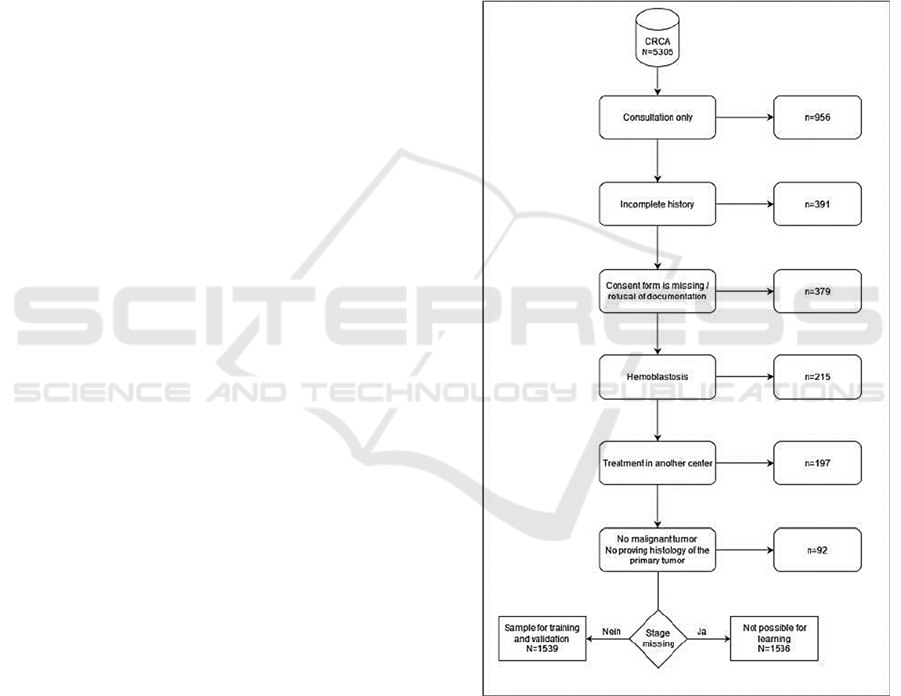
Figure 1: Flow chart for the inclusion/exclusion of data.
The CRCA contains a total of 5,305 records. In
n=956 cases (18.2%), only one consultation
appointment was available. An incomplete history led
to data exclusion in n=391 cases (7.4%). In n=379
records (7.1%), there was no informed consent from
the patient for further use of the data or
documentation was refused. In n=215 cases (4.1%),
the data concerned hematoblasts not amenable to
HEALTHINF 2023 - 16th International Conference on Health Informatics
118
TNM classification. In another 197 cases (3.7%),
treatments were performed at another clinical centre,
and in 92 cases (1.7%), there was no proving
histology of the primary tumour.
Therefore, a total of n = 3075 cases in principle
were suitable for evaluation. However, this sample
consisted of a total of only n=1539 cases (50.0%)
with tumor staging, which was used as a sample for
training and validation. For n=1536 cases without
tumor staging, supervised learning would have been
possible, but due to lack of cross-validation,
verification of learning outcomes would not have
been possible. Accordingly, the following analysis
was performed on N = 1539 cases (Fig.1).
2.2 Classification Methods
Especially in cases where no further data are available
or patient records are no longer accessible for
completion, appropriate statistical methods can be
important tools to complete the clinical
documentation in such cases for scientific evaluation.
However, the predictive power of such methods is
also linked to the existing data quality of the available
data in the registry. So far, there are only a few
corresponding studies in the literature on this topic.
Therefore, the choice of methods is not
predetermined by existing approaches or models.
From other studies, classification and regression
trees, random forests and gradient tree boosting and
logistic regression analysis are known as established
as reliable supervised learning methods (Hancock et
al., 2005, Freeman et al., 2016; Boughorbel et al.,
2016). Therefore, they are used as statistical methods
for the problem at hand.
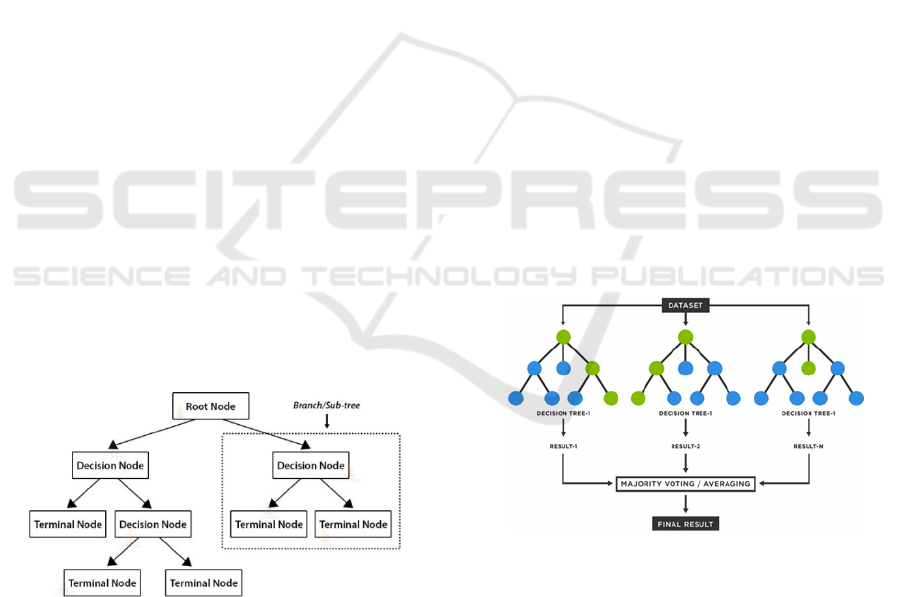
Figure 2: Development of a CART-model (from:
https://dphi.tech/blog/introduction-to-decision-tree-
algorithm/).
Classification and Regression Trees
Classification and regression trees (CART) are
partitioning methods using recursive splits. A tree
consists of two elements: a tree decision structure and
a prediction structure. By using a series of recursive
binary splits for every possible predictor,
homogeneous subsets of the sample are created
(Buskirk, 2018) and a tree topology with nodes, leafes
and branches is created (Figure 1). To prevent
overfitting and overdimensionality of the grown
classification tree, the tree is pruned back in a next
step using the Gini index for categorical outcomes
and the sum of squared errors for continuous
variables.
Random Forests
Random forests as the name says, are collections of
decision trees whose results are aggregated into one
final result. According to (Breiman, 2001), the
algorithm for random forests is as follows:
For b=1 to B:
- Draw a bootstrap sample Z^* of sample size N
from the training data.
- Grow a random forest tree T on the bootstrap
sample by repeating the following steps until
the final node reaches a minimum size:
o Randomly choose m variables from the
p variables.
o Choose the best pair (splitting variable,
splitting point) from the m variables.
o Split the node into two daughter nodes.
o Output the ensemble of trees
For classification, the model prediction of the
random forest is given by the class selected by most
trees (Fig.3).
Figure 3: Process of the random forest algorithm
(from: https://www.tibco.com/de/reference-center/what-is-
a-random-forest) 1539 cases.
Gradient Tree Boosting
Besides the Random Forest method, Gradient tree
boosting (GBT) ensemble method. Again a learning
method is applied several times to the training data.
In contrast to Random forests the individual models
are not considered and adjusted separately, but rather
in an iterative procedure with each model trying to
predict the error left over by the previous model to an
Development, Implementation and Validation of a Stochastic Prediction Model of UICC Stages for Missing Values in Large Data Sets in a
Hospital Cancer Registry
119

additive overall model. In each step a regression tree
is fitted such that terminal regions emerge. The
algorithm therefore is as follows:
1. Initialize a simple prediction model
2. Train a new model that learns from the mistakes
of the old one
3. Combine the weak models to a stronger model
4. Repeat step 2 and 3 until selected termination
condition occurs.
Residuals here correspond to negative gradients
of the error function, which gives the naming of the
procedure (Mayr et al., 2014). Figure 4 illustrates the
algorithm graphically.
Figure 4: Illustration of the gradient tree boosting
algorithm (https://medium.com/swlh/gradient-boosting-
trees-for-classification-a-beginners-guide-596b594a14ea).
2.3 Dependent and Independent
Variables
In all three models, UICC classification was defined
as the dependent variable. However, due to sample
size for each stage, a dichotomous variable was
created:
0 = Stage 0 - II
1 = Stage III - IV
The following parameters served as independent
variables
- Age at diagnosis
- Chemotherapy history (y/n)
- First diagnosis of distant metastases
- Systemic therapy: 1st entry chemotherapy (y/n)
- Radiation therapy in the medical history (y/n)
- Radiotherapy (y/n)
- Chemotherapy (y/n)
- Surgery (y/n)
- 1 year survival (y/n)
- 2 year survival (y/n)
- 5 year survival (y/n)
2.4 Validation and Performance
Measures
In cases of small sample sizes performance measures
can be determined using cross-validation. In this
procedure, data are randomly divided into K
approximately equal subsamples. One part at a time
is used for validation and the remaining K-1 parts are
used for training. This is done k=1,...,K times
resulting in K performance measures which are
combined into one measure.
The following performance measures are applied:
Mean Misclassification Error
The Mean misclassification error (mmce) is the
misclassification rate, which can be calculated as
follows:
𝑚𝑚𝑐𝑒
∑
𝐼𝑐̂
𝑥
with
𝐼𝑐̂
𝑥
1,𝑖𝑓 𝑐̂
𝑥
𝑐𝑥
0,𝑖𝑓 𝑐̂
𝑥
𝑐𝑥
That is, the errors are summed and divided by the
number of predictions n.
Receiver Operating Characteristic Curve
The Receiver Operating Characteristic curve (ROC
curve) is created by plotting the false positive rate
against the true positive rate. In doing so, the
threshold for class assignment is systematically
varied across all values. The area under the ROC
curve (AUC) is the respective performance measure
and ranges from 0.5 to 1. An AUC of > 0.8 is
considered to be good, and an AUC > 0.9 is
considered to be very good (Šimundić, A, 2009).
Cohen's Kappa Coefficient of Agreement
Cohen's kappa coefficient of agreement is given by
𝜅1
1 𝑝
1 𝑝
where p
0
is the observed frequency of agreement
and p
e
is the expected frequency of agreement at
independence. Cohen’s kappa normally ranges from
0 to 1. A value of 1 means perfect agreement. A value
of 0 corresponds to agreement that is consistent with
pure chance. In seldom cases negative values occur,
which indicate a match that is even smaller than a
random match. Landis and Koch (1977) judge values
of > 0.6 as sufficient for agreement.
2.5 Software
Classification and statistical analysis is performed
using the statistical software R (R version 3.6.1). For
classification the R package mlr2 is used.
HEALTHINF 2023 - 16th International Conference on Health Informatics
120
3 RESULTS
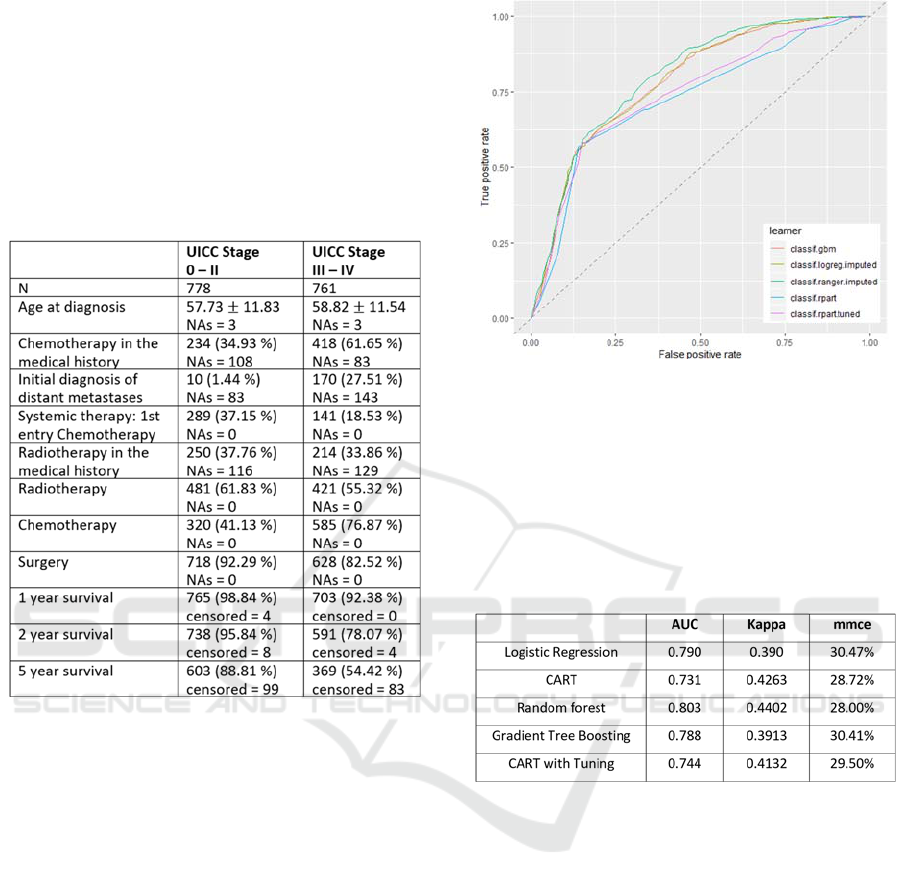
Table 1 shows the distribution of predictor data
among the respective UICC stagings.
Table 1: Distribution of the predictor data among the
respective UICC stagings. For metric variables mean ± SD
and for binary variables absolute frequency and relative
frequency in %) are shown. NAs denotes the number of
missing values.
Especially in the variables "Chemotherapy in the
medical history", "First diagnosis of distant
metastases" and "Systemic therapy" clear differences
between the two groups are recognizable. The extent
to which these differences lead to sufficiently good
classification results will be investigated in the
following analyses.
Figure 2 shows the joint display of the ROC
curves of the different classification methods. Even a
mere eye-validation of the curves shows a rather
moderate classification performance
Table 2 presents the summary of the performance
measures of goodness of the different methods.
Comparing the related methods with each other, it
is noticeable that the mean classification rate of all
methods is between 28.0% (random forest) and
30.41% (gradient boosting), which can be considered
rather insufficient for a classification algorithm.
Also, the AUCs have values between 0.731 and
0.803, which also does not meet the standards for a
valid procedure, for which an AUC > 0.8 is defined
as good and an AUC > 0.9 as very good (cf.
Šimundić, 2009).
Figure 5: ROC curves of the different classification
methods (classif.logreg.imputed: Logistic regression;
classif.rpart: CART; classif.ranger.imputed: random forest;
classif.gbm: gradient tree boosting; classif.rpart.tuned:
CART with tuning).
Table 2: Performance measures of goodness of the different
methods. (classif.logreg.imputed: Logistic regression;
classif.rpart: CART; classif.ranger.imputed: random forest;
classif.gbm: gradient tree boosting; classif.rpart.tuned:
CART with tuning).
The kappa values for the agreement between
classification result and actual UICC are also in a
comparable range with values between 0.39 and 0.43,
which, however, is also not sufficient according to the
classification of Landis and Koch (1977).
4 CONCLUSIONS
Missing data is a common problem in
epidemiological research (Shah et al., 2014),
especially in population-based cancer registries
(Seneviratne et al. 2014)). Both classical statistical
prediction models, such as logistic regression or
classification trees, and newer machine learning
methods, such as random forests or gradient boosting
methods, are used to impute missing data in many
areas of epidemiology (Eisemann et al. 2011). Both
the completeness of primary data and the accuracy of
Development, Implementation and Validation of a Stochastic Prediction Model of UICC Stages for Missing Values in Large Data Sets in a
Hospital Cancer Registry
121

staging coding need to be improved for cancer
registries to fulfill their growing role in cancer
control, according to a Europe-wide review of cancer
registries (Minicozzi et al., 2017).
Extensive analyses have not yet been conducted
in the area of cancer staging prediction. In their
simulation study, Eisemann's group reported initial
imputation of UICC stages with concordance rates of
approximately 80% (Eisemann et al. 2011). In this
work, we therefore investigated the extent to which
the above-mentioned methods for predicting missing
data in tumor stages yielded similar results. In this
context, logistic regression, as a well-known method,
served as a benchmark for comparison with the other
four methods.
The results of this work are below the orders of
magnitude of Eisemann's group. Even though no
multiple imputation was performed in the present
approach, the misclassification rates were in the range
of 28.0% to 30.4%. Similar to Eisemann's work, the
results of the classical methods (logistic regression,
classification tree) were not inferior to those of
machine learning (random forests, gradient boosting)
both in their concordance (0.39; 0.43) and in their
prognostic quality (AUC 0.79; 0.73) (concordance:
0.44; 0.39 AUC: 0.80; 0.79).
Nevertheless, the kappa values between 0.39 for
logistic regression and 0.44 for random forests
according to the classification of Koch and Landis
(1977) are in the rather moderate range. Moreover,
the UICC stagings were additionally combined into a
binary variable, which again reduces the significance.
Also, with only 1539 records, the data set
considered here was significantly lower than those of
larger cancer registries, so that the results found here
should be interpreted with caution. In addition, a
multiple imputation strategy (Burgette et al., 2010)
was not used here, although it is unclear whether this
would have led to a significant improvement in the
classification results in the present case.
While in contrast to Eisemann et al., 2011) the
methods used did not exhibit convergence problems,
the heterogeneity in the primary data was a clear
challenge for data management. Although in this
particular case this may be explained by the historical
genesis of the cancer registry, other work also
highlights the issue of primary data heterogeneity as
a source of statistical error (Carmora-Bayonas et al.,
2018). Here, it would be important to optimize the
harmonization of data across data sources through
standards for data collection, recording, and
presentation to facilitate the analysis of large data sets
(Le Sueur et al., 2020).
Although the results of this paper are somehow
disappointing, future work in this field should
nevertheless continue and particularly pay attention
to new technologies and strategies in the field of
artificial neural networks and machine learning to
develop sound prognostic classification models based
on available registry data to support an individualized
approach to cancer treatment.
ACKNOWLEDGEMENT
We would like to explicitly appreciate the friendly
support and constant helpfulness with all questions
concerning the QDS system by the FIH team (Antje
Merkle, Danilo Pranga and Friedemann Schad).
REFERENCES
Alam, A.S. (2011). Cancer Registry and Its Different
Aspects. Journal of Enam Medical College 1(2): 76-80.
Bhagat, N. K., Mishra, A. K., Singh, R. K., Sawmliana, C.,
& Singh, P. K. (2022). Application of logistic
regression, CART and random forest techniques in
prediction of blast-induced slope failure during
reconstruction of railway rock-cut slopes. Engineering
Failure Analysis, 137, 106230.
Boughorbel, S., Al-Ali, R., & Elkum, N. (2016). Model
comparison for breast cancer prognosis based on
clinical data. PLoS One, 11(1), e0146413.
Breiman, L. (2001). Random forests. Machine learning,
45(1), 5-32.
Burgette, L. F., & Reiter, J. P. (2010). Multiple imputation
for missing data via sequential regression trees.
American journal of epidemiology, 172(9), 1070-1076.
Buskirk, T. D. (2018). Surveying the forests and sampling
the trees: An overview of classification and regression
trees and random forests with applications in survey
research. Survey Practice, 11(1), 1-13.
Carmona-Bayonas, A., Jimenez-Fonseca, P., Fernández-
Somoano, A., Álvarez-Manceñido, F., Castañón, E.,
Custodio, A., ... & Valiente, L. P. (2018). Top ten errors
of statistical analysis in observational studies for cancer
research. Clinical and Translational Oncology, 20(8),
954-965.
Chen, M. M., & Chen, M. C. (2020). Modeling road
accident severity with comparisons of logistic
regression, decision tree and random forest.
Information, 11(5), 270.
Denoix, P. F. (1944). Tumor, node and metastasis (TNM).
Bull Inst Nat Hyg (Paris), 1(6), 1-69.
Edmonds, J. (1971). Matroids and the greedy algorithm.
Mathematical programming, 1(1), 127-136.
Eisemann, N., Waldmann, A., & Katalinic, A. (2011).
Imputation of missing values of tumour stage in
HEALTHINF 2023 - 16th International Conference on Health Informatics
122

population-based cancer registration. BMC medical
research methodology, 11(1), 129.
Freeman, E. A., Moisen, G. G., Coulston, J. W., & Wilson,
B. T. (2016). Random forests and stochastic gradient
boosting for predicting tree canopy cover: comparing
tuning processes and model performance. Canadian
Journal of Forest Research, 46(3), 323-339.
Friedman, J. H. (2002). Stochastic gradient boosting.
Computational statistics & data analysis, 38(4), 367-
378.
Hancock, T., Put, R., Coomans, D., Vander Heyden, Y., &
Everingham, Y. (2005). A performance comparison of
modern statistical techniques for molecular descriptor
selection and retention prediction in chromatographic
QSRR studies. Chemometrics and Intelligent
Laboratory Systems, 76(2), 185-196.
Hastie, T., Tibshirani, R., & Friedman, J. H. (2017). The
Elements of Statistical Learning: Data Mining,
Inference, and Prediction: Springer.
Landis, J. R., & Koch, G. G. (1977). The measurement of
observer agreement for categorical data. Biometrics,
159-174.
Le Sueur, H., Bruce, I. N., & Geifman, N. (2020). The
challenges in data integration–heterogeneity and
complexity in clinical trials and patient registries of
Systemic Lupus Erythematosus. BMC Medical
Research Methodology, 20(1), 1-5.
Mayr, A., Binder, H., Gefeller, O., & Schmid, M. (2014).
The evolution of boosting algorithms. Methods of
information in medicine, 53(06), 419-427.
Meyer, G (1911). Bericht über die zehnjährige Wirksamkeit
des Deutschen Zentralkomitees für Krebsforschung.
Zeitschrift für Krebsforschung 1911; 10: 8–33.
Minicozzi, P., Innos, K., Sánchez, M. J., Trama, A., Walsh,
P. M., Marcos-Gragera, R., ... & White, C. (2017).
Quality analysis of population-based information on
cancer stage at diagnosis across Europe, with
presentation of stage-specific cancer survival estimates:
A EUROCARE-5 study. European Journal of Cancer,
84, 335-353.
Ostenfeld, E. B., Frøslev, T., Friis, S., Gandrup, P., Madsen,
M. R., & Søgaard, M. (2012). Completeness of colon
and rectal cancer staging in the Danish Cancer Registry,
2004–2009. Clinical epidemiology, 4 Suppl 2(Suppl 2),
33-38. doi:10.2147/clep.s32362
Ostermann, T., Appelbaum, S., Baumgartner, S., Rist, L.,
& Krüerke, D. (2022). Using Merged Cancer Registry
Data for Survival Analysis in Patients Treated with
Integrative Oncology: Conceptual Framework and First
Results of a Feasibility Study. In HEALTHINF (pp.
463-468).
Ramos, M., Franch, P., Zaforteza, M., Artero, J., & Durán,
M. (2015). Completeness of T, N, M and stage grouping
for all cancers in the Mallorca Cancer Registry. BMC
Cancer, 15(1), 847. doi:10.1186/s12885-015-1849-x
Schad, F., Matthes,B., Pissarek, J. et al. (2016).
QuaDoSta: Qualitätssicherung, Dokumentation
und Statistik, eine open source Lösung am
Beispiel onkologischer Dokumentation; http://www.
fih-berlin.de/tumorbasisdokumentation.html [Stand:
07Also, the AUCs have values between 0.731 and
0.803, which also does not meet the standards for a
valid procedure, for which an AUC > 0.8 is defined as
good and an AUC > 0.9 as very good (cf. Šimundić,
2009).04.2016]
Seneviratne, S., Campbell, I., Scott, N., Shirley, R., Peni,
T., & Lawrenson, R. (2014). Accuracy and
completeness of the New Zealand Cancer Registry for
staging of invasive breast cancer. Cancer epidemiology,
38(5), 638-644.
Shah, A. D., Bartlett, J. W., Carpenter, J., Nicholas, O., &
Hemingway, H. (2014). Comparison of random forest
and parametric imputation models for imputing missing
data using MICE: a CALIBER study. American journal
of epidemiology, 179(6), 764-774.
Šimundić, A. M. (2009). Measures of diagnostic accuracy:
basic definitions. Ejifcc, 19(4), 203.
Søgaard, M., & Olsen, M. (2012). Quality of cancer registry
data: completeness of TNM staging and potential
implications. Clinical epidemiology, 4 Suppl 2, 1-3.
doi:10.2147/clep.s33873
Takes, R. P., Rinaldo, A., Silver, C. E., Piccirillo, J. F.,
Haigentz Jr, M., Suárez, C., . . . Ferlito, A. (2010).
Future of the TNM classification and staging system in
head and neck cancer. Head & Neck, 32(12), 1693-
1711. doi:10.1002/hed.21361
Wagner, G. (1991): History of cancer registration. In:
Jensen OM, Parkin DM, MacLennan R et al, (eds).
Cancer registration: principles and methods. IARC
scientific publication 95. Lyon: International Agency
for Research on Cancer: 3-6.
Development, Implementation and Validation of a Stochastic Prediction Model of UICC Stages for Missing Values in Large Data Sets in a
Hospital Cancer Registry
123
