
PVT based Blood Vessel Segmentation and Polyp Size Estimation in
Colonoscopy Images
Insaf Setitra
1
, Yuji Iwahori
2
, Yacine Elhamer
1
, Anais Mezrag
1
, Shinji Fukui
3
and Kunio Kasugai
4
1
Department of Artificial Intelligence and Data Science, University of Science and Technology Houari Bouemediene,
USTHB, Algiers, Algeria
2
Department of Computer Science, Chubu University, Kasugai, Aichi, 487-8501 Japan
3
Department of Information Education, Aichi University of Education, Kariya, Aichi, 448-0001 Japan
4
Department of Gastroenterology, Aichi Medical University, Nagakute, Aichi, 480-1195 Japan
kuku3487@aichi-med-u.ac.jp
Keywords:
Polyp Size Estimation, Polyp Segmentation, Blood Vessel, Colorectal Cancer, PVT, Autoencoder.
Abstract:
The size of colorectal polyps is one of the factors conditioning the risk of synchronous and metachronous
colorectal cancer (CRC). In this work, we are interested in the automatic measurement of polyp sizes in
colonoscopy videos. The study is performed in two steps: (1) first the detection and segmentation of the
polyp by the neural network Polyp-PVT and then (2) the classification of the polyp into different classes (type
of disease, size of the polyp). This is done by extracting information from blood vessels, a parameter that
has a low variability and is present in the majority of colonoscopic videos. This method has been validated
by two local Hepato-Gastro-Enterology specialists. Once the size of the polyp is extracted, a classification
of polyps as susceptible malignant (polyp size ≥ 6 mm) and susceptible benign (polyp size < 6 mm) is
performed. Our approach reaches an accuracy of 85.61% for the first category and 73.92% for the second
one and is comparable to human classification which is estimated to 52% for beginners and 71% for experts
endoscopists.
1 INTRODUCTION
Colorectal cancers CRCs include cancer of the colon
and part of the rectum. Although CRC is the second
most deadly cancer, it is one of the easiest to pre-
vent. The detection of CRC and the determination
of the malignancy of polyps are highly dependent on
the characteristics of the corresponding polyp, firstly
its size, then its shape and type. Polyp size estima-
tion can be manual (performed by endoscopists) or
automatic (performed using a computed-based algo-
rithm). The methods of estimating the size of polyps
practiced by endoscopists, are generally one of the
following two processes: the exploitation of spatial
information, and the use of reference objects. Most
of the works in the literature focus on automating
one of these approaches for size estimation. Hyun
et al. (Hyun et al., 2011) developed graduated mea-
suring devices, which have scale marks of 5 mm in-
terval to measure a polyp in vivo (real) and achieved
a classification accuracy of 93%, 16% and 58% with
their graduated device for polyp sizes of 0-5 mm, 6-
9 mm and ≥ 10 mm respectively. Itoh et al. (Itoh
et al., 2018) proposed a relaxed form of size estima-
tion as a binary classification problem and solved it
by the deep neural network BseNet. he latter is used
to estimate the size of the polyps and classify them
into polyps smaller than 10 mm in diameter and those
larger. In another work, Itoh et al. (Itoh et al., 2021)
developed a method for automated binary classifica-
tion of polyp size, with class one 1-9 mm and class
two ≥ 10 mm. This is done by estimating the three-
dimensional spatial information of a polyp. Suykens
et al. (Suykens et al., 2020) developed a system al-
lowing to deduce objectively the size of polyps in the
endoscopic image using a reference biopsy forceps.
To do so, two distinct deep learning algorithms were
applied: (1) polyp delineation and (2) detection of two
landmarks on the forceps. The system can detect the
polyp and the forceps in 71% of the tested images.
The adjusted mean difference is +0.52 mm (SD 1.78
mm) and +1.40 mm (SD 1.82 mm) between the ac-
tual size and the one predicted by the algorithm or the
endoscopist respectively. As a drawback, the biopsy
forceps are not always in the field of view, and must
be deployed manually by the physician at a precise
814
Setitra, I., Iwahori, Y., Elhamer, Y., Mezrag, A., Fukui, S. and Kasugai, K.
PVT based Blood Vessel Segmentation and Polyp Size Estimation in Colonoscopy Images.
DOI: 10.5220/0011666700003411
In Proceedings of the 12th International Conference on Pattern Recognition Applications and Methods (ICPRAM 2023), pages 814-821
ISBN: 978-989-758-626-2; ISSN: 2184-4313
Copyright
c
2023 by SCITEPRESS – Science and Technology Publications, Lda. Under CC license (CC BY-NC-ND 4.0)
location and with care in order to avoid perforation
of the colon wall and thus internal bleeding. Iwahori
et al.(Iwahori et al., 2022) proposed a method to re-
cover the shape and polyp size by treating the width
of the extracted blood vessel as known information.
This method used U-Net to extract blood vessels and
used the part of blood vessel near the polyp manu-
ally. While spatial methods avoid the reference object
constraint, the depth map prediction of the polyp re-
mains a difficult task. Indeed, the configuration of
colonoscopy is extremely limited. On the one hand,
endoscopes are equipped with a single 2D camera,
provided with a single light source, which makes a
large number of 3D depth and shape recovery meth-
ods unsuitable. On the other hand, the shape esti-
mation task is extremely difficult for non-Lambertian
surfaces (i.e., surfaces that are not characterized by an
apparent specular reflection component) (Woodham,
1992).
In this work, we are particularly interested in
polyp size inference based on the blood vessel diame-
ter. The diameter of the blood vessels is present in
almost every colonoscopy, with a perfect fit to the
colonic walls and a low variation in size. Hence,
we propose a simple yet effective correlation param-
eter that estimates the relative size of the polyp based
on the size in pixels of the closest blood vessels.
Once this relative size is calculated, an estimate of
the blood vessel in mm is provided (the blood ves-
sel size is slightly variable for human) and the polyp
size in mm is deduced. The remaining of paper is
organized as follows. We first introduce state-of-
the-art approaches for polyp size detection in Sec-
tion 1, we then present in Section 2 our approach for
polyp size prediction and polyp classification. We
present our results in Section 3 and conclude the
work with some perspectives in Section 4. The code
can be found at https://github.com/yelhamer/
Polyp-Size-Recovery
2 METHODOLOGY
Our goal in this study is to measure the exact size of
the polyp. For this purpose, we use the diameter of
the blood vessels since blood vessels are present in
almost every colonoscopy, and have a perfect fit to
the colonic walls and a low variation in size. The
vascularization of the body is represented by a vas-
cular tree, therefore vessels can be classified into root
and branch and therefore the caliber of these classes
is easier to determine, since the diameter of the root
is usually double that of the branch. The main idea
is to take from each image of the colonoscopy video
the largest root, since the diameter of the roots is less
variable than the diameter of the vessels themselves.
Assuming that this diameter is 1 mm and that the dis-
tance between the polyp and the selected vessel (the
root of the vessel considered as a standard) is negligi-
ble, we can establish a proportional conversion stan-
dard in order to deduce the size of the polyp.
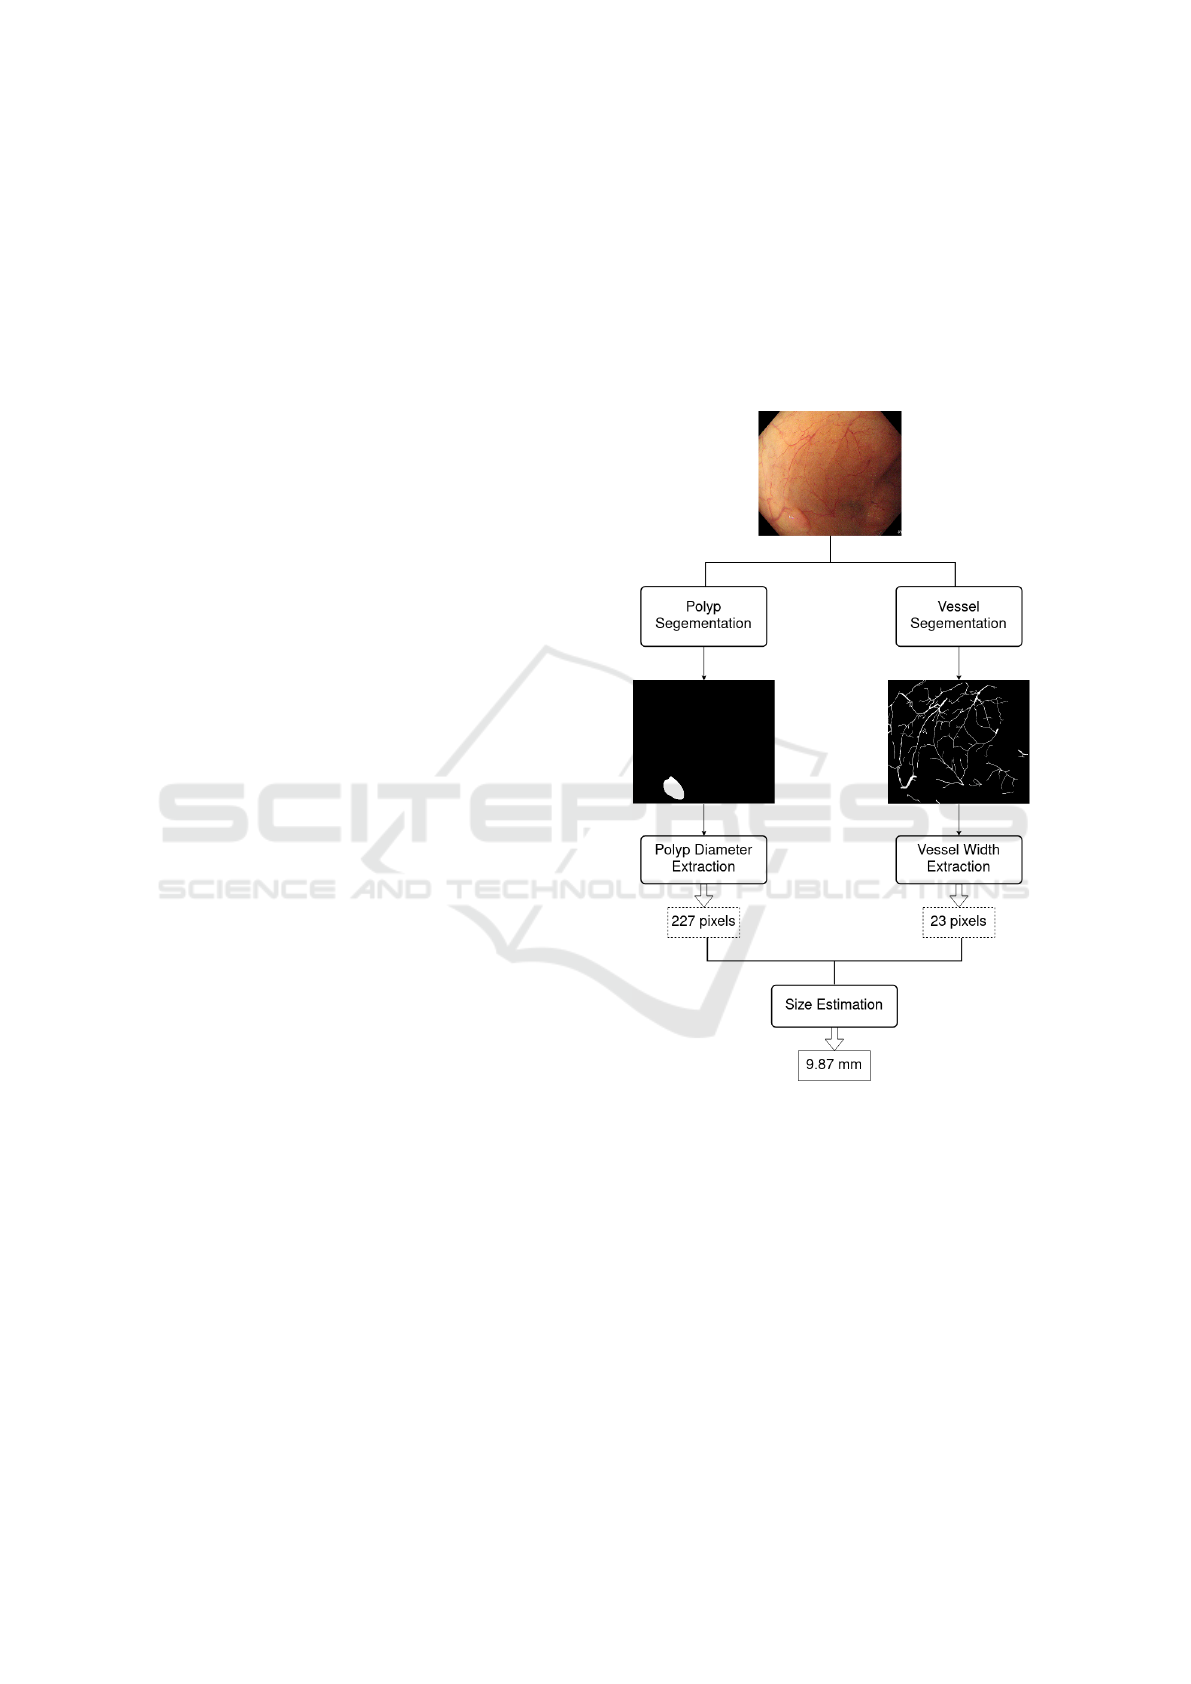
Based on this idea, we propose the general frame-
work presented in Figure 1.
Figure 1: General framework of our approach.
Each frame of the colonoscopy video is converted
to two binary masks, a first binary mask contains the
segmentation of the polyp, and the second one, the
segmentation of the blood vessels. A deep neural net-
work is used for each segmentation. Then, the masks
are post-processed in order to remove artifacts. Fi-
nally, the blood vessel root that is the closest to the
polyp is selected, and the size of the polyp is accord-
ingly inferred. The approach was approved by two
medical doctors who specialized in Hepato-Gastro-
Enterology.
PVT based Blood Vessel Segmentation and Polyp Size Estimation in Colonoscopy Images
815

2.1 Blood Vessel and Polyp
Segmentation
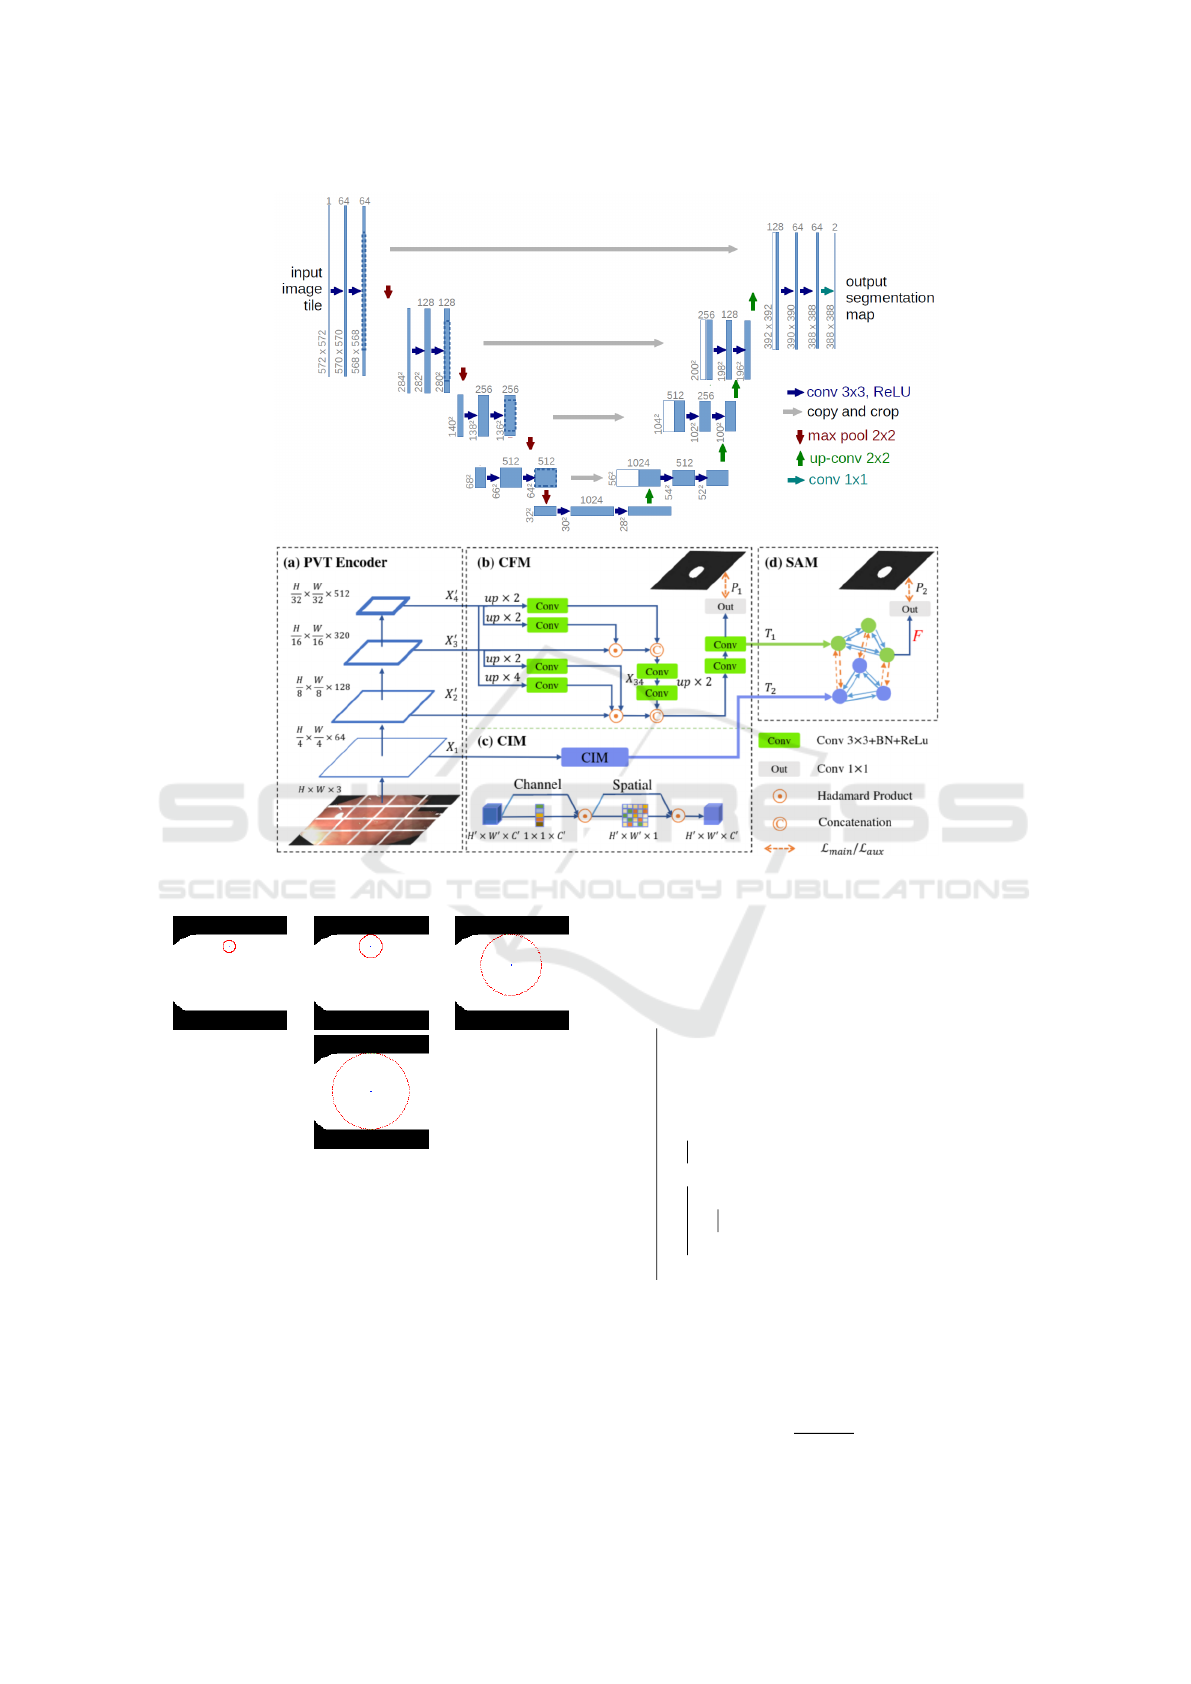
Two deep models are used for the segmentation,
namely the convolutional neural network U-Net
(Ronneberger et al., 2015) and the polyp based pyra-
midal vision transformer Polyp-PVT (Dong et al.,
2021). The architecture of the U-NET network pro-
posed in (Ronneberger et al., 2015) consists of a con-
traction path to capture the context, and a symmetric
expansion path that allows for accurate localization.
PolypPVT consists of four key modules: namely, a
pyramid vision transformer (PVT), a cascade fusion
module (CFM), a Camouflage Identification Module
(CIM), and a Similarity Aggregation Module (SAM).
Specifically, PVT is used to extract long-range depen-
dency features at multiple scales from the input im-
age. CFM is employed to collect semantic cues and
locate polyps by aggregating high-level features in a
stepwise manner. CIM is designed to remove noise
and enhance the low-level representation of polyps,
including texture, color, and edges. SAM is adopted
to merge the low-level and high-level features pro-
vided by CIM and CFM, effectively conveying the
pixel-level polyp information to the entire polyp area.
Identical to the output from U-NET, the images from
PolypPVT are gray level images. According to our
experiments, PolypPVT outperformed U-NET for the
segmentation of blood vessels. hence, only Polyp-
PVT was used for the segmentation of polyps. The
complete architecture of both U-NET and PolypPVT
is shown in Figure 2.
The outputs of the segmentation models (U-NET
and PolypPVT) are grayscale images and the pre-
dicted masks usually contains surrounding grey areas
around the segmented polyps. As a post-processing,
and in order to have binary masks of the polyp
and blood vessels we apply Otsu thresholding (Otsu,
1979) followed by dilation and erosion.
2.2 Blood Vessel Selection and Diameter
Extraction
After obtaining a binary mask showing the blood ves-
sel, the next step is to determine the largest blood ves-
sel in the image and then extract its width in pixels.
To do this, we first draw for each foreground pixel
(pixel of value 1) in the image a circle centered at
the pixel and having an initial radius of 1 pixels. The
circle is then iteratively increased. At each iteration,
each pixel of the perimeter of the circle is analyzed. If
that pixel of the circle belongs to the foreground (has
value 0), then, the algorithm checks the pixel in the
opposite side of the perimeter. If the opposite pixel
also belongs to the foreground then, the size of the
blood vessel at this location is returned. Otherwise,
the center is shifted towards the foreground perimeter
pixel and the next iteration is performed. Once a cir-
cle that best fits the blood vessel is found, the radius
of this circle is found, the radius of this circle is re-
turned. This radius is taken into account in the width
of the vessel and is therefore considered as the width
of a part of the blood vessel that contains the speci-
fied point. The same process is repeated for all pixels
of the foreground and the diameter of each circle cen-
ter at each foreground is returned. The algorithm is
presented graphically in Figure 3.
Once all diameters are obtained, we choose the
largest diameter as the blood vessel root. The latter
will be used to infer the size of the polyp. The com-
plete algorithm of extracting the size of the largest
blood vessel in the colonoscopy video frame is shown
in Algorithm 1.
Read the segmented frame B;
maxBD ← 0;
// maxBD is the maximum blood
vessel diameter
for each pixel P in B do
Get diameter D of the blood vessel
centered at P;
if D > maxBD then
maxBD ← D;
end
end
Return maxBD ;
Algorithm 1: Largest blood vessel diameter extraction.
2.3 Polyp Diameter Extraction
Algorithm
To get the diameter of the polyp in pixels, we rotate
the polyp in the segmentation mask several times and
compute the diameter as the largest side of the bound-
ing box (Suzuki and be, 1985) surrounding the polyp.
We perform several rotations and consider the diam-
eter of the polyp as the largest one. The pseudo-code
associated with this method is shown Algorithm 2.
2.4 Classification of Polyps
As discussed earlier in this section, From a medical
point of view, and based on our discussions with med-
ical doctors, the size of the blood vessels has low vari-
ability among humans which makes it reliable infor-
mation to infer the size of the polyp. As discussed
earlier in this section, the size of the blood vessels
(venules andtimeserioles) at the root is can be as-
ICPRAM 2023 - 12th International Conference on Pattern Recognition Applications and Methods
816
(a)
(b)
Figure 2: Deep architectures used. (a) U-NET architecture, (b). Polyp-PVT architecture.
(a) (b) (c)
(d)
Figure 3: Circle drawing for blood vessel diameter extrac-
tion, black: background, white: blood vessel, red : circle,
blue: center of the circle. (a) iteration 8, (b) iteration 15,
(c). iteration 40, (d). final iteration.
sumed to be 1 mm. We also consider that the largest
blood vessel detected using our approach is the clos-
est to the polyp. Given the diameter of the polyp and
that of the selected vessel known in pixels, we finally
compute the size of the polyp (PS) in mm assuming
that that of the vessel is 1 mm using equation 1 where
maxPD and maxBD are respectively the size of polyp
Read the segmented frame B;
maxPD ← 0;
// maxPD is the maximum polyp
diameter
for D ← 1 to 360 do
Rotate B around its center C by D degrees
;
Obtain the height H and width W of the
bounding rectangle of the polyp;
if H > maxPD then
maxPD ← H;
else
if W > maxPD then
maxPD ← W ;
end
end
end
Return maxPD ;
Algorithm 2: Polyp diameter extraction.
and size of the blood vessel in pixels.
PS =
maxPD
maxBP
× 1mm (1)
PVT based Blood Vessel Segmentation and Polyp Size Estimation in Colonoscopy Images
817

After estimating the size of these polyps using the
width of the blood vessels, we proceed to the classifi-
cation of the polyps in two distinct classes:
• Susceptible Benign: this class includes polyps
smaller than 6 mm humans present the least re-
liable information and also the category of polyps
that endoscopists prefer to treat by surveillance
colonoscopy and not resection.
• Susceptible Malignant: this class includes
polyps larger than 6 mm that have a higher risk
of malignancy, therefore, it is preferable for this
class of polyps to perform a polypectomy to avoid
and/or predict a CRC.
At this step, a simple comparison of the size in mm
obtained in the previous step will allow the classifica-
tion of the polyp. Note that we do not respectively use
a machine learning algorithm for the classification at
this stage.
3 EXPERIMENTATION RESULTS
Experiments were performed under the google collab-
oratory environment. The free version of Colab offers
a Nvidia K80 GPU. This version was not sufficient
for our training, since U-Net uses a relatively large
dataset. As for Polyp-PVT, it is a dense deep neural
network, therefore heavier than an average CNN net-
work. These factors led us to extend our use to Colab
Pro offering a much more powerful Tesla P100 GPU
with 16 VRAM. Several libraries were also used,
principally TensorFlow and Keras used for the U-Net
network implementation, PyTorch is used for the im-
plementation of Polyp-PVT, and OpenCV for image
processing necessities. Besides, as our goal is to in-
fer the size of the polyps from the size of the blood
vessels, and to classify polyps according to their size,
we needed a dataset containing segmentation of the
blood vessels, segmentation of the polyps, and size
of the polyps. We present the following first the data
preparation, then the metrics used, and finally our re-
sults with discussions.
3.1 Data Preparation
The dataset used for vessel segmentation was con-
structed manually. We selected a set of 35 images
from the SUN dataset (Misawa et al., 2020), (Itoh
et al., 2020), based on the quality of the images, the
entire presence of the polyp, and the absence of ir-
relevant objects in the image (mucosa, salts, biopsy
forceps, medical hood, etc). Some examples of ac-
cepted and discarded polyps from the SUN dataset
can be seen in Figure 4. In order to segment manu-
ally the blood vessels of these images, we have car-
ried out several work sessions with medical doctors,
especially to distinguish the blood vessels from red ar-
eas likely to be areas of infection. For this study, we
also neglected the background vessels and the capil-
lary vessels (vessels present on the polyp). The seg-
mentation was performed using GIMP. As the seg-
mentation of blood vessels was time-consuming and
resulted in few images, we adopted two techniques
for data augmentation, namely image clipping, and
random patches. Image clipping was used to gener-
ate 552 images of size 250 × 250 pixels (average of
999 ×869 pixels for original images) . This ensemble
was separated into 442 images for training the Polyp-
PVT network and 112 for testing it. For the U-NET
model, as the latter requires a large amount of data to
train, we generated random patches of the previously
segmented images. This resulted in 288000 images
of size 48 × 48 pixels. 224000 were used for training
and 64000 for test. For polyp segmentation, we used
40 images from the SUN dataset. As the SUN dataset
was the only dataset that contains the size of polyps
but not their segmentation. We also segmented man-
ually those polyps. Along with these 40 images, we
also included images issued from several datasets that
contain the segmentation masks but not the size of the
polyps. The training set contains 1480 images where
1450 images were obtained from the CVC-ColonDB
and CVC-300 (Bernal et al., 2015), ETIS-LaribDB
(Nguyen and Lee, 2018), Kvasir (Pogorelov et al.,
2017) datasets and 30 images from our manual seg-
mentation of SUN images. For the validation, we
used 788; 778 images from the previously mentioned
annotated datasets and 10 images from our manual
segmentation of SUN images.
3.2 Parameters Setting
For blood vessel and polyp segmentation, 200 epochs
were performed with a batch size of 32 images for
both U-NET and Polyp-PVT. Stochastic gradient de-
scent with categorical cross entropy was used for
U-NET and AdamW with binary cross entropy was
used for Polyp-PVT. Moreover, the values of Learn-
ing Rate, Weight Decay, Momentum and Nesterov for
U-NET are 0.01, 1 × e
−6
, 0.3, and False respectively.
For Polyp-PVT the values of Learning Rate, Weight
Decay, Decay Rate, Multi-scale, and Clip are 1×e
−4
,
1 × e
−4
, 0.1, [0.75, 1, 1, 25] and 0.5 respectively.
ICPRAM 2023 - 12th International Conference on Pattern Recognition Applications and Methods
818
(a) (b)
(c) (d)
(e)
Figure 4: Examples of images retained and neglected for
training. (a). retained polyp image, the polyp is clear, (b,c).
discarded polyp images, the lightening is inconsistent, (d).
discarded polyp image, the polyp is not totally apparent, (e).
accepted polyp image from the same video as (d), the polyp
is fully apparent.
3.3 Evaluation Metrics
For the evaluation of the segmentation and for com-
parison of our networks, we used the mean dice coef-
ficien (
`
uDice) where A and B are the binary predic-
tion and ground truth masks respectively and the Dice
metric is computed as follows:
• The Dice coefficient (Sørensen-Dice), also known
as the F1 score computed as follows:
DSC(A, B) =
2|A ∩ B|
|A| + |B|
(2)
For the performance evaluation of polyp classifi-
cation, we used the following two metrics:
• Average error rate: this is the average margin of
error over all the test images, between the real size
S and the size estimated
ˆ
S using our approach. It
is computed as follows where N is the number of
polyps:
AER(S,
ˆ
S) =
∑
|S −
ˆ
S|
N
(3)
• Percentage of Correct Classification: given by
the following equation where N is the number of
polyps and n is the number of polyps correctly
classified:
PCC(A, B) =
n
N
× 100 (4)
3.4 Results
The results of segmentation for both the blood vessels
and the polyps are shown in Table 1. Obtaining the
Table 1: Segmentation of Blood Vessels and Polyps.
Task mDice
Segmentation of all blood vessels using
U-Net
10.58%
Segmentation of all blood vessels using
Polyp-PVT
75.32%
Segmentation of largest blood vessels
using U-Net
10.58%
Segmentation of largest blood vessels
using Polyp-PVT
90.56%
Segmentation of all polyps using
Polyp-PVT
74.54%
Segmentation of SUN extracted polyps
using Polyp-PVT
94.64%
exact width of the largest blood vessel in an image is
one of the most important parameters for the opera-
tion of our polyp classification method. In order to be
successfully extracted, this vessel must be correctly
segmented. We have therefore, evaluated the segmen-
tation results on all patches of the images (line one
and two of Table 1), then only on the patches contain-
ing the largest blood vessel ((line three and four of
Table 1)). These patches are centered on the largest
vessel, and have twice the size of the vessel. As can
be seen in the table, Polyp-PVT clearly outperforms
U-Net in the blood vessel segmentation task for the
two sets. One of the main reasons behind the very
low metric scores of the U-Net model is that unlike
Polyp-PVT, U-Net tended to misclassify the edges of
the colon wall as blood vessels, as can be seen in Fig-
ure 5, which greatly affects the evaluation results.
(a) (b)
(c) (d)
Figure 5: Example of blood vessel segmentation on a SUN
image, (a) original image, (b) ground truth mask, (c) seg-
mentation using U-Net, (d) segmentation using Polyp-PVT.
In view of these results, we chose to use Polyp-
PVT for the segmentation of polyps. The results of
segmentation of both the whole validation dataset,
and those of only SUN images of the dataset are pre-
PVT based Blood Vessel Segmentation and Polyp Size Estimation in Colonoscopy Images
819
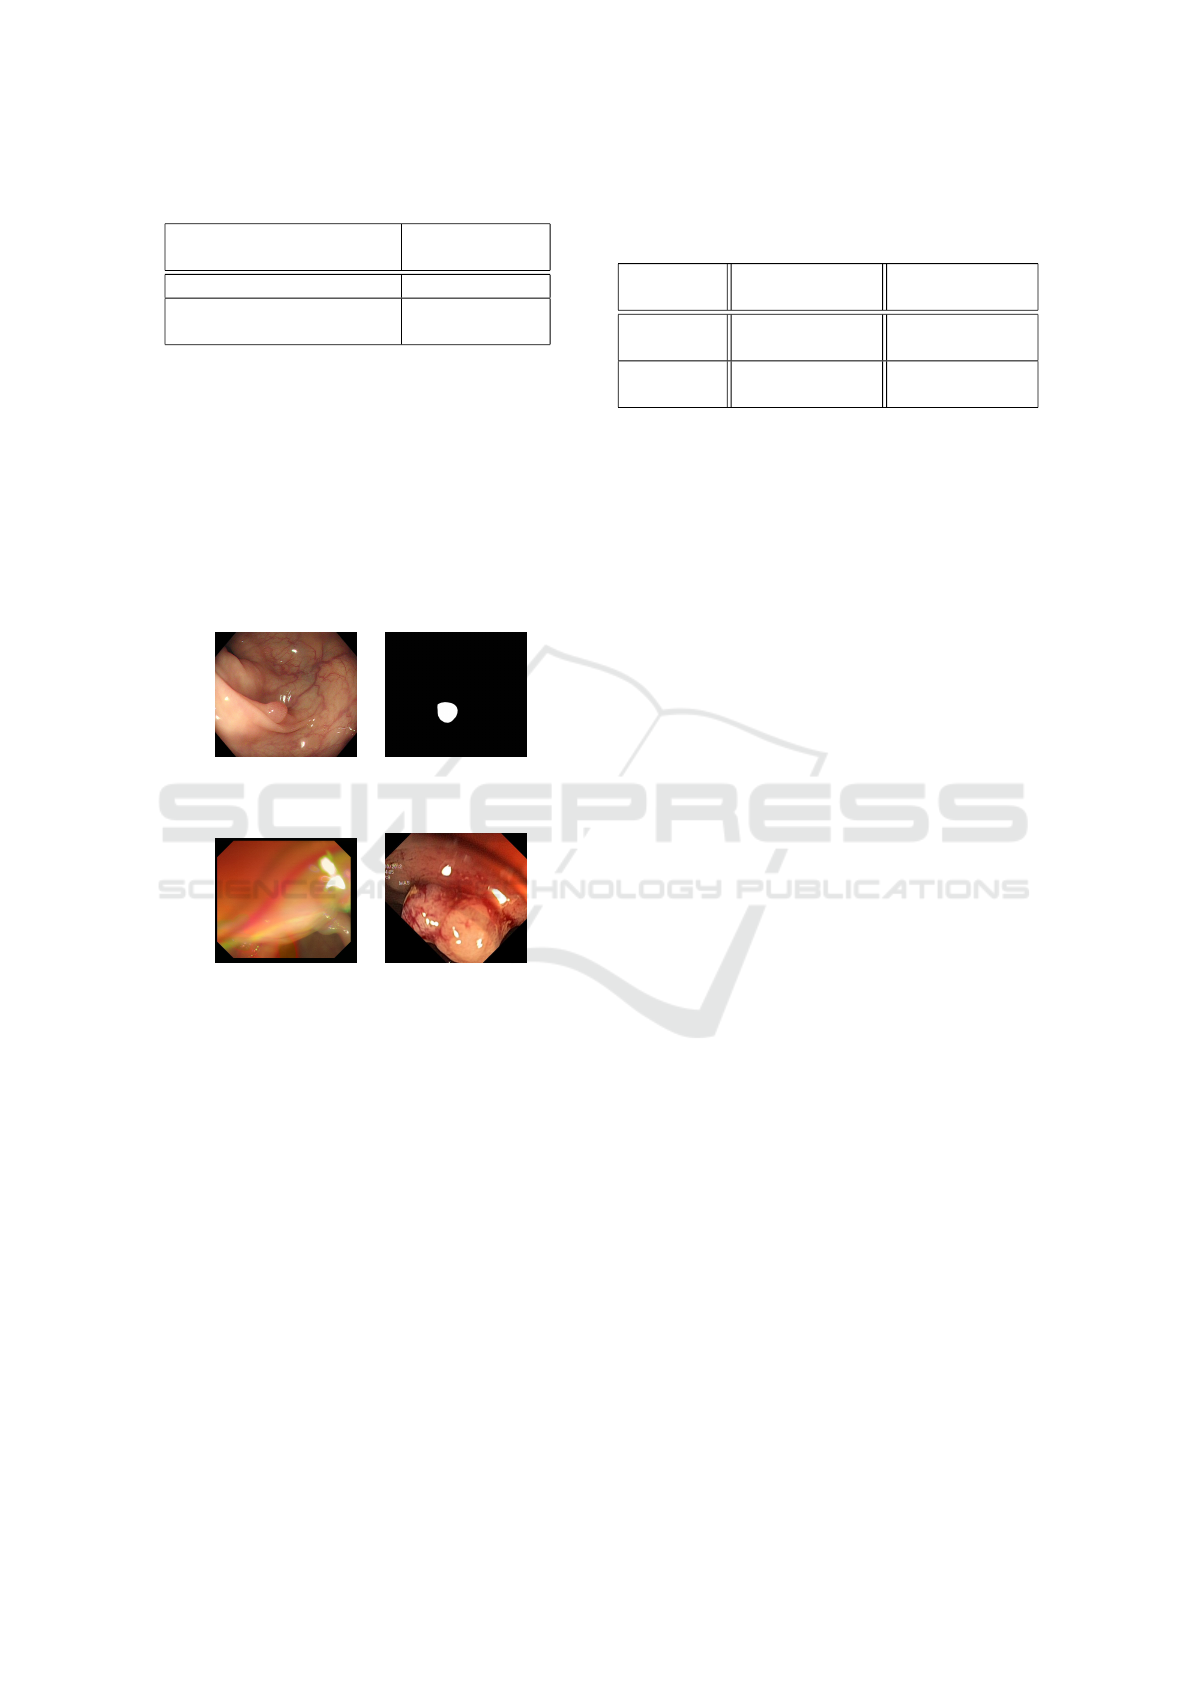
Table 2: Largest Blood Vessel based Polyp Size Prediction.
Binary Segmented
Polyps Used
Average Error
Rate AER
Ground truth polyp masks 1.91
Binary polyp masks using
PolyPVT
2.63
sented in Table 1 line five and six. An example of
segmentation can be seen in Figure 6. As can be seen,
Polyp-PVT displays a high level of accuracy, and is
highly suitable for our approach. We can see that the
results in the partial SUN validation set were excep-
tionally good, compared to those in the whole vali-
dation set. And this is most likely due to the high
volatility and poor quality of some images. Since for
the partial training and validation set, we only chose
clear images. An example of these unclear images can
be seen in Figure 7.
(a) (b)
Figure 6: Example of polyp segmentation on a SUN image,
(a) original image, (b) segmentation using Polyp-PVT.
(a) (b)
Figure 7: Example of images that caused bad segmentation
results in the validation set, (a) Image from CVC-ColonDB
dataset, (b) Image from the Kvasir dataset.
The results of the polyp size prediction in mm is
shown both for the ground truth masks and the pre-
dicted masks. The effect of the segmentation on the
polyp size prediction can hence be seen in Table 2.
According to the results shown, it is difficult at this
stage to judge on the AERs obtained as the judgement
relies more on expert medical doctors.
After having estimated the exact size of the polyp,
we present in Table 3 the results for its classification
into one of the two classes (susceptible benign and
susceptible malignant). The PCC is calculated using
Equation 4 for each class, i.e. PCC of class i is equal
to the number of polyps classified correctly as class i
over the number of polyps actually belonging to class
i. In this experiment, we compare also the classifica-
tion using the ground truth masks and the one using
the segmentation masks. As the ground truth contains
Table 3: Results of classification of 40 polyps from SUN
dataset using ground truth polyps and segmented polyps us-
ing polypPVT
Mask
used
PCC benign (
< 6mm )
PCC malig-
nant ( ≥ 6mm )
Groundtruth
Masks
85.71% 78.26%
Predicted
Masks
85.61% 73.92%
the exact size of the polyp. This experiment allows to
assess whether relying only on the size of the polyp
allows to classify correctly the polyp into the two su-
perclasses. The images with their real size and type
of this experiment are all issued from the SUN dataset
(the 40 images in the segmentation). The results for
the two types of masks are relatively similar, which
emphasizes the robustness of the segmentation tech-
nique. Moreover, the PCC shows a relatively high
metric, which proves the robustness of the proposed
approach. In fact, this classification outperforms the
one made by the medical doctor which is estimated to
52% for beginners and 71% for expert endoscopists.
4 CONCLUSION
This work first underlined the extreme importance
of the problem we are trying to solve, which is the
classification of colorectal polyps, a subject that has
been very little addressed compared to the detection
of polyps. Despite the lack of data carrying informa-
tion on the size of polyps (both the size, the segmen-
tation of the polyp and blood vessels, and the type of
the polyp), we have been able to introduce a method
of classification of polyps based on their size. This
was done by extracting information from blood ves-
sels, a parameter that is not very variable and present
in the majority of colonoscopic videos.
Our method does not require the presence of man-
ually added reference objects as the largest blood ves-
sel can be viewed as a reference object since its size
is relatively similar in most colonoscopies. This is
useful in cases where size estimation is performed
on colonoscopy videos of recording a polyp that was
missed during the examination. The average classifi-
cation accuracy for novice endoscopists is estimated
at 52%, and 71% for experts while it was 85.61% &
73.92% using our method. Our method has been vali-
dated by two local Hepato-Gastro-Enterology special-
ists.
Other improvements of this method (larger dataset
size, with more augmentation methods) and tracking
the polyps in the video should lead to better results.
ICPRAM 2023 - 12th International Conference on Pattern Recognition Applications and Methods
820

even better results. In future projects, we would like
to improve this approach by addressing several issues.
First, expand the training dataset of our system with
a wider variety of polyp sizes. Second, to bring more
precision to our algorithm in blood vessel selection.
And finally, to combine our classification with the one
done of polyp types in order to better detect their de-
gree of malignancy and to better help physicians in
CRC screening.
ACKNOWLEDGEMENT
Authors would like to thank Dr. Y. Za
¨
ır from Bir
Mourad Ra
¨
ıs Clinic, Algiers and Dr. C. Sekkai,
from Bou
¨
ınan Clinic, Blida, both specializing in
Hepato-Gastro-Enterology, for their valuable help
especially in annotating the data. Iwahori’s re-
search is supported by Japan Society for the Promo-
tion of Science (JSPS) Grant-in-Aid Scientific Re-
search(C)(#20K11873) and Chubu University Grant.
REFERENCES
Bernal, J.,
´
Sanchez, F., Fern
´
andez-Esparrach, G., Gil, D.,
Rodr
´
ıguez de Miguel, C., and Vilari
˜
no, F. (2015).
Wm-dova maps for accurate polyp highlighting in
colonoscopy: Validation vs. saliency maps from
physicians. Computerized Medical Imaging and
Graphics, 43.
Dong, B., Wang, W., Fan, D.-P., Li, J., Fu, H., and Shao, L.
(2021). Polyp-pvt: Polyp segmentation with pyramid
vision transformers.
Hyun, Y. S., Han, D. S., Bae, J. H., Park, H. S., and Eun,
C. S. (2011). Graduated injection needles and snares
for polypectomy are useful for measuring colorectal
polyp size. Digestive and Liver Disease, 43(5):391–
394.
Itoh, H., Misawa, M., Mori, Y., Kudo, S., Oda, M., and
Mori, K. (2020). Website: Sun colonoscopy video
database (http://amed8k.sundatabase.org/).
Itoh, H., Oda, M., Jiang, K., Mori, Y., Misawa, M.,
Kudo, s.-e., Imai, K., Ito, S., Hotta, K., and Mori,
K. (2021). Binary polyp-size classification based on
deep-learned spatial information. International Jour-
nal of Computer Assisted Radiology and Surgery, 16.
Itoh, H., Roth, H. R., Lu, L., Oda, M., Misawa, M., Mori,
Y., Kudo, S.-e., and Mori, K. (2018). Towards auto-
mated colonoscopy diagnosis: Binary polyp size esti-
mation via unsupervised depth learning. In Frangi,
A. F., Schnabel, J. A., Davatzikos, C., Alberola-
L
´
opez, C., and Fichtinger, G., editors, Medical Im-
age Computing and Computer Assisted Intervention –
MICCAI 2018, pages 611–619, Cham. Springer Inter-
national Publishing.
Iwahori, Y., Emoto, S., Funahashi, K., Bhuyan, M., Wang,
A., and Kasugai, K. (2022). Recovering shape and
size from a single endoscope image using optimiza-
tion. IIAI-AAI 2022, pages 331–334.
Misawa, M., Kudo, s.-e., Mori, Y., Hotta, K., Ohtsuka, K.,
Matsuda, T., Saito, S., Kudo, T., Baba, T., Ishida, F.,
Itoh, H., Oda, M., and Mori, K. (2020). Development
of a computer-aided detection system for colonoscopy
and a publicly accessible large colonoscopy video
database (with video). Gastrointestinal Endoscopy,
93.
Nguyen, Q. and Lee, S.-W. (2018). Colorectal seg-
mentation using multiple encoder-decoder network in
colonoscopy images. pages 208–211.
Otsu, N. (1979). A threshold selection method from gray-
level histograms. IEEE Transactions on Systems,
Man, and Cybernetics, 9(1):62–66.
Pogorelov, K., Randel, K. R., Griwodz, C., Eskeland, S. L.,
de Lange, T., Johansen, D., Spampinato, C., Dang-
Nguyen, D.-T., Lux, M., Schmidt, P. T., Riegler, M.,
and Halvorsen, P. (2017). Kvasir: A multi-class im-
age dataset for computer aided gastrointestinal disease
detection. In Proceedings of the 8th ACM on Multime-
dia Systems Conference, MMSys’17, pages 164–169,
New York, NY, USA. ACM.
Ronneberger, O., Fischer, P., and Brox, T. (2015). U-net:
Convolutional networks for biomedical image seg-
mentation. volume 9351, pages 234–241.
Suykens, J., Eelbode, T., Daenen, J., Suetens, P., Maes,
F., and Bisschops, R. (2020). Sa2012 automated
polyp size estimation with deep learning reduces in-
terobserver variability. Gastrointestinal Endoscopy,
91:AB241–AB242.
Suzuki, S. and be, K. (1985). Topological structural anal-
ysis of digitized binary images by border following.
Computer Vision, Graphics, and Image Processing,
30(1):32–46.
Woodham, R. (1992). Photometric method for determin-
ing surface orientation from multiple images. Optical
Engineering, 19.
PVT based Blood Vessel Segmentation and Polyp Size Estimation in Colonoscopy Images
821
