SVM Based Maximum Power Consumption Excess Forecast Alert for
Large-Scale Power Consumers
Seigo Haruta
1 a
, Ken-ichi Tokoro
2 b
and Takashi Onoda
1 c
1
Aoyama Gakuin University School of Science and Engineering, K anagawa, Japan
2
Central Research Institute of El ectric Power Industry, Kanagawa, Japan
Keywords:
Support Vector Machine (SVM), Machine Learning, Discrimination Problem, Excess Forecast Alert,
Large-Scale Power Consumers, Maximum Power Consumption, Imbalanced Data.
Abstract:
Large-scale power consumers, such as buildings and factories, make high-voltage power contracts with the
Japanese electric power companies. The basic fee for high-voltage power contracts is based on the maximum
power consumption in the past year. If the power consumption in the present month does not exceed the
maximum power consumption in the past year, large-scale power consumers can suppress the basic fee. So,
large-scale power consumers need the alert to prevent the maximum power consumption in the present month
from exceeding the maximum power consumption in the past year. In this study, excess forecasting was per-
formed considering the characteristics of power consumption in each industry. In addition, we proposed SVM
improvements for imbalanced data. We applied this method to power consumption data, which is imbalanced
data, to perform excess forecast. As a result, we have improved the accuracy of the excess forecast and con-
tributed to effective alerts to many large-scale power consumers.
1 INTRODUCTION
Consumers with large-scale electricity demand, such
as buildings, factories, and hospitals, are called large-
scale power consumers. In Japan, electric power
compan ie s sold 837.4 billion kWh of electricity in
2021. Of this, 552 billion kWh, or 62.3%, is used
by large-scale power consumers. Therefore, large-
scale power consumers are important custo mers for
electric power comp anies. In a ddition, electric ity lib-
eralization is progressing in Japan. Electric p ower
compan ie s must continue to provide services to large-
scale power consumers who use a lot of electricity.
Large-scale power consumers make the high-voltage
power contract with the Japanese electric power com-
panies. The power contrac t for general hou seholds
has a low basic fee a nd a high power usage fee that
is calculated in proportion to the amount of power
used. The high-voltage power contract has a low
power usage fee and a high basic fee. The basic
fee accounts for a large proportion of the elec tric-
ity charges of large-scale power consumers. The ba-
sic fee for high-voltage power contracts is based on
a
https://orcid.org/0000-0002-1311-7246
b
https://orcid.org/0000-0001-5074-8250
c
https://orcid.org/0000-0002-5432-0646
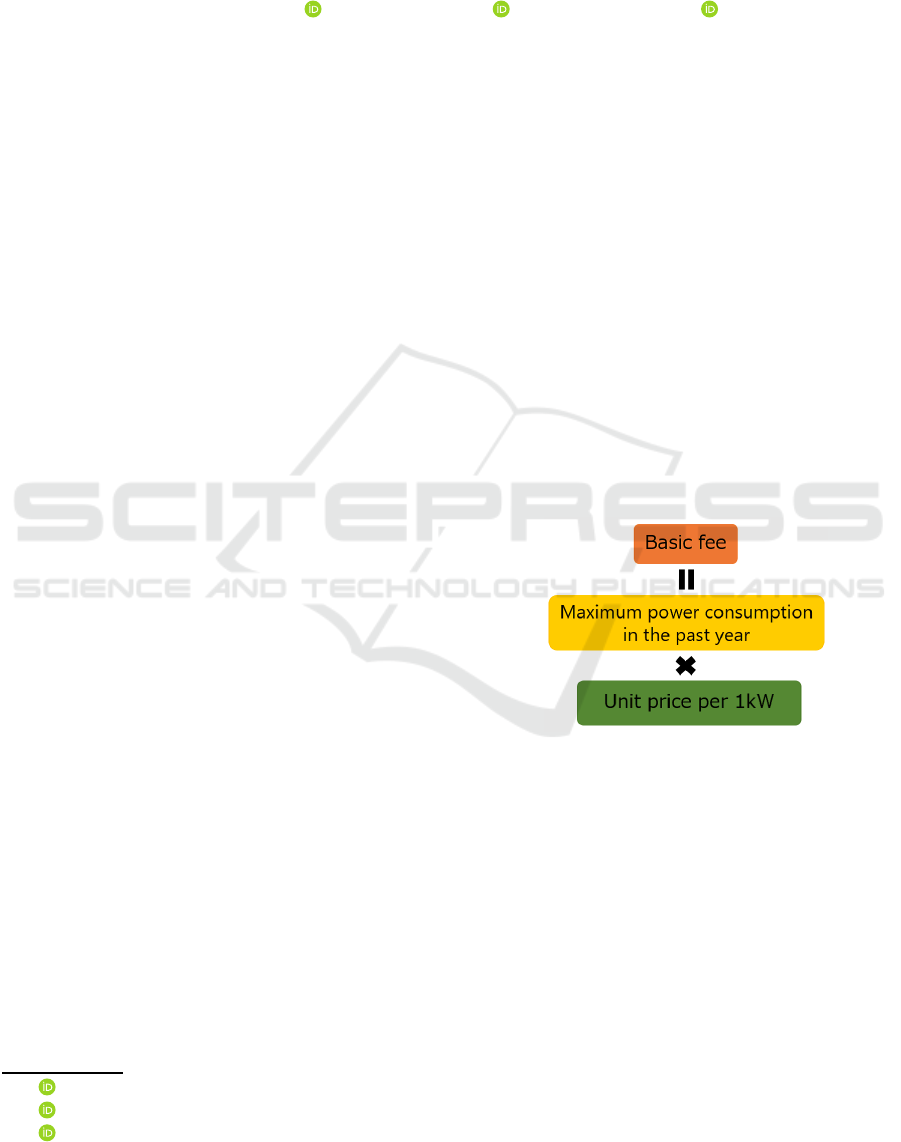
Figure 1: How the basic fee is determined for large-scale
power consumers.
the maximum power co nsumption in the past year.
Figure 1 shows how the basic fee for high voltage
power con tracts is determined. Large-scale power
consumers want to reduce th eir electricity charges. If
the power consumption in the presen t month does not
exceed the maximum power consumption in the past
year, large-scale p ower consumers can suppre ss the
basic fee(Tokoro et al., 2019). It is most important
for large-scale power consumers to prevent exceed-
ing the maximum power c onsumptio n for the past
year. Figure 2 shows the maximum power consump-
tion that determines the basic fee for August 2022.
As sh own in figure 3, if the maximum power con-
sumption is exceeded in August 2022, the maximum
power co nsumption that determines the b a sic fee in
806
Haruta, S., Tokoro, K. and Onoda, T.
SVM Based Maximum Power Consumption Excess Forecast Alert for Large-Scale Power Consumers.
DOI: 10.5220/0011666100003411
In Proceedings of the 12th International Conference on Pattern Recognition Applications and Methods (ICPRAM 2023), pages 806-813
ISBN: 978-989-758-626-2; ISSN: 2184-4313
Copyright
c
2023 by SCITEPRESS – Science and Technology Publications, Lda. Under CC license (CC BY-NC-ND 4.0)
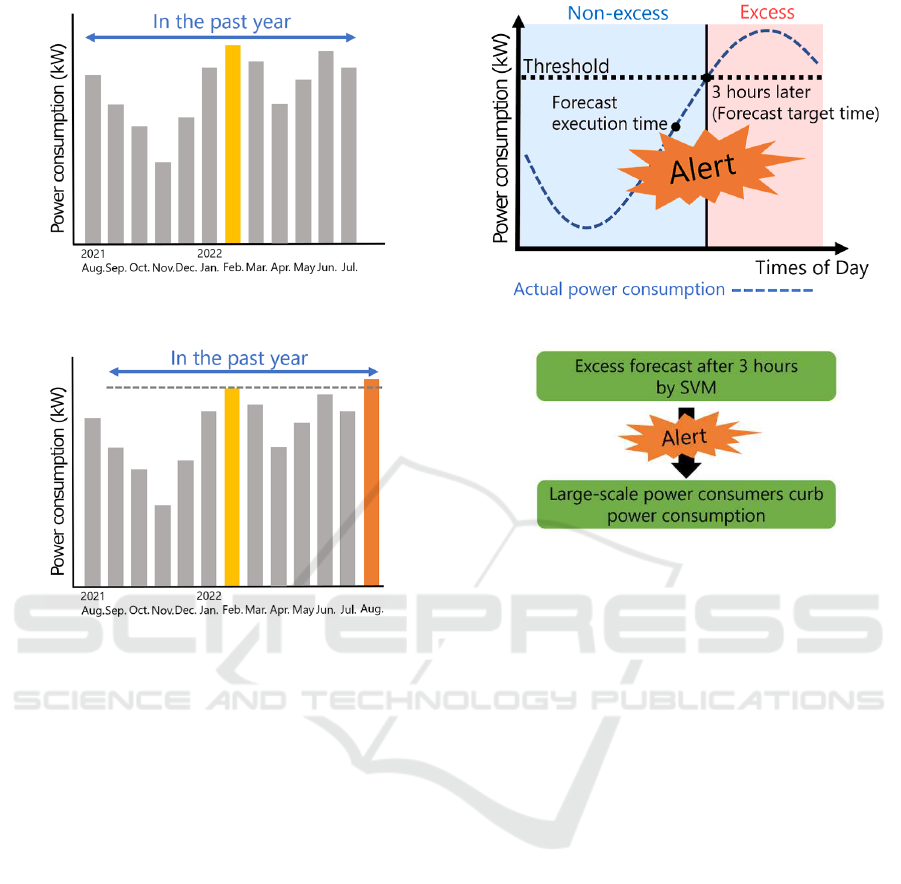
Figure 2: Maximum power consumption to determine basic
fee in August 2022.
Figure 3: Maximum power consumption to determine basic
fee in September 2022.
September 2022 changes. In order to solve such prob-
lems, power demand forecasting has been studied in
various ways from general households to large-scale
power consumers(Suganthi and Samuel, 2012)(Haghi
and Toole, 2013)(Motamedi et al., 2012).
2 RELATED RESEARCH
This chapter describes related r e search on fore-
cast alerts for exceeding maximu m power consump -
tion based on support vector machine (SVM)(Cortes
and Vapnik, 1995)(Burges et al., 1 999)(Vapnik,
1999b)(Vapnik, 1999a) to reduce basic fee for large-
scale power consumers(Tokoro et al., 2019).
2.1 Excess Forecast Alert
As one of the various forms of power demand fore-
casting being studied, an electric power company pro-
posed an excess forecast alert based on a discrimina-
tion problem as a service to be provided to large-scale
power consumers. Figur es 4 and 5 show the flow of
excess forecast alerts. At for e cast execution time t,
Figure 4: How alerts are sent.
Figure 5: Large-scale power consumers curb power con-
sumption.
SVM is used to forecast whether the power consump-
tion at forecast target time t + 3 after 3 hours will
exceed the threshold. The threshold is 90% of the
maximum power consumption in the past year. If the
threshold is forecast to be exceeded, an excess fore-
cast alert is sent. Large-scale power consume rs who
receive alerts can reduce their power consumption so
that they do not exceed th eir m aximum power con-
sumption.
2.2 Results and Issues of Related
Research
Table 1 shows the prediction accuracy (recall, pre-
cision, F-measure)(Ahmad et al., 2018)(Powers,
2020)(Goutte and G a ussier, 2005)of an excess fore-
cast alert in the power consumption data of 5,727
large-scale power consumer s in Japa n. Th e issue of
related research is that the discriminan t function for
an excess forecast alert is created under the same con-
ditions for all indu stries, even though the amount of
electricity used differs depending on th e industry of
large-scale power consum ers. Large-scale power con-
sumers are diverse as shown in figure 6. Because th e
discriminant function is created without co nsidering
the ch aracteristics of the industry, the forecast accu-
racy of an excess forecast alert may be low.
SVM Based Maximum Power Consumption Excess Forecast Alert for Large-Scale Power Consumers
807
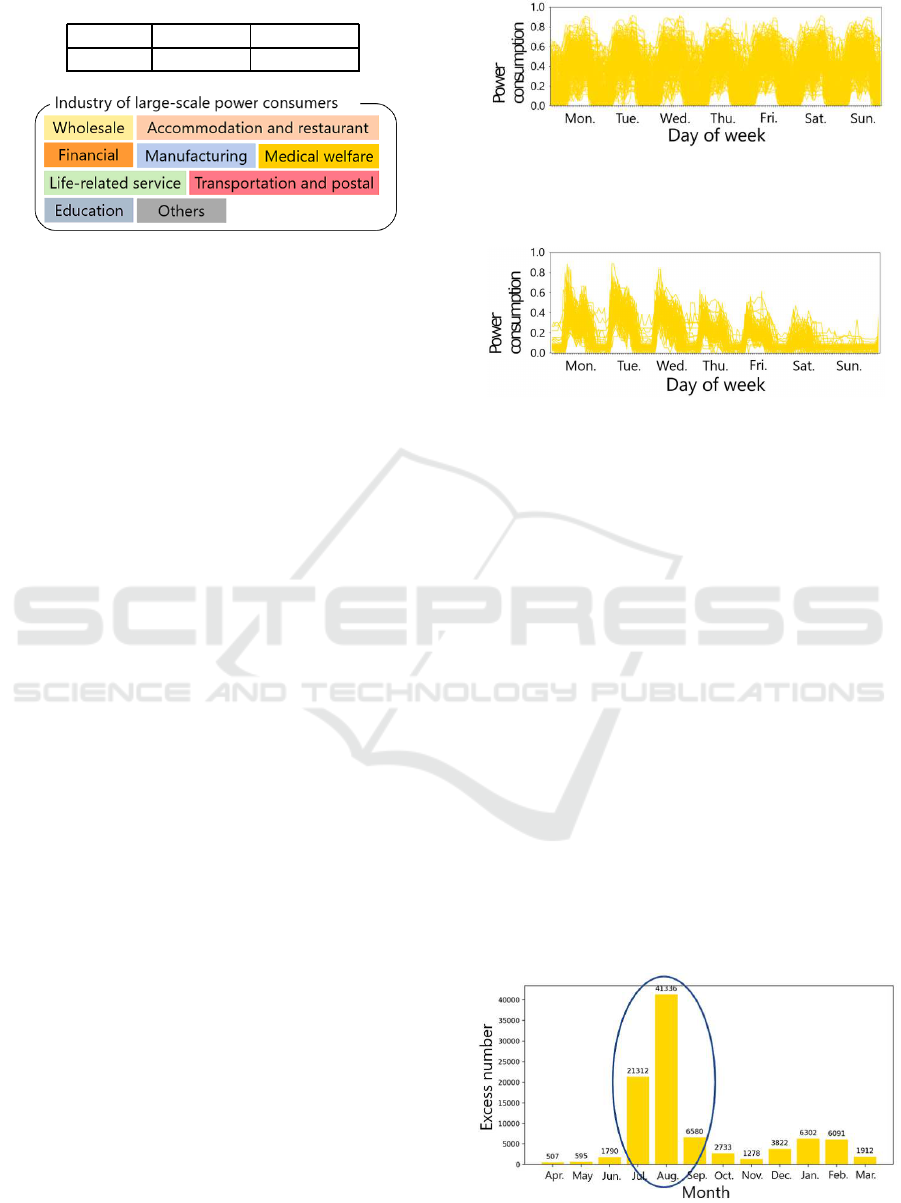
Table 1: Forecast accuracy for an excess forecast alert.
Recall Precision F-measure
62.17% 78.74% 68.28%
Figure 6: Industry of large-scale power consumers.
2.3 The Purpose of This Research
We perform excess forecasts based on the character-
istics of eac h industry to improve forecast accuracy.
We also improve the forecast accuracy by improving
the SVM.
3 PROPOSED METHOD
Power consump tion data for 5,727 large-scale power
consumers in Japan can be divided into nine indus-
tries. To improve the accuracy of excess forecast
alerts, we analyzed the characteristics of each indus-
try. We also improved the SVM for imbalanced data
to improve the accuracy of excess forecast alerts.
3.1 Characteristics of Power
Consumption in Each Industry
There is a difference in the power consumption be-
tween weekdays and holidays depending on indus-
try of the large-scale consumer. Th e figure 7 shows
a graph of c hanges in power consumptio n by whole-
salers and retailers in th e Ka nto region of Japan (Mon-
day, April 1, 2013 to Sunday, April 7, 2013). T he fig-
ure 8 shows a graph of changes in power consumption
by th e financial and insurance industries in the Kanto
region of Japan (Mon day, April 1, 2013 to Sunday,
April 7, 2013). The power consumption of whole-
salers and r etailers is constant regardless of the day of
the week.
Also, depending on the type of business of large-
scale p ower consumers, there are cases wher e there
are many excesses only in the summer, and there are
cases where th ere are many excesses in both summer
and winter. Figure 9 shows a case of high excesses
only in the summer. Figure 9 shows the number of
monthly excesses for all wholesaler and retailer cus-
tomers in the Kanto region of Japan. Figure 1 0 shows
a case of high excesses in both summer and winter.
Figure 7: Changes in power consumption by wholesalers
and retailers in the Kanto region of Japan (Monday, April 1,
2013 to Sunday, April 7, 2013).
Figure 8: Changes in power consumption by the financial
and insurance industries in the Kanto region of Japan (Mon-
day, April 1, 2013 to Sunday, April 7, 2013).
Figure 10 shows the number of m onthly excesses for
all financia l and insurance industry customers in the
Kanto region of Japan.
In the related research, the featur es used for the
discriminant function did not take into consideration
the industries of large-scale power consumers. In this
research, we select features that affect the excess of
the max imum power consumption for each industry
of large-scale power consumers. The method of se-
lecting features that affect exceeding the maximum
power consum ption is shown below.
1. Normalize all fe atures from minimum 0 to maxi-
mum 1
2. Find the median value of each feature when ex-
ceeding and when not exceeding
3. Select features with a media n difference of 0.2 or
more
Figure 11 is a boxplot of the feature quantity
”Power consumption of forecast execution time” at
Figure 9: The number of monthly excesses for all whole-
saler and retailer customers in the Kanto region of Japan.
ICPRAM 2023 - 12th International Conference on Pattern Recognition Applications and Methods
808
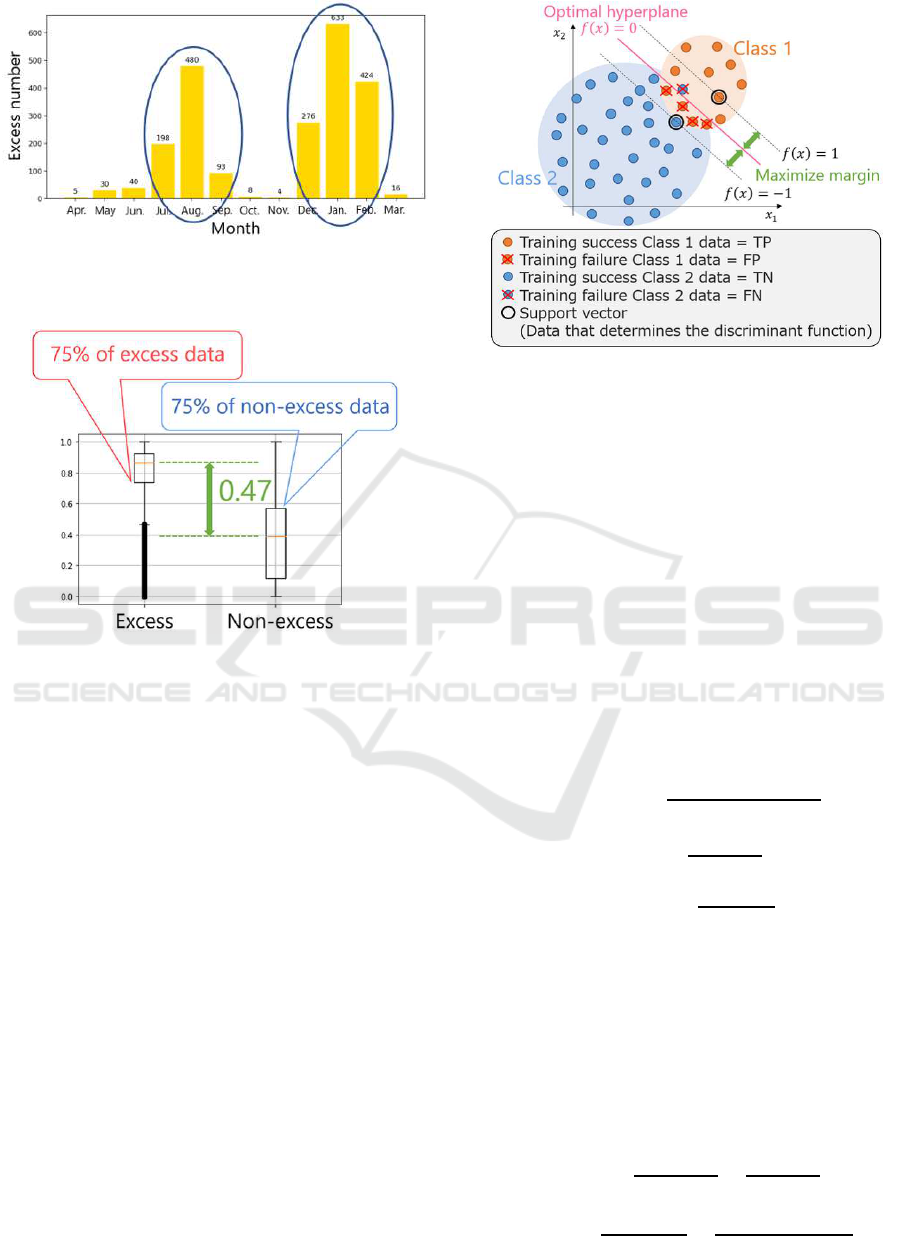
Figure 10: The number of monthly excesses for all finan-
cial and insurance industry customers in the Kanto region
of Japan.
Figure 11: The difference between the median values of the
feature for excess and non-exceeding.
the time of excess and non-exceeding in the Kanto
region wholesale and retail industry. As shown in fig -
ure 11, when the difference between the median val-
ues of th e feature for excess and non-exceeding is 0.2
or more, 7 5% of the excess data and 75% of the non-
exceeding data have different values.
3.2 SVM Improvements for Imbalanced
Data
In related research, the ratio o f when consumers
power consumption exceeds the maximum power
consumption of the past year and whe n it does not is
imbalanced. In a discrimination problem using such
imbalanced data, th ere are c a ses where the model is
tilted by the majority class and the minority class is
neglected. Therefore, an excess forecast a ccuracy of
related research was low. Other related research uses
methods such as oversampling and undersampling as
solutions to the pro blem(Mohammed et al., 2020)(He
and Garcia, 2009)(Sun et al., 2009)(Krawczyk, 2016).
In this research, we propose a method to solve the
discrimination problem of imbalanced da ta by mov-
Figure 12: Discrimination problem of imbalanced data.
ing the op timal hyperplane of SVM by the ratio of the
number of training failures in each class. SVM cal-
culates discriminan t function f (x) from training data.
Let f (x) = 0 be the optimal hyperplane for discrim-
ination. However, in the discrimination problem of
imbalanced data as shown in figure 12, there are cases
where learning is not suc cessful. We will improve the
recall by moving the optimal hy perplane as shown
in figure 13. Let the optimal hyperplane after being
moved be the modified optimal hyperplane g(x) = 0.
Equation (1) shows the modified optimal hyperplane
g(x) = 0 using FP, FN and f (x) = 0 in the figure12.
By moving the optimal hyperplane, misidentification
of class 2 incr eases, but misidentification of class 1
decreases. Equation (2) shows the recall calculation.
Equation (3) shows the precision calculation.
g(x) = f (x) −
−1 × FP + 1 × FN
FP + FN
(1)
Recall =
T P
T P + FP
(2)
Precision =
T P
T P + FN
(3)
As shown in figure 13, movin g the optimal hyper-
plane decreases FP and increases TP. Instead, FN also
increases. Equation (4) shows the calculation of the
recall
′
after the improvement in figure 13, and equa-
tion ( 5) shows the calculation of the precision
′
after
the imp rovement in figure 13. Equation (4) shows that
the recall
′
increases. Equation (5) shows that TP in -
creases even if FN increases. Therefore, the precision
′
does not drop sign ifica ntly.
Recall
′
=
T P
′
T P
′
+ FP
′
=
T P + 4
T P + FP
(4)
Precision
′
=
T P
′
T P
′
+ FN
′
=
T P + 4
T P + 4 + FN + 1
(5)
SVM Based Maximum Power Consumption Excess Forecast Alert for Large-Scale Power Consumers
809
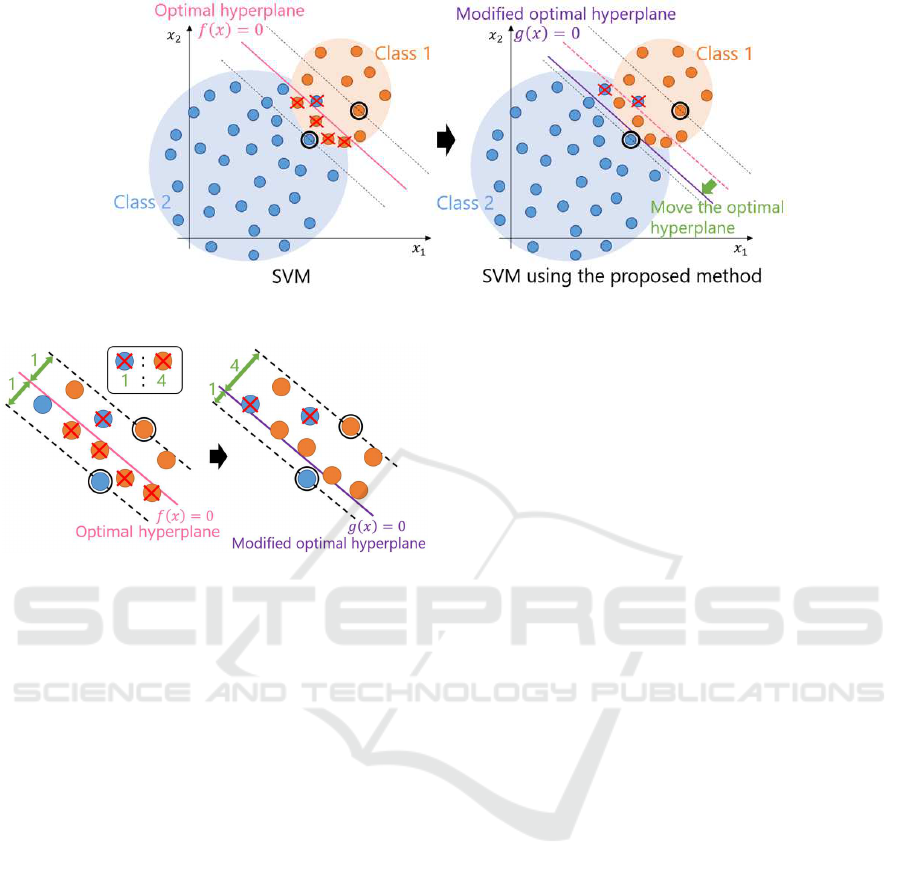
Figure 13: Move the optimal hyperplane.
Figure 14: How to move the optimal hyperplane.
Figure 14 shows how to move the optimal hyperplane.
Move the optimal hyperplane according to the propor-
tion o f the number of training failures within the mar-
gin. In the example in figure 14, class 1 has 4 learning
failure data and class 2 has 1 learning failur e data. In
that case, move the optim al hyperplane so that the ra-
tio within the margin is 4:1. However, this proposed
method assumes a ha rd-margin.
4 EXPERIMENTAL CONDITIONS
4.1 Data
The forecast accuracy was verified using the power
consumption data of 5,72 7 large-scale power con-
sumers nationwide published by the Japanese Sus-
tainable open I nnovation Initiative (SII) and the data
of th e Japan Meteorological Agency published on the
website of the Japan Meteorological Agency. As
shown in figure 10 , for an industry that has many
excesses in both summer and winter, it is assumed
that the features that affect excesses will change be-
tween summer (May to October) and winter (Novem-
ber to April). Discriminant functions for such indus-
tries were created by dividing the year into summer
(May to Octob e r) and winter (November to April).
4.2 Features
Feature candidates used for excess forecast alerts are
described below. In a ddition to the feature used in
the related research, we added “average temperature
for the week up to the forecast execution time t” and
“power consumption m hours before the forecast ex-
ecution time (m = 1, 2, 3)” was ad ded. In addition,
as shown in the figure 8, we added ”holiday informa-
tion” with 1 for Saturdays, Sundays, and holidays and
0 for wee kdays, taking into consideration industries
where there is a difference in power consumption be-
tween weekdays and holidays.
1. Power con sumption at the forecast execution time
t
2. Power con sumption at the forecast execution time
t on the previous day
3. Power consumption at the forecast target tim e t +
3 on the previous day
4. Temperature at the fo recast execution time t
5. Sun shine hours from time t − 1 to prediction exe-
cution time t
6. Cooling index at the fo recast execution time t
(How many degrees above 20 degrees Celsius)
7. Heating index at the forecast execution time t
(How many degrees below 18 degrees Celsius)
8. Average power consumption for the past m days
from the day before the forecast target time t + 3
(m = 7, 14, 21, 28)
9. Average power consumption for 4 weeks from the
previous week on the same day of the week at the
forecast target time t + 3
10. Average power consumption for x hours up to the
forecast execution time t (x = 2, 4, 6)
11. Difference between the amount of power con-
sumption at the forecast execution time t and
ICPRAM 2023 - 12th International Conference on Pattern Recognition Applications and Methods
810
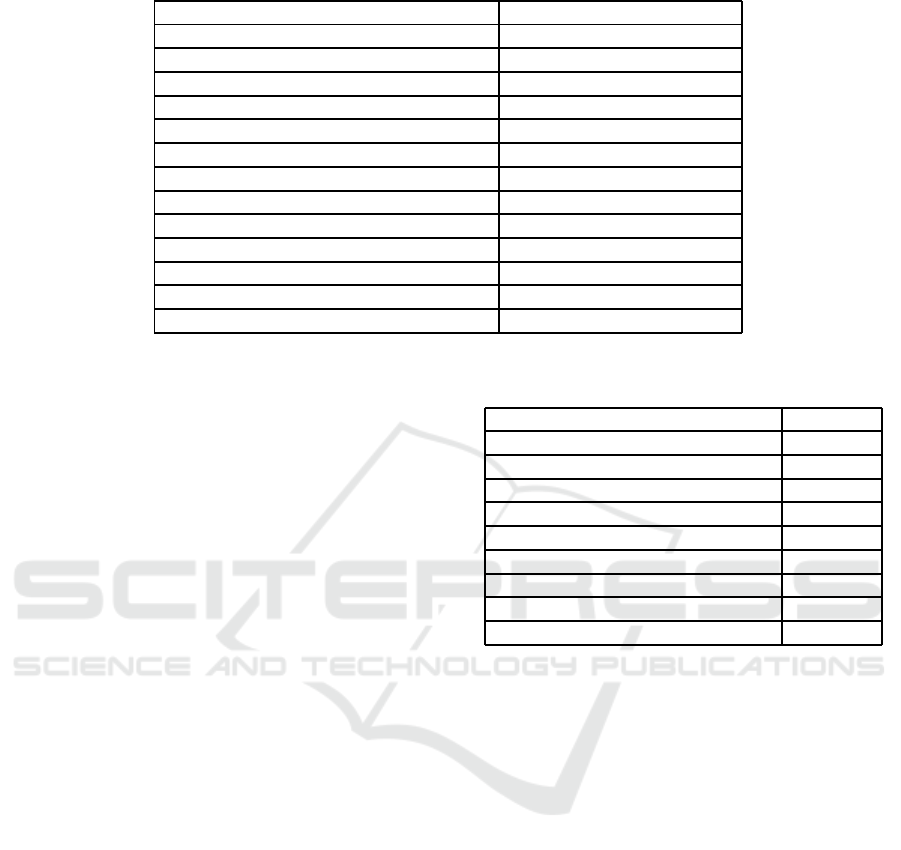
Table 2: Number of features used for each industry (Describe the number of features used fr om Section 2 of Chapter 4).
Industry Used featu res number
Wholesale industry 1,2,3,4,5,6, 7,8,9,14,15
Accommo dation and restaura nt industry 1,2,3,4, 5,6,7,8,9,14,15,16
Financial indu stry (sum mer) 1,2,3,4,5,6, 8,9,11, 14,15,16
Financial indu stry (winter) 3,4,7,8,12,14,16
Manufacturin g industry ( summer) 1,2,3,4,5,6, 8,9,11,14,15,16
Manufacturin g industry ( w inter) 1,2,3,4,5,7, 8,9,11,14,15,16
Medical welfare industry (summer) 1,2,3,4,5,6, 8,9,11,14,15,16
Medical welfare industry (winter) 1,2,3,4,5,7, 8,9,11,14,15,16
Life-related service industry 1,2,3,4,5,6, 7,8,9,14,15
Transportation and postal industry 1,2,3,4,5,6, 7,8,9,14,15,16
Education industry (summer) 1,2,3,4,5,6, 8,9,11,14,15,16
Education industry (winter) 1,2,3,4,5,7, 8,9,11,14,15,16
Other industry 1,2,3,4,5,6, 7,8,9,14,15,16
the average amount of power consumption for
the past m days from the previous day ( m =
7, 14, 21, 28)
12. Difference be tween power consum ption at fore-
cast execution time t and average power consump-
tion for 4 weeks from the previous week on the
same day of the wee k
13. Day of the week information (dummy variable for
each d a y of the wee k) and national holiday infor-
mation (dummy variable for whether it is a holi-
day)
14. Average tempera ture for the we ek up to the fore-
cast target time t
15. Power co nsumption m hours before the prediction
execution time (m = 1, 2, 3)
16. Holiday inform a tion
Based on Chapter 3, the characteristics of each in-
dustry were extracted from the above characteristics.
The fe a tures used in each industry ar e shown in table
2. For the industrie s divided into summer and winter,
the feature is shown for each.
4.3 An Excess Alert Based on SVM
Suppor t vector machine (SVM) is used to create a dis-
criminant function that forecasts whether th e power
consumption after 3 h ours will exceed the threshold
based on the input data. Soft-margin SVM, which
can handle overlapping class distributions, was used
to create discriminant fu nctions. Moreover, RBF (Ra-
dial Basis Function Kernel) was used as the SVM ker-
nel. Th e cost parameter C ranges from 100 to 1000,
and the RBF kernel parameter γ ranges from 0.01
to 100. G rid search (Syarif et al., 2016) is used to
find the most appropriate hyperp arameters. Further-
more, a discriminant f unction was created f or each
Table 3: The ratio to move the optimal hyperplane, which
is determined for each industry.
Industry Ratio
Wholesale industry 1.00:2 .23
Accommo dation and restaurant 1.00:3 .00
Financial industry 1.00:4 .56
Manufacturin g industry 1.00:3 .47
Medical welfare industry 1.00:2 .77
Life-related service industry 1.00:3 .17
Transportation and postal industry 1.00:3.08
Education industry 1.00:3 .88
Other industry 1.00:3 .88
consumer for each hour. However, in our experiments
with the proposed improved SVM method for imbal-
anced data, we used a hard-margin SVM. This is be-
cause the improvement proposal m ethod assume s a
hard-margin. In addition, we determined how best to
move the hyperplane for each industry when using the
improved SVM for imbalanced data. Table 3 shows
the ratio for eac h industry.
5 EXPERIMENTAL RESULTS
Section 1 of Chap te r 5 presents the resu lts of the pro-
posed method in Section 1 of Chapter 3 . Section 2 of
Chapter 5 presents the resu lts of the proposed method
in Section 2 of Chapter 3.
5.1 Excess Forecast Alert Considering
Industry Characteristics
Table 4 shows the accuracy results of the excess fore-
cast alerts in this research, in which discriminant
functions were created based o n the characteristics
SVM Based Maximum Power Consumption Excess Forecast Alert for Large-Scale Power Consumers
811
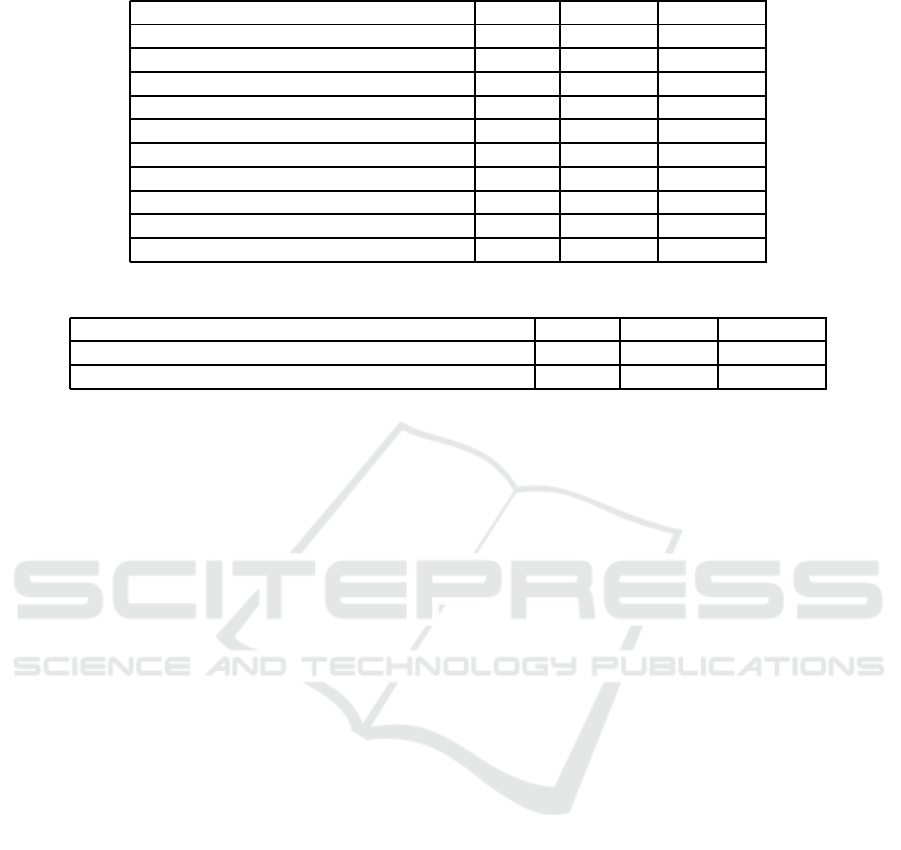
Table 4: An excess alert results by industry using the proposed method (S ection 1 of Chapter 3).
Industry Recall Precision F-measure
Wholesale industry 73.44% 83.86% 77.87%
Accommo dation and restaura nt industry 66.04% 80.95% 72.29%
Financial indu stry 57.78% 76.61% 65.27%
Manufacturin g industry 59.61% 77.31% 66.55%
Medical welfare industry 67.98% 82.22% 74.01%
Life-related service industry 63.96% 80.19% 70.34%
Transportation and postal industry 64.65% 81.06% 71.17%
Education industry 61.77% 79.11% 68.90%
Other industry 63.49% 81.21% 70.43%
Average of all consumers 67.36% 81.33% 73.11%
Table 5: Comparison of the results of related research and this research using the proposed method (Section 1 of Chapter 3).
Recall Precision F-measure
Related research 62.17% 78.74% 68.28%
Proposed metho d(Section 1 of Chapter 3)(Soft-margin) 67.36% 81.33% 73.11%
of each industry of consumers. Even w hen discrim-
inant functions are used for summe r and winter re -
spectively, the for e cast acc uracy is summed for ea ch
industry. Table 5 shows a comparison of accuracy re-
sults for excess forecast alerts in related research and
excess fore cast alert accuracy results in this study,
in which a discrim inant function was created based
on the cha racteristics of each industry of consume rs.
We were able to improve the F-measure by about 4.8
points.
Since the amount of power consumption by each
consumer industry has its own cha racteristics, we
changed the conditions for creating the d iscr iminant
function for each consum er industry to improve the
accuracy of the excess foreca st alert. As a result of
creating a discriminant function according to the char-
acteristics of each consumer industry, we were able
to improve the foreca st accuracy (re call, precision, F-
measure) of the average excess forecast alert f or all
consumers. As a result, w e c an send effective alerts to
consumers in various industries. However, the recall
is 67.36%, which is low compared to the precision of
81.33%. Lower recall means more oversights. We
want to aim for an excess forecast a lert w ith a high
F-measure and recall.
5.2 Excess Forecast Alerts Based on
Improved SVM for Imbalance Data
Table 6 shows the accuracy results of the excess fore-
cast alert in this study, which created the d iscriminant
function based on the improved SVM for the imbal-
anced data . Table 7 compares the average results for
all con sumers in Table 6 and the accuracy r e sults for
the excess forecast alerts in this study, in which dis-
criminant functions were created based on the charac-
teristics of each industry of consumers using the pro-
posed method(Section 1 of Chapter 3). We were able
to improve the recall by about 6.8 points and the F-
measure by about 1.3 points.
The excess f orecast alert result based on improved
SVM for imbalanced data could obtain high recall
while improving F-measure. A high rec a ll means a
reduction in the number of missed oversights.
6 CONCLUSION
In this research, since the amount of electricity used
is characteristic for each indu stry of consumers, we
changed the conditions for creating the d iscr iminant
function for each industry of c onsumers to improve
the accuracy of excess forecast alerts. As a result of
creating a discr iminant f unction based on the char a c-
teristics of each consumer’s industry, it was possible
to improve the recall, precision, and F-measure of the
average excess forecast alert for all consumers. In ad-
dition, excess forecast alerts using the improved SVM
for imbalanced data were able to produce results with
high F- measures and r e call. This makes it possible
to contribute to the transmission o f effective alerts
to con sumers in a wide variety o f industries. How-
ever, in order to have a wide range of consumers use
it in the future, further improvement in a ccuracy is re-
quired. The accuracy of excess forecast alerts will be
improved in our future researc h.
ICPRAM 2023 - 12th International Conference on Pattern Recognition Applications and Methods
812
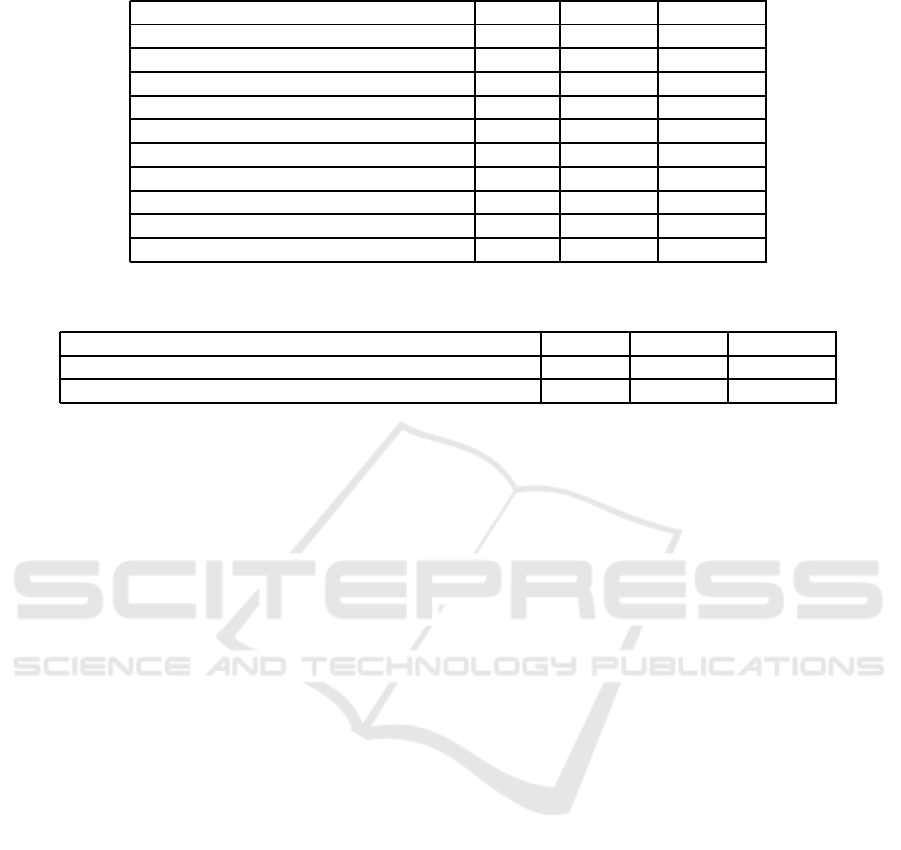
Table 6: An excess alert results by industry using the proposed method(Section 2 of Chapter 3).
Industry Recall Precision F-measure
Wholesale industry 75.64% 74.55% 74.94%
Accommo dation and restaura nt industry 72.11% 66.87% 69.28%
Financial indu stry 68.50% 61.66% 64.66%
Manufacturin g industry 67.02% 64.84% 65.71%
Medical welfare industry 72.54% 70.27% 71.27%
Life-related service industry 68.33% 68.65% 68.21%
Transportation and postal industry 68.06% 69.46% 68.49%
Education industry 72.34% 62.24% 66.79%
Other industry 71.44% 66.26% 68.61%
Average of all consumers 72.33% 69.55% 70.72%
Table 7: Comparison of the results of this research using the proposed method (Section 1 of Chapter 3) and this research using
the proposed method (Section 2 of Chapter 3).
Recall Precision F-measure
Proposed metho d (Section 1 of Chapter 3) (Hard-margin) 65.41% 74.75% 69.41%
Proposed metho d (Section 2 of Chapter 3) (Hard-margin) 72.33% 69.55% 70.72%
REFERENCES
Ahmad, M., Aftab, S., Bashir, M. S., Hameed, N., Ali, I.,
and Nawaz, Z. (2018). Svm optimization for sen-
timent analysis. International Journal of Advanced
Computer Science and Applications, 9(4).
Burges, C. J., Smola, A. J., and Scholkopf, B. (1999). Ad-
vances in kernel methods. Support Vector Learning,
53.
Cortes, C. and Vapnik, V. (1995). Support-vector networks.
Machine learning, 20(3):273–297.
Goutte, C. and Gaussier, E. (2005). A probabilistic interpre-
tation of precision, recall and f-score, with implication
for eval uation. In European conference on informa-
tion ret rieval, pages 345–359. Springer.
Haghi, A. and Toole, O. (2013). The use of smart meter data
to forecast electricity demand. CS229 course paper.
He, H. and Garcia, E. A. (2009). Learning from imbalanced
data. IEEE Transactions on knowledge and data engi-
neering, 21(9):1263–1284.
Krawczyk, B. (2016). Learning from imbalanced data: open
challenges and future directions. Progress in Arti ficial
Intelligence, 5(4):221–232.
Mohammed, R., Rawashdeh, J., and Abdullah, M. (2020).
Machine learning with oversampling and undersam-
pling techniques: overview study and experimental
results. In 2020 11th international conference on in-
formation and communication systems (ICICS), pages
243–248. IEEE.
Motamedi, A., Zareipour, H., and Rosehart, W. D. (2012).
Electricity price and demand forecasting in smart
grids. IEEE Transactions on Smart Grid, 3(2):664–
674.
Powers, D. M. (2020). Evaluation: from precision, recall
and f-measure to roc, informedness, markedness and
correlation. arXiv preprint arXiv:2010.16061.
Suganthi, L. and S amuel, A. A. (2012). Energy models for
demand forecasting - a review. Renew able and sus-
tainable energy reviews, 16(2):1223–1240.
Sun, Y., Wong, A. K., and Kamel, M. S. (2009). Classifica-
tion of imbalanced data: A review. I nternational jour-
nal of pattern recognition and artificial intelligence,
23(04):687–719.
Syarif, I., Prugel-Bennett, A., and Wills, G. (2016). Svm
parameter optimization using grid search and ge-
netic algorithm to improve cl assification performance.
TELKOMNIKA (Telecommunication Computing Elec-
tronics and Control), 14(4):1502–1509.
Tokoro, K., Tsurumi, T., and Hi go, T. (2019). Excessive
power consumption alert using svm (in japanese). In
The Institute of Electrical Engineers of Japan Na-
tional conference.
Vapnik, V. (1999a). The nature of st ati stical learning the-
ory. Springer science & business media.
Vapnik, V. N. (1999b). An overview of statistical learn-
ing theory. IEEE transactions on neural networks,
10(5):988–999.
SVM Based Maximum Power Consumption Excess Forecast Alert for Large-Scale Power Consumers
813
