
Performance Evaluation of IREDA Prototype System: An IR-Based
Portable Electronic Detection System for
Blood Alcohol Concentration
Panayiota Demosthenous
a
, Kleanthis Erotokritou
b
and Marios Sergides
c
Cy.R.I.C. Cyprus Research & Innovation Center Ltd, 28
th
October Avenue, 2414, Nicosia, Cyprus
Keywords: Ethanol Detection, Blood Alcohol Concentration (BAC), Breath Alcohol Concentration (BrAC), Transdermal
Alcohol Concentration (TrAC), Tissue Alcohol Concentration (TAC), Near Infrared (NIR), Diffused
Reflectance, Tissue Phantoms, Integrating Sphere, Touch-Based Detection, Gas-Based Detection.
Abstract: This paper demonstrates a prototype system called IREDA, which is an IR-based Portable Electronic
Detection System for Blood Alcohol Concentration. IREDA examines, a) the feasibility on detecting Ethanol
on human body via near-infrared diffused reflectance with a touch-based oriented detection, and b) the
feasibility on detecting Ethanol in human respiration via multiple light absorptions with gas-based detection.
IREDA has proved the feasibility on detecting ethanol vapour with limit of detection of about 12 mg/L, and
the feasibility on detecting Ethanol in solid gelatine samples. Even though, it is challenging to compare these
results with data alcohol consumption in humans, IREDA can be considered as a promising prototype towards
this direction.
1 INTRODUCTION
Driving under the influence (DUI) of alcohol is
responsible for the 25% of all road fatalities in the
European Union. According to the European
Commission Communication, efficient ways to
control alcohol intake and advice users on their ability
to drive are critical to prevent accidents. The need to
indirectly monitor blood alcohol levels for safety,
medical, legal or health reasons, as well as, for safe
recreational alcohol consumption, leaded to several
non-invasive solutions that use biofluid samples such
as lacrimal fluid, saliva, sweat. Alternative methods
consist of measuring breath alcohol concentration
(BrAC) or tissue alcohol concentration (TAC).
Breathalyzers are widely used for indirectly
determining BAC (Jurič, Fijačko, Bakulić, Orešić, &
Gmajnički, 2018), but their resulting measurements
usually suffer from inaccuracies due to interference
from external and internal factors such as humidity,
temperature, individuals’ traits, subject physiological
variations, contamination of mouth compounds and
a
https://orcid.org/0000-0001-5088-9029
b
https://orcid.org/0000-0002-7284-104X
c
https://orcid.org/0000-0002-4344-4416
environmental vapours. Two other methods, namely
an eyeglasses-based tear biosensing device
(Sempionatto, et al., 2019) and a saliva
electrochemical ring sensor (Mishra, et al., 2020), use
biofluid samples. However, the former involves tear
stimulation, and the latter is missing pH and
temperature sensors to compensate for temperature
changes or variations in saliva pH. Moreover, there
are several other transdermal alcohol sensing
methods (Fairbairn & Kang, 2019) that detect either
liquid or gas phases of alcohol just above the skin.
However, detection in sweat can only be achieved if
sweat is produced after a stimulation process, which
in general introduces limitations. Furthermore,
individual and environmental factors (e.g., skin
thickness, gender differences, humidity, temperature)
are introducing variations in transdermal alcohol
readings, which also present late response with a time
lag of a couple of hours. Finally, non-invasive optical
methods exist for blood alcohol concentration
measurements on tissue sample, among which,
infrared spectroscopy (IR) was found to be the most
Demosthenous, P., Erotokritou, K. and Sergides, M.
Performance Evaluation of IREDA Prototype System: An IR-Based Portable Electronic Detection System for Blood Alcohol Concentration.
DOI: 10.5220/0011666000003408
In Proceedings of the 11th International Conference on Photonics, Optics and Laser Technology (PHOTOPTICS 2023), pages 59-66
ISBN: 978-989-758-632-3; ISSN: 2184-4364
Copyright
c
2023 by SCITEPRESS – Science and Technology Publications, Lda. Under CC license (CC BY-NC-ND 4.0)
59
promising, employing either near-infrared (Ver Steeg,
et al., 2017) or mid-infrared spectrum (Guo, et al.,
2018). Specifically, wavelength-modulated differential
photothermal radiometry (WM-DPTR), has the
capability of measuring BAC with high resolution at
around 5 mg/dl and a low detection limit at around 10
mg/dl. However, this methodology is currently using
laboratory equipment, presenting limitations on further
miniaturization for personal use.
This work demonstrates a prototype system called
IREDA, which is an IR-based Portable Electronic
Detection System for Blood Alcohol Concentration.
IREDA examines the feasibility of detecting blood
alcohol (ethanol) in a) human body via near-infrared
(NIR) diffused reflectance with a touch-based
oriented detection (P. Demosthenous, Near Infrared
Diffused Reflectance on Tissue Simulating Phantoms
for Optical Applications., 2022), and b) in human
respiration via multiple light reflection and
absorption with gas-based detection (P.
Demosthenous, Infrared Spectroscopic Application
using an Integrating Sphere for Measuring Vapor
Ethanol, 2022).
The main optical component of the system is an
integrating sphere for the efficient collection of the
diffused light from the sample. Integration spheres
are known to be beneficial in spectroscopic
applications (LM. Hanssen, 2022) and are used to
enhance the collection of backscattered light in non-
invasive sensing applications such as, finger photo
plethysmography for determining blood
concentration (T. Yamakoshi, 2015), and laser
spectroscopy for glucose sensing (A. Werth, 2018).
Likewise, integrating spheres are used in gas sensing
applications, as they easily increase the effective
optical path length from the light source to the
detector. Hence, the interaction length between light
and the gas sample becomes longer (S. Tranchart,
1996), increasing the sensitivity of the gas-based
detection system. To examine NIR diffused
reflectance on simulating tissues, the experiments use
low-cost optical tissue phantoms (L. Ntombela, 2020)
composed of water, gelatine, and titanium dioxide
(TiO
2
) powder. Such samples are commonly used in
optical applications to mimic human tissue.
The following sections present the system
implementation, as well as the experimental testing
and results for the performance evaluation of IREDA.
2 SYSTEM IMPLEMENTATION
This section describes: a) the hardware architecture of
the system, b) the optical setup and optoelectronics
that has been used, c) the system’s software with the
signal processing algorithm, and d) the overall system
integration.
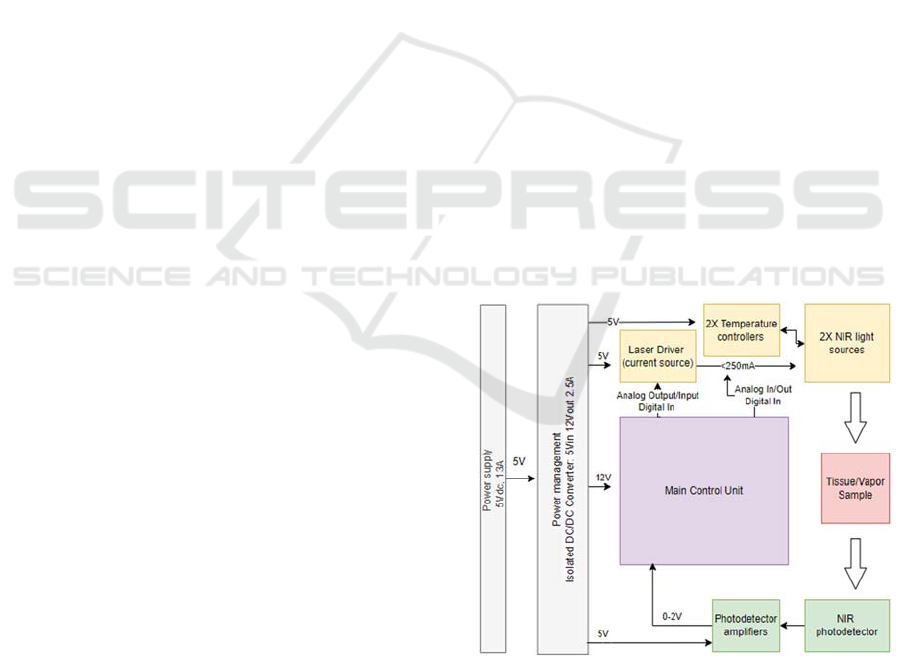
2.1 System’s Hardware Architecture
There are several individual modules that are
included in the hardware development of IREDA.
These are a) the current driver, b) the temperature
controller of the light sources, c) the transimpedance
amplifier of the photodetector, and d) the main
control unit (MCU) of the system. Figure
1
shows the
architecture of the hardware electronic subsystem.
This design presents all the connections between the
specified peripherals and clarifies the communication
protocols and the digital and analogue signals
between them, as well as the power supply
requirements.
A laser diode driver has been chosen to drive the
NIR light sources at a constant current mode. This
module can drive two independent outputs up to
250mA, controlled by two separate modulation
signals. A temperature controller is used to set and
control the temperature of the light sources, ensuring
wavelength stability during optical measurements. A
transimpedance amplifier was chosen, for the
amplification of the photodetector signal. This
amplifier converts photodiode’s output current to
voltage with a switchable gain from 1, 10 and 100
MV/A. A controller from National Instruments has
been used as the MCU.
Figure 1: IREDA hardware architecture.
The MCU is responsible to control all the above
peripherals, the laser driver, the TECs and the
photodetector. Specifically, the MCU is used to set
the optical intensity and wavelength of the NIR light
sources, read the photodetector signal, and provide
PHOTOPTICS 2023 - 11th International Conference on Photonics, Optics and Laser Technology
60
the collected data to the ‘data analysis software’. The
optical intensity can be controlled via the laser driver
that applies a constant or pulsed current through the
lasers’ anode and cathode. The laser wavelength can
be controlled by changing the lasers’ temperature
using the temperature controller. While the light
sources illuminate the sample, the photodetector
collects the reflected radiation that gives information
on ethanol presence within the sample. The
photodetector signal is then digitized by an analogue-
to-digital converter (ADC) on the MCU. The raw data
are then provided to a custom-made LabVIEW data
analysis software for further processing.
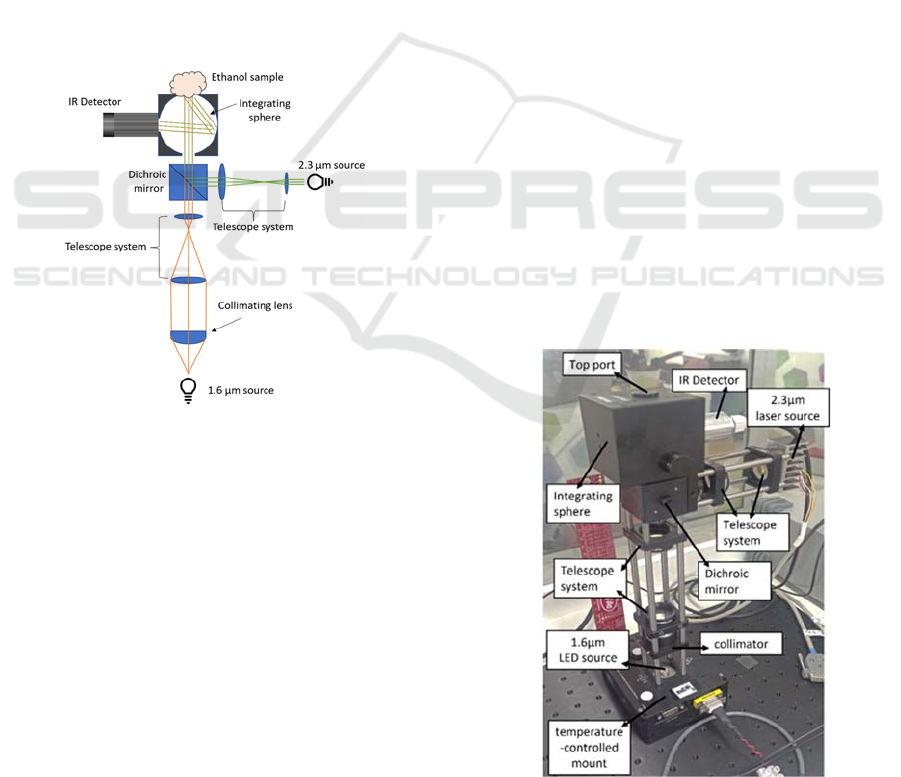
2.2 Optics and Optoelectronics
The optical setup described in this section is designed
to accommodate two separate infrared light sources,
which can be detected by a single photodetector. The
schematic of the optical module used in IREDA, is
show in Fig. 2.
Figure 2: Schematic of IREDA optical apparatus.
This optical setup consists of two NIR sources at
1.6 μm and 2.3 μm. The former is a light emitting
diode (LED) and it is connected to a temperature-
controlled mount. The 2.3 μm source is a distributed
feedback laser diode. Directly after the 1.6 μm LED
source, a collimator lens is used. Subsequently, the
collimated beam passes through an inversed telescope
system (-20x) formed by two additional lenses to
reduce the beam diameter down to slightly less than 8
mm which is the port opening of the integrating
sphere. In the path of the 2.3 μm source merely a
telescope system is advised, consisting of 15 mm and
35 mm focal length lenses to increase the beam
diameter. The two beams then arrive at a short pass
dichroic mirror with cut-off wavelength at 1800 nm
allowing for wavelengths shorter than 1800 nm to be
transmitted and longer wavelengths to be reflected.
The combined beams then enter the integrating sphere
and illuminate the sample mounted at the opposite
port, the ‘sample port’. The integrated sphere is
chosen here to collect the light that is diffusely
reflected by the sample at all angles, thus maximizing
the detector’s signal and increasing signal stability.
As mentioned previously, the beam diameter from
both light sources is reduced to be slightly smaller
than the port diameter of the integrating sphere. This
is done to allow the light to interact with a maximum
area of the sample without being directly reflected by
the inner walls of the sphere. An NIR detector is
connected to the side port to measure light intensity
as reflected by the sample. The fine adjustment of the
two lens systems was achieved by leaving the top port
open but in the absence of sample. Since both beams
are collimated and with diameters slightly less than
port size, the detected signal was almost null. The
maximum device signal was detected when the top
port was sealed with a reflective-coated plug.
A real image of the optical module is shown in
Fig. 3. This optical setup, as described above, was
designed as a touch-based detection system for
ethanol detection in ‘tissue’ samples. At the same
time, this setup can be used as a gas-based detection
system for vapor ethanol detection, where multiple
light reflections within the integrating sphere offer
multiple absorption paths into the gas that fills the
sphere. The difference in this case is that the top port
of the sphere is kept closed with its reflective-coated
plug, while the side port of the sphere now serves as
the gas/vapor inlet port.
Figure 3: The optical setup of IREDA.
Performance Evaluation of IREDA Prototype System: An IR-Based Portable Electronic Detection System for Blood Alcohol Concentration
61
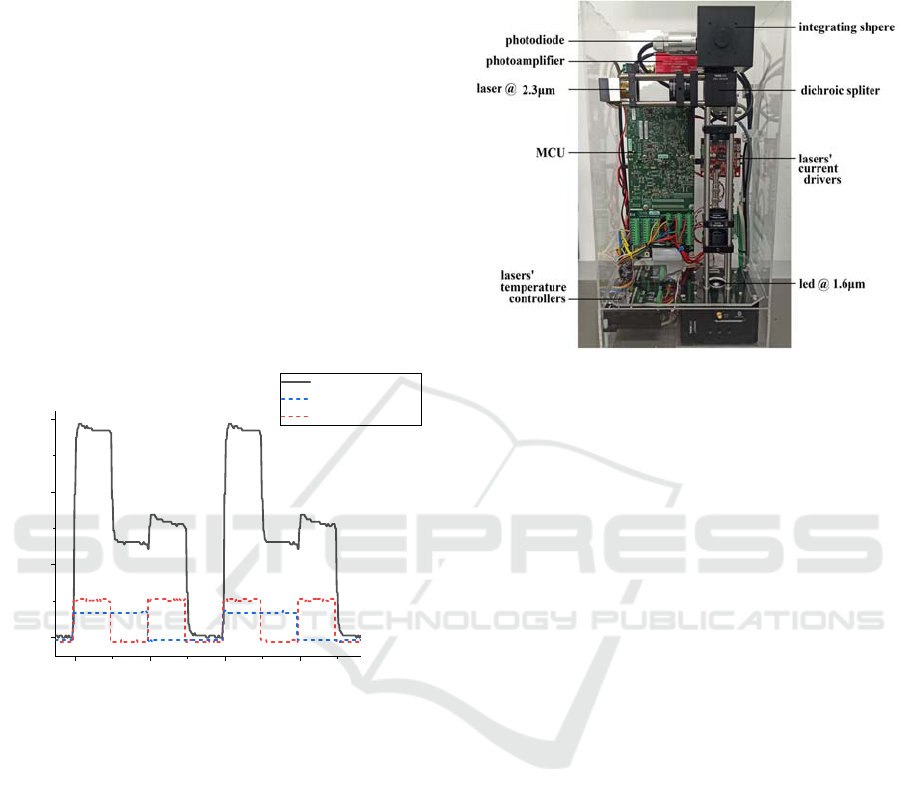
2.3 System Software-Signal Processing
During an optical measurement, both light sources are
operated simultaneously and are modulated by a
square waveform. To differentiate the signal
originated by the two different light sources, one is
modulated at 100 Hz and the other at double this
value. The synchronous detection of the
photodetector (PD) signal is done digitally by
sampling the measured and modulation signals and
processing them via the IREDA data analysis
software.
Figure 4
shows an example of the two
modulated signals and the total PD signal which is a
summation of the two. Furthermore, a digitally lock-
in signal processing algorithm is implemented (M.
Baer, 2021). Via this algorithm we managed
simultaneous signal acquisition from two light
sources, by synchronous detection of their
modulation signals of orthogonal frequencies.
Figure 4: Example of the modulation and photodiode
signals as measured via the oscilloscope signal.
The IREDA software is used to visualize the
analyzed data in real time. The temperature control,
current control and modulation of the light sources
(LS) can be also accessed and modified by the
software. The modulation of the two LSs can be
visualized and verified by the real-time PD signal.
Additionally, the signal corresponding to each
individual LS as well as their ratio is displayed. When
light is lost due to absorption or for example due an
integrating sphere open port, there is a decrease
observed in the individual LS signals.
2.4 System Assembly
The optical setup, the electronic hardware, and the
data analysis software were integrated together within
an acrylic enclosure to construct IREDA system.
Figure 5 presents the final integrated prototype
system, indicating the main modules and optical
components.
Figure 5: The integrated IREDA prototype.
3 EXPERIMENTAL TESTING
AND RESULTS
This section describes the experimental validation of
IREDA’s performance, both as a) a touch-based and
b) gas-based ethanol-detection system. Both cases
used the same configuration parameters. The applied
voltage to the 1.6 μm LED ( LS1 ) source was set at
1 V, and 1.5 V for the 2.3 μm laser source ( LS2 ),
while the two sources were modulated at 0.1 kHz and
0.2 kHz respectively. The amplifier connected to
photodiode detector was set to an amplification value
of 10 MV/A.
3.1 Validation of the Gas-Based
Detection System
3.1.1 Experimental Configuration Using
Latex Balloon as the Vapour Provider
A latex balloon was used to provide the integrating
sphere with a constant volume of ethanol vapour. A
specific amount of liquid solution was added to the
balloon prior inflation. The balloon was inflated to a
diameter of approximately 20±1 cm and sealed
allowing the solution to evaporate for several
seconds. Subsequently, it was connected to the
“sample port” via a tube (Fig. 8) and the air-vapour
mixture was released into the sphere. Due to the
constant volume of air used in this method, an actual
2345
0.0
0.5
1.0
1.5
Oscilloscope Signal (a.u.)
Time
(
s
)
Photodiode Signal
1.6 μm modulation
2.3 μm modulation
PHOTOPTICS 2023 - 11th International Conference on Photonics, Optics and Laser Technology
62
sample concentration can be calculated by
approximating the balloon volume to that of a sphere.
Data collection initiated prior connecting the
balloon to the sample port to ensure zero absorption
i.e., maximum PD signal. The balloon was then
allowed to deflate resulting to PD signal drop due to
absorption. Afterwards, the balloon was
disconnected and allowed the system to “empty”.
After observing maximum PD signal denoting
“empty” sphere, an additional balloon with different
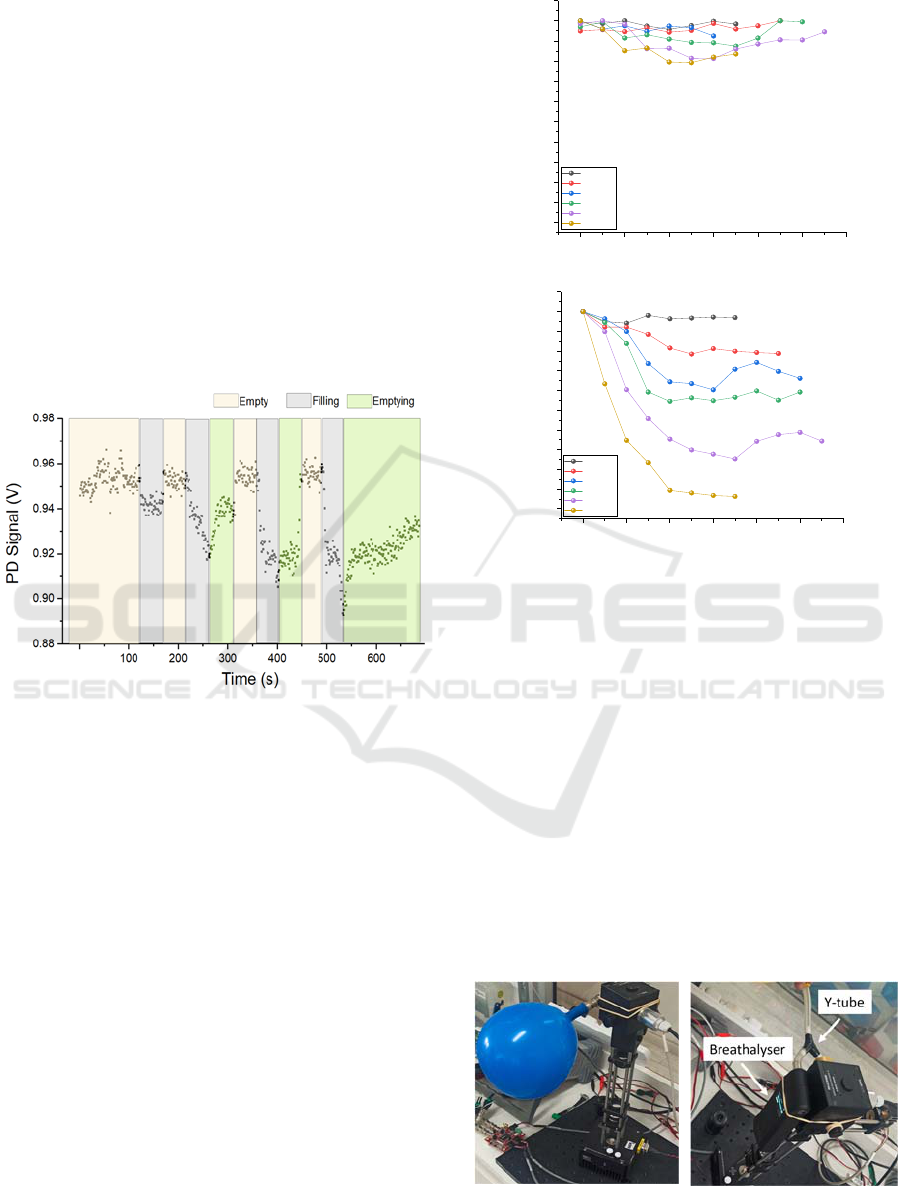
ethanol concentration was connected. Figure 6
shows an example of a raw data sequence recorded
in this set of experiments. Different regions
represent time periods where the sphere contained
no ethanol vapour (empty), was filled with vapour
(filling) and finally exhausting the vapour again
(emptying).
Figure 6: Example of photodiode signal. The different
coloured time regions represent the process of ethanol
vapour entering and exiting the integrating sphere.
Different concentrations of ethanol were
investigated with this configuration, ranging from 15
– 240 mg/L. Figure 7 presents the normalised
transient PD signal for both light sources. It was
observed that increasing ethanol concentration
resulted to a greater drop in PD signal for LS2, with a
maximum decrease of 10% recorded for the highest
concentration. In the case of LS1 the change in
absorption was less significant.
The collected data confirmed the capability of the
setup detecting alcohol vapour, while making it was
possible to differentiate between different
concentrations. Furthermore, lower concentrations of
alcohol vapor needed to be evaluated to assess the
limit of detection and to also compare to the
functionality commercial devices.
Figure 7: Normalised photodiode signal for (top) 1.6 μm
and (bottom) 2.3 μm light sources, for different
concentrations of ethanol vapour. Data presented here are
up to the time where minimum PD signal was observed i.e.,
maximum absorption.
3.1.2 Experimental Configuration Using a
Commercial Breathalyser
In order to compare the detection of gas ethanol in
IREDA to a commercial device, a breathalyser was
incorporated to the experimental setup. Additionally,
the concentration calculation method was verified by
this process. A split Y-tube was connected to the
sample port so that the vapour from the latex balloon
entered the breathalyser and the integrating sphere at
the same time. An image of the modified
experimental setup is shown in
Figure 6
.
Figure 6: (left) Air-filled balloon connected to the setup,
(right) modified experimental setup with a breathalyser.
024681012
0.90
0.91
0.92
0.93
0.94
0.95
0.96
0.97
0.98
0.99
1.00
1.01
1.6
μ
m
Norm. Signal
Time (s)
0mg/L
15mg/L
30mg/L
60mg/L
120mg/L
240mg/L
024681012
0.90
0.91
0.92
0.93
0.94
0.95
0.96
0.97
0.98
0.99
1.00
1.01
Norm. Signal
Time
(
s
)
0mg/L
15mg/L
30mg/L
60mg/L
120mg/L
240mg/L
2.3 μm
Performance Evaluation of IREDA Prototype System: An IR-Based Portable Electronic Detection System for Blood Alcohol Concentration
63
The balloon sample was prepared in an identical
manner to the previous experiments and connected to
the Y-tube. Upon deflation the readings of the
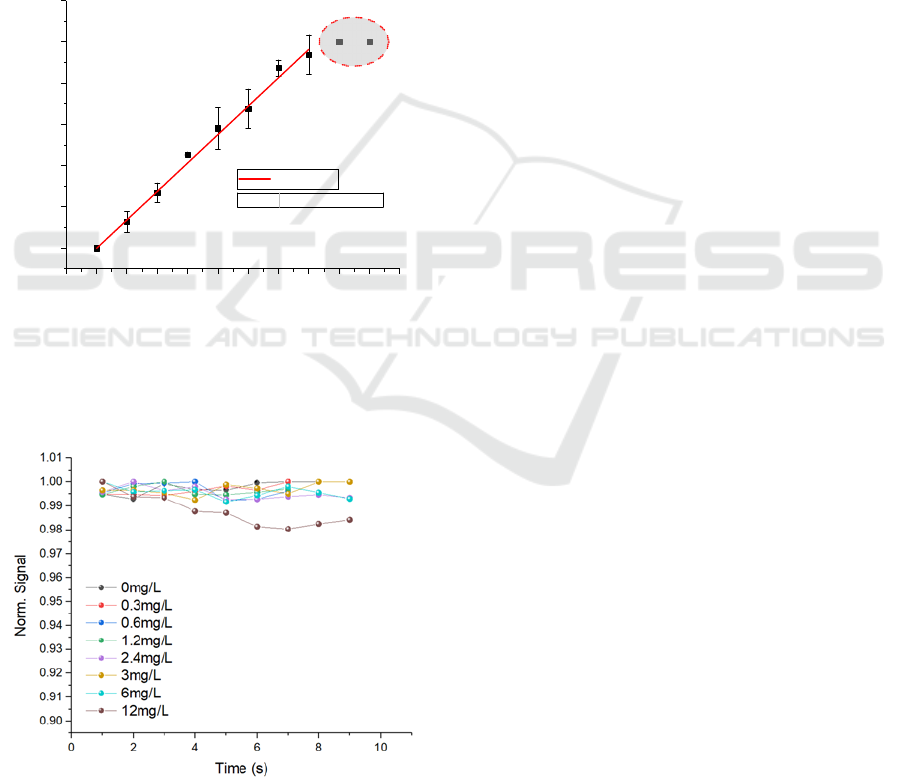
breathalyser and PD signal were recorded. It was
noted that the breathalyser was saturated at about 14
μL of added liquid ethanol. A linear relation between
the amount of ethanol added and the breathalyser
reading was observed as shown in Figure 7. By fitting
the data, a conversion factor from μL to mg/L of
0.172 mg/L/μL was obtained, which agreed with the
one derived by the concentration calculations for a 21
cm diameter sphere and 90% ethanol (0.171
mg/L/μL). It is noteworthy that the PD signal was
indistinguishable for these lower concentration
values (
Figure 8
).
Figure 7: Breathalyser reading versus volume of ethanol
added to the latex balloon. The breathalyser saturated for
values over 14 μL (dashed red circle). The red solid line
represents the linear fit of the data giving a conversion
factor of 0.172 mg/L/μL.
Figure 8: Normalised PD signal of the 2.3 μm laser source
for lower ethanol concentrations between 0 and 12 mg/L.
No notable change in signal was observed for
concentrations below 12 mg/L.
The minimum concentration that the apparatus
was able to detect was 12 mg/L of ethanol vapour.
Furthermore, the signal for LS1 presented relatively
minor changes for different concentrations and for
this reason the data is omitted here. It can be
concluded that the IREDA setup in its present form
has an alcohol vapour detection limit of about 12
mg/L which is in the range of the upper limit of some
commercial breathalysers.
3.1.3 Experimental Configuration Using an
Air-Pressure Regulator Valve
To further optimize the setup, a pressure regulator
was added between the balloon and the integrating
sphere. This offered a controlled flow of gas mixture
and granted monitoring light absorption as the
integrating sphere was slowly filled. The regulator
was set at a constant pressure of 0.2 bar. This
eliminated the problem of the ethanol vapour mixture
entering and exiting the sphere in an uncontrolled
fashion thus creating inconsistencies between
measurements. As the sample vapour was flowing
into the sphere, the photodiode signal was decreased,
eventually reaching a minimum value. As the sphere
was filled with ambient air, absorption decreased,
resulting to an increased photodiode signal.
The experiments were again divided into two
concentration groups, low and high. The first one
ranged from 0 – 7.5 mg/L with an additional high
concentration of 30 mg/L for testing purposes, while
the second group consisted of higher concentrations
ranging from 0 – 120 mg/L.
Figure 9
presents the
normalised signal at 2.3 μm for both groups. Data
presented here are up to 45 s; after this time frame the
photodiode signal started increasing. Similar to the
previous measurements, a noticeable drop in PD
signal for high concentrations was observed but not
in the case of the lower values. Nevertheless, the
incorporation of the regulator to the setup allowed for
the collection of a greater number of data points
during each run which also revealed fluctuations in
the signal over time.
Afterwards, the repeatability of data collection
was assessed for a longer period. For these
measurements, a latex balloon was filled with a
certain amount of ethanol and deflated through the
regulator. The integrating sphere was then flashed
with ambient air and then filled again with the same
concentration of ethanol vapour. This was repeated
three times for each concentration, and it was found
that repeated measurements were consistent. The
average minimum signal value for each concentration
was then derived. The same procedure was carried for
-2 0 2 4 6 8 101214161820
0.0
0.5
1.0
1.5
2.0
2.5
3.0
Breathalyser Reading (mg/L)
Ethanol added
(µ
L
)
Linear Fit
Slope
0.17219 ± 0.0024
PHOTOPTICS 2023 - 11th International Conference on Photonics, Optics and Laser Technology
64
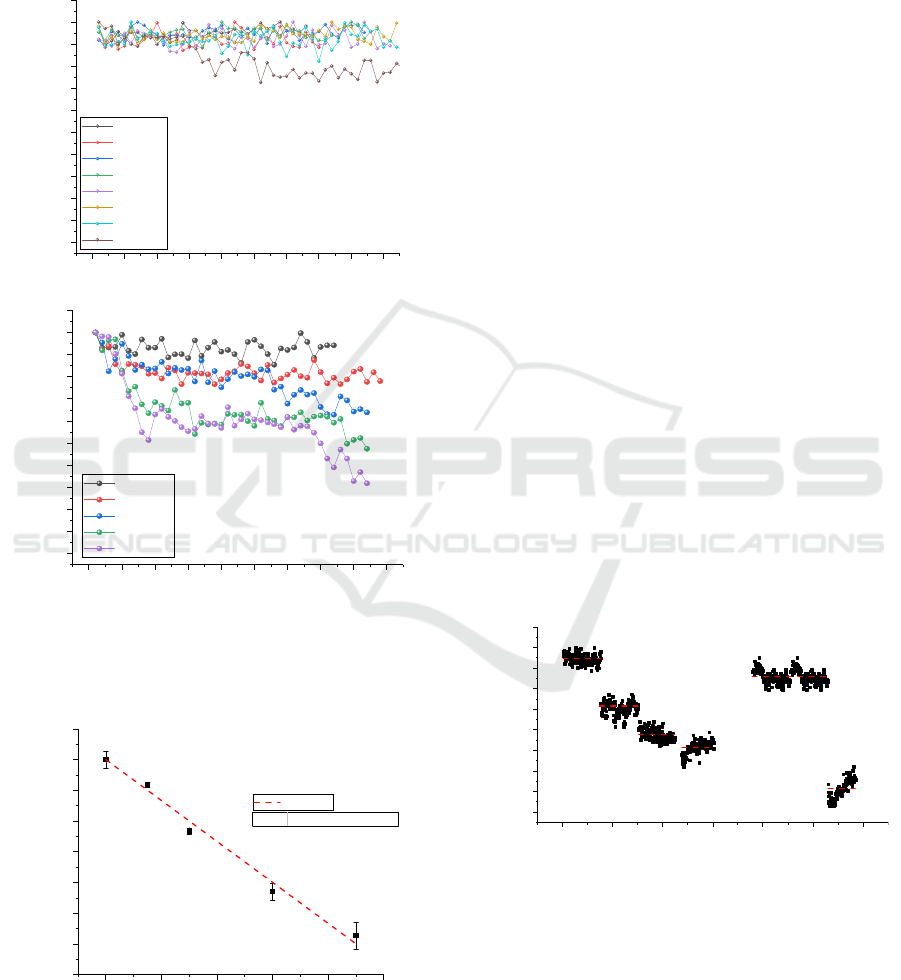
the zero concentration data points. A plot of the
average signal versus concentration revealed a linear
relationship (Figure 10), which in turn gave the rate
of signal decrease with concentration, and it was
found to be -0.0013 (mg/L)
-1
which can be considered
as the sensitivity of the device.
Figure 9: Normalised PD signal of the 2.3 μm laser source
for (top) lower and higher (bottom) ethanol concentrations
while the ethanol vapour flow was controlled by a pressure
regulator set at 0.2 bar.
Figure 10: Average of the minimum signal versus ethanol
concentration. The dashed red line is the linear fit of data.
3.2 Touch-Based Detection System
Validation with Gelatine Samples
Subsequently, alcohol vapour was replaced by a
gelatine mixture to test the device operation with solid
samples resembling human tissue. Gelatine was the
best candidate since it possesses similar properties
with human tissue, it is easily accessible and low-cost.
A generic gelatine powder used for cooking purposes
was used in the following experiments. The samples
were prepared by mixing gelatine powder with water
and TiO2. The mixture was shaken for 5 minutes,
microwaved for 20 seconds, and rotated on a carousel
for 20 minutes. Afterwards, the mixture was poured in
shallow round plastic containers (volume = 2.5 ml)
and allowed to thicken and cool to room temperature
(25℃). The sample was placed at the top port so the
incoming light from the sources was directly incident
on the gelatine while a known amount of ethanol was
injected to gelatine via syringe. Data was collected on
individual samples by increasing the injected ethanol
after a period. At some point, the sample was allowed
to relax so the ethanol was completely evaporated as
shown in Figure 11. This was done to test that the
signal returns to maximum (no absorption) while
using the same sample in the absence of ethanol. The
results revealed that by increasing the injected amount
of ethanol in gelatine the LS2 signal further decreased.
Even though a thorough comparison between these
results and data involving real human tissue and
alcohol consumption cannot be claimed, it is evident
that the IREDA setup can detect changes in ethanol
concentration present in solid samples.
Figure 11 : Normalised PD signal of the 2.3 μm laser source
for added injected ethanol volume in gelatine samples.
Dashed red lines represent the average values.
4 CONCLUSIONS
IREDA has proved the ability to detect ethanol
vapour that simulate human respiration, via multiple
0 5 10 15 20 25 30 35 40 45
0.90
0.91
0.92
0.93
0.94
0.95
0.96
0.97
0.98
0.99
1.00
1.01
Norm. Signal
Time
(
s
)
0mg/L
0.3mg/L
0.6mg/L
0.9mg/L
1.2mg/L
3mg/L
7.5mg/L
30mg/L
0 5 10 15 20 25 30 35 40 45
0.90
0.91
0.92
0.93
0.94
0.95
0.96
0.97
0.98
0.99
1.00
1.01
0mg/L
15mg/L
30mg/L
60mg/L
120mg/L
Norm. Signal
Time (s)
0 20406080100
0.86
0.88
0.90
0.92
0.94
0.96
0.98
1.00
1.02
Linear Fit
Norm. Average Signal
Concentration (mg/L)
Slope
-0.0013 ± 4.7722E-05
0 200 400 600 800 1000 1200
0.84
0.86
0.88
0.90
0.92
0.94
0.96
0.98
1.00
1.02
wait
100 μL
60 μL
40 μL
20 μL
Norm. Signal
Time
(
s
)
no ethanol
Performance Evaluation of IREDA Prototype System: An IR-Based Portable Electronic Detection System for Blood Alcohol Concentration
65

light absorptions within an integrating sphere, leading
to a gas-based detection setup with limit of detection
of about 12 mg/L. Moreover, the feasibility on
detecting ethanol in solid gelatine samples that
simulate ‘tissue’ samples, via touch-based oriented
detection and NIR diffused reflectance has been
demonstrated. Even though, it is challenging to
compare these results with data alcohol consumption
in humans, IREDA can be considered as a promising
prototype towards this direction.
ACKNOWLEDGEMENTS
The work was supported by the Project POST-
DOC/0718/0186 which is co-financed by the
European Regional Development Fund and the
Republic of Cyprus through the Research and
Innovation Foundation
.
REFERENCES
A. Werth, S. L. (2018). Implementation of an integrating
sphere for the enhancement of noninvasive glucose
detection using quantum cascade laser spectroscopy.
Applied Physics B, 1-7.
Fairbairn, C., & Kang, D. (2019). Temporal Dynamics of
Transdermal Alcohol Concentration Measured via
New‐Generation Wrist‐Worn Biosensor. Alcoholism:
Clinical and Experimental Research, 2060-2069.
Guo, X., Shojaei-Asanjan, K., Zhang, D., Sivagurunathan,
K., Sun, Q., Song, P., . . . Zhou, Q. (2018). Highly
sensitive and specific noninvasive in-vivo alcohol
detection using wavelength-modulated differential
photothermal radiometry. Biomedical Optics Express,
4638-4648.
Jurič, A., Fijačko, A., Bakulić, L., Orešić, T., & Gmajnički,
I. (2018). Evaluation of breath alcohol analysers by
comparison of breath and blood alcohol concentrations.
Archives of Industrial Hygiene and Toxicology , 69-76.
L. Ntombela, B. A. (2020). Low-cost fabrication of optical
tissue phantoms for use in biomedical imaging.
Heliyon, e03602.
LM. Hanssen, K. S. (2022). Handbook of Vibrational
Spectroscopy: Integrating spheres for mid-and near-
infrared reflection spectroscopy. John Wiley & Sons.
M. Baer, B. S. (2021). Simultaneous Signal Acquisition by
Synchronous Detection of Orthogonal Frequency
Components. Proceedings of SMSI 2021 Conference -
Sensor and Measurement Science International, 254-
255.
Mishra, R., Sempionatto, J., Li, Z., Brown, C., Galdino, N.,
Shah, R., . . . Tapert, S. (2020). Simultaneous detection
of salivary Δ9-tetrahydrocannabinol and alcohol using
a Wearable Electrochemical Ring Sensor. Talanta,
120757.
P. Demosthenous, M. B. (2022). Infrared Spectroscopic
Application using an Integrating Sphere for Measuring
Vapor Ethanol. Proceedings of OPAL 2022 - 5th
International Conference on Optics, Photonics and
Lasers, 15-17.
P. Demosthenous, M. B. (2022). Near Infrared Diffused
Reflectance on Tissue Simulating Phantoms for Optical
Applications. Proceedings of OPAL 2022 - 5th
International Conference on Optics, Photonics and
Lasers, 12-14.
S. Tranchart, I. B. (1996). Sensitive trace gas detection with
near-infrared laser diodes and an integrating sphere.
Applied optics, 7070-7074.
Sempionatto, J., Brazaca, L., García-Carmona, L., Bolat,
G., Campbell, A., Martin, A., . . . Kim, J. (2019).
Eyeglasses-based tear biosensing system: Non-invasive
detection of alcohol, vitamins and glucose. Biosensors
and Bioelectronics, 161-170.
T. Yamakoshi, J. L. (2015). Integrating sphere finger-
photoplethysmography: preliminary investigation
towards practical non-invasive measurement of blood
constituents. PloS one, e0143506.
Ver Steeg, B., Treese, D., Adelante, R., Kraintz, A.,
Laaksonen, B., Ridder, T., . . . Hildebrandt, L. (2017).
Development of a Solid State, Non-Invasive, Human
Touch Based Blood Alcohol Sensor. In Proceedings of
25th International Technical Conference on the
Enhanced Safety of Vehicles.
PHOTOPTICS 2023 - 11th International Conference on Photonics, Optics and Laser Technology
66
