
A Novel Multi-Modal Sensing System Prototype for Cardiovascular and
Cardiopulmonary Monitoring
Yusuf Ziya Hayirlioglu and Beren Semiz
a
Department of Electrical and Electronics Engineering, Koc University, Istanbul, Turkey
Keywords:
Wearable Devices, Health Monitoring, Seismocardiogram, Photoplethysmogram, Electrocardiogram.
Abstract:
Cardiopulmonary disease treatments can highly benefit from remote monitoring systems, allowing for early
diagnosis and enabling personalized treatment programs. In this paper, the feasibility and performance of
such a system is demonstrated. Continuous and simultaneous monitoring of electrocardiogram (ECG), seis-
mocardiogram (SCG), photoplethysmogram (PPG), and body temperature signals from a total of six sensors
is achieved by a microcontroller-based setup, which consists of a fixed main body mounted on mid-sternum
and a mobile daughter body mounted on the wrist. The data is stored in an SD card and transmitted by a
Bluetooth to PC in real-time, allowing easy data access. The proposed system’s performance is examined in
comparison to the heart rate (HR), heart rate variability (HRV), and respiration rate metrics derived from the
BIOPAC system’s ECG and respiration data. Low margins of error in all test cases show that the system works
at high performance.
1 INTRODUCTION
According to the 2020 report of the World Health
Organization, cardiopulmonary diseases are among
the leading causes of death, constituting a signifi-
cant fraction of the total deaths worldwide (∼30%)
(WHO, 2020). In addition, Hospital Readmissions
Reduction Program (2010), which was passed un-
der the Affordable Care Act, reported heart failure,
acute myocardial infarction and pneumonia as the top
three health problems that should be focused on to re-
duce re-hospitalization rates (Zuckerman et al., 2016).
Considering these facts, remote and continuous mon-
itoring systems could potentially allow early diag-
nosis and intervention, enable the generation of per-
sonalized treatment programs, and provide proactive
and preventive treatment protocols for individuals at
risk of cardiovascular and cardiopulmonary diseases
(Sana et al., 2020).
The main methods used in the clinic for diagno-
sis and follow-up can be listed as assessing (i) the
vital signs (blood pressure, heart rhythm, respira-
tory rhythm, body temperature), (ii) chest and lung
sounds, (iii) heart sounds, and (iv) vascular health
(Gupta and Shea, 2021). Hence, there is a com-
pelling need for novel sensing modalities and anal-
a
https://orcid.org/0000-0002-7544-5974
ysis pipelines to digitize these examination steps and
to achieve continuous health monitoring regardless of
time and environmental stressors.
Since the electrical, mechanical, acoustic and op-
tical signals recorded from the human body have
physiological origins, they can provide clinically use-
ful information about the underlying anatomical and
physiological conditions. Among the aforementioned
signals, the most commonly used ones are the elec-
trocardiogram (ECG), seismocardiogram (SCG) and
photoplethysmogram (PPG) waveforms. While the
ECG measures the electrical activity of the heart,
the SCG assesses the mechanical activity originat-
ing from the contraction of the heart and ejection of
blood from the ventricles (Inan et al., 2014). Stud-
ies have shown that the SCG signal can be lever-
aged in estimating systolic time intervals (Shandhi
et al., 2019), assessment of myocardial contraction
(Tavakolian et al., 2012), heart failure classification
(Inan et al., 2018), studying respiration rate and
phases (Pandia et al., 2012), and derivation of hemo-
dynamic parameters such as stroke volume (Semiz
et al., 2020). On the other hand, the PPG is gener-
ated as a result of the variance in the amount of light
absorbed in the arteries due to the changes in arte-
rial blood volume during the cardiac cycle. In the lit-
erature, it has been shown that analysis of the PPG
signal can provide important information regarding
126
Hayirlioglu, Y. and Semiz, B.
A Novel Multi-Modal Sensing System Prototype for Cardiovascular and Cardiopulmonary Monitoring.
DOI: 10.5220/0011663700003414
In Proceedings of the 16th International Joint Conference on Biomedical Engineering Systems and Technologies (BIOSTEC 2023) - Volume 1: BIODEVICES, pages 126-134
ISBN: 978-989-758-631-6; ISSN: 2184-4305
Copyright
c
2023 by SCITEPRESS – Science and Technology Publications, Lda. Under CC license (CC BY-NC-ND 4.0)

Figure 1: (a) The main body of the proposed wearable device was designed in such a way that ECG, SCG, PPG and body
temperature measurements could be taken continuously. (b-e) The removable daughter body was planned to be designed to
allow additional SCG and PPG measurements to assist in the analysis.
blood oxygen level, blood pressure and vascular re-
sistance assessment (cheol Jeong et al., 2018).
Although there are several wearable system pro-
totypes utilizing ECG, SCG and PPG signals sepa-
rately in the literature (Fattah et al., 2017; Li et al.,
2017; Di Rienzo et al., 2011; Hernandez et al., 2014;
Da He et al., 2011), they have generally been lim-
ited to focusing on heart rhythm assessment. Thus,
none of them allows comprehensive cardiovascular
and cardiopulmonary monitoring as the aforemen-
tioned examination steps could not be digitized alto-
gether. On the other hand, systems allowing multi-
ple measurements only enable the recording of sig-
nals from the location where the device is attached,
thus cannot provide any mobility function (Etemadi
et al., 2015). Since such a system is also expected to
evaluate lung health, respiratory and blood pressure
parameters, having an adaptable and mobile system is
crucial. In addition to all these, it is necessary to de-
velop a system that allows real-time data transfer to
enable timely intervention.
In this paper, for the first time to the best of our
knowledge, an adaptable wearable patch prototype
is designed to enable (i) comprehensive cardiovascu-
lar and cardiopulmonary monitoring through simul-
taneous acquisition of various physiological signals
(ECG, SCG, PPG and body temperature). The pro-
posed design includes a main body to be mounted
on the mid-sternum and a removable daughter body
to allow additional SCG and PPG measurements to
assist in comprehensive cardiopulmonary and cardio-
vascular assessment (Fig. 1). The proposed pro-
totype (ii) supports both real-time data transfer and
SDcard recording, is (iii) developable and adaptable.
Once improved and converted into printed-circuit-
board (PCB) form, the system will be (iv) mobile,
thus will be convenient for the patients and healthcare
professionals for use in various environments, both
inside and outside clinic.
2 METHODS
2.1 Hardware
As previously mentioned, the long-term aim is to
develop a PCB-based multi-modal wearable system,
which would consist of the following two parts:
• MAIN BODY to be mounted on the chest, which
houses the sensors for measuring the body tem-
perature, ECG, proximal PPG and SCG signals,
the microcontroller to which all sensors will be
connected, the battery of the system, and the Blue-
tooth and microSD card modules (Fig. 1(a)).
• DAUGHTER BODY to be mounted on distal lo-
cations, which houses the sensors that can be at-
tached or detached from the main body and allows
recording of distal SCG and PPG signals (Fig.
1(b-e)).
Based on this design, in this paper, a development-kit-
based system prototype is presented (Fig. 2(a)). First,
the sensors in the market and literature were investi-
gated and the most suitable ones were determined.
2.1.1 Seismocardiogram (SCG) and
Photoplethysmogram (PPG)
In the literature, analysis of the SCG signal has gener-
ally been performed at <100 Hz frequency values and
it has been shown that having a sample rate around
500 Hz is sufficient (Semiz et al., 2020). Although
analog accelerometers have higher bandwidth com-
pared to digital accelerometers, the main aim was to
select an accelerometer having low noise, high reso-
lution, and sensitivity to allow measurement of peak-
to-peak amplitude values within the limits of <10 mg.
Hence, it was decided to use the ADXL355 (Analog
Devices, Norwood, MA, USA) accelerometer with
25 µg/
√
Hz noise floor and 0.003 mV/bit resolution,
A Novel Multi-Modal Sensing System Prototype for Cardiovascular and Cardiopulmonary Monitoring
127
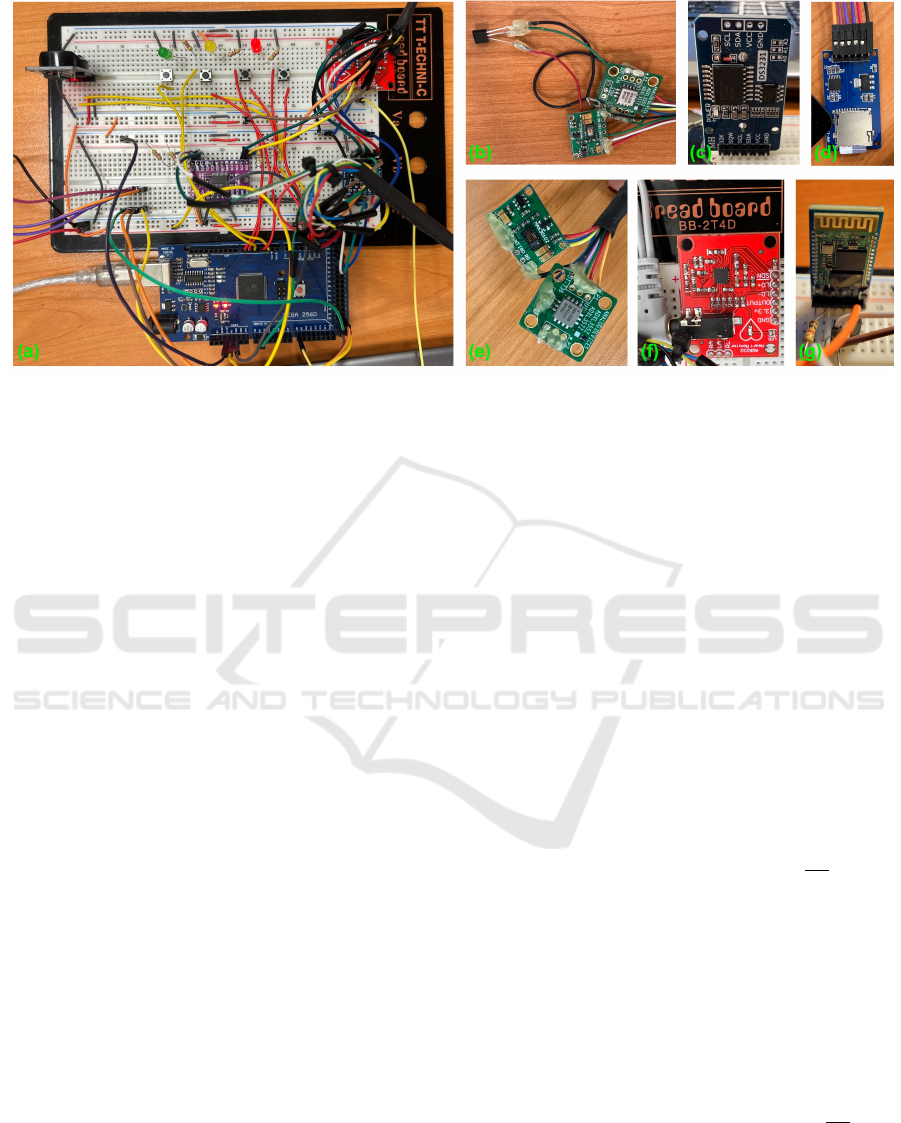
Figure 2: (a) General view of the system, (b) Temperature, MAX30102 and ADXL355 sensors to be mounted on the chest
area, (c) DS3231 RTC module, (d) HW-125 microSD card module, (e) MAX30102 and ADXL355 sensors to be mounted on
the wrist area, (f) AD8232 analog front-end IC, (g) HC-05 Bluetooth module.
which has been proven successful in previous studies
(Ganti et al., 2020). In accordance with the design,
two ADXL355 accelerometers were included in the
system, one for each of the main (chest) and daughter
bodies (Fig. 2(b) and (e)).
For the PPG signal, first the systems available in
the market were examined. Smart watches on the
market mostly rely on the use of green light emitting
diode (LED) as green LED has relatively higher sig-
nal quality and is less susceptible to motion artifacts
compared to red and infrared lights. However, green
LED-based systems could only allow the measure-
ment of the microvascular network on the skin sur-
face due to green light’s relatively lower wavelength.
On the contrary, red and infrared lights have longer
wavelengths, thus can penetrate into the depths where
the arteries are located in the tissue (Lee et al., 2013;
Maeda et al., 2011). Hence, in the design of the PPG
system, the use of red and infrared LEDs was pre-
ferred. To this end, a digital MAX30102 (Maxim
Integrated, Sunnyvale, CA, USA) sensor with a res-
olution of 0.05 mV/bit and a sampling rate of 3200
samples/second has been deemed appropriate. Two
MAX30102 sensors were included in the system,
one for the main (chest) and one for the daugh-
ter body (Fig. 2(b) and (e)). It should be noted
that MAX30102 only has one I2C address, therefore,
an I2C multiplexer, TCA9548A (Texas Instruments,
Dallas, TX, USA), was used to prevent any commu-
nication conflict when utilizing two of them.
While the ADXL355 and MAX30102 sensors
both support I2C communication, the maximum
clock frequency ADXL355 supports is 3.4 MHz, and
the maximum clock frequency MAX30102 supports
is 400 kHz. Therefore, the maximum clock frequency
of the I2C protocol would be 400 kHz when the
same signal bus is used. 400 kHz was deemed to
be sufficient considering the requirements of the pro-
totype. Additionally, the ADXL355 is a 3 V sensor
with no on-board regulators and the current prototype
runs with 5 V. To prevent any damage to the sen-
sor, we used logic level enhancement mode field ef-
fect transistors, BSS138 (ON Semiconductor Corpo-
ration, Phoenix, Arizona, USA), in the I2C bus. Both
ADXL355 and MAX30102 packages include built-in
FIFOs, allowing temporary storage of data.
2.1.2 Electrocardiogram (ECG) and Body
Temperature
To record the ECG signal, AD8232 (Analog Devices,
Norwood, MA, USA) analog front-end integrated cir-
cuit (IC) with a noise floor of 100 nV/
√
Hz, gain of
100, and gain-bandwidth product of 100 kHz was se-
lected (Fig. 2(f)). Three gel electrodes were mounted
in the Einthoven’s triangle arrangement and the sig-
nals obtained through these electrodes were condi-
tioned by AD8232. The resulting signal was then
sampled at 10 bit resolution and 500 Hz by AT-
MEGA2560’s analog-to-digital converter (ADC).
For body temperature measurement, LM35 (Texas
Instruments, Dallas, TX, USA) analog IC with
±0.5
◦
C accuracy, 10 mV/
◦
C linear scale factor, -55
◦
C
- 150
◦
C measurement range and 600 nV/
√
Hz noise
floor was chosen and integrated into the part to be
mounted on the chest (Fig. 2(b)). The signal was
sampled by the ATMEGA2560’s ADC at 10-bit reso-
lution and 1 Hz.
BIODEVICES 2023 - 16th International Conference on Biomedical Electronics and Devices
128

2.1.3 Microcontroller
The features considered in the selection of the mi-
crocontroller were as follows: having enough pro-
cessing power to collect data at the desired sampling
rates, working with as low power as possible, hav-
ing a high storage area and EEPROM, and having a
sufficient number of analog and digital pins. With
256 KByte memory, 8 KByte EEPROM, 16 analog
pins, and 86 programmable input/output lines, AT-
MEGA2560 was deemed sufficient for the prototype.
Powered at 5 V in active mode with an 11.0592 MHz
crystal oscillator, it has a current consumption of 14
mA, and a current consumption of 0.1 uA in power-
off mode. Having four 16-bit timers and six hardware
interrupts also had a positive effect on the microcon-
troller choice.
2.1.4 Data Storage and Transfer
To achieve real-time data transfer, Bluetooth func-
tionality was included in the prototype. In addition
to Bluetooth connection, data is simultaneously saved
on the microSD card to act as a back-up. For the SD
card a high write speed is desired for faster opera-
tion. The SD card of choice was a 16GB SanDisk
Ultra with an 80 MB/s write speed. The SD card was
integrated into the system through HW-125 microSD
card module (Fig. 2(d)) and file naming was provided
by the date/time stamps taken from the DS3231 RTC
module (Fig. 2(c)).
For Bluetooth connection, HC-05, which has a
maximum baud rate of 1328400 and can work as both
slave and master, was selected (Fig. 2(g)). In the
system, 24 KBytes of data was produced per second,
while the Bluetooth could reach a data transmission
rate of 132 KBytes per second. While searching for a
device to be connected, the query time interval, query
time, paging time interval and paging time were set as
640 ms, 0.625 ms, 640 ms, and 0.625 ms, respectively
to ensure that the Bluetooth consumes less power than
it does with its default parameter values. When con-
nected to a device, the Bluetooth was put into sniff
mode, so that it consumes less power while waiting
for a command during communication. The maxi-
mum time, minimum time, test time and waiting time
for the sniff mode were selected as 125 ms, 6.25 ms,
1.25 ms, and 5 s, respectively.
It should be noted that when the data is being
stored and transferred, all data points are processed
simultaneously due to data structure to be used. Al-
though not all sensors are sampled at 500 Hz, all data
is stored and transferred at the highest sampling rate.
Therefore signals with sampling rates smaller than
500 Hz will have repeating samples in them.
2.2 Firmware
First, the time required to read data from the sen-
sors, save it on the SD card, and send it via Blue-
tooth while the system reaches the desired sampling
rates was investigated. I2C communication was es-
tablished at the clock frequency of 400 kHz, due to
MAX30102’s speed constraint. With this communi-
cation speed, samples could be read from both in-
frared and red LEDs of the MAX30102 at approxi-
mately 0.9 ms, and the X, Y and Z axes of ADXL355
at 0.6 ms. And for the analog data, it took around 0.15
ms to read one sample. Overall, two MAX30102s,
two ADXL355s, one ECG and one temperature sen-
sor were included in the system. The ADXL355 and
MAX30102 collect data at 500 Hz and 200 Hz sam-
ple rates respectively. The data MAX30102 collects is
subjected to an on-chip sample averaging operation,
leading to an effective sampling rate of 50 Hz. The
ECG is sampled at 500 Hz and the temperature sen-
sor is sampled at 1 Hz.
Based on these specifications, reading data from
the accelerometers (0.6 ms each) and the ECG sen-
sor (0.15 ms) were taking 1.35 ms of a 2 ms cycle.
When various other operations were added into the
system (e.g., writing data to SD card, sending data
over Bluetooth, reading data from MAX30102), it
was observed that data could not be timely obtained
from the sensors which required to be sampled at 500
Hz, resulting in data skipping when the FIFOs over-
flow. To overcome this problem, an algorithm was
developed. In this algorithm, the time spent by AT-
MEGA2560 in the statements was calculated. The
primary timer-controlled statement, which executes
most frequently, needs to be completed in less than
2 ms due to 500 Hz sampling rate requirement. If the
microcontroller goes over 2 ms in the statement, the
extra time spent is stored in a variable and is incre-
mented with each occurrence of such an event. In the
case when the extra time it calculates goes over 2 ms,
the microcontroller is forced to read from FIFOs of
the sensors and the virtual FIFO created for the ECG.
With this algorithm, it was ensured that the microcon-
troller will collect all available data from the sensors
without missing any samples.
The reasoning behind using a virtual FIFO for the
ECG is because the ECG samples were not being col-
lected at constant intervals due to variable statement
execution times, causing both data skipping and data
shifting. By using the FIFOs of the MAX30102 and
ADXL355, the data could be collected at the desired
frequencies without any data shift and with the help of
the aforementioned algorithm, data skipping problem
was also solved. However, the analog ECG sensor,
A Novel Multi-Modal Sensing System Prototype for Cardiovascular and Cardiopulmonary Monitoring
129
which lacks any kind of storage element, was experi-
encing data skipping and small data shifts. As a so-
lution, a virtual FIFO and timer interrupts were used.
Whenever data needs to be read from the ECG sensor,
the ATMEGA2560 is interrupted by the timer and a
data point is sampled from the ECG sensor. This en-
sures that the ECG is sampled at constant intervals.
The sample is then stored in the virtual buffer cre-
ated for the ECG until it is written to the SD card and
transmitted by the Bluetooth.
Four different modes (Start Recording, Pause
Recording, Stop Recording and Low Power ) have
been added to the system via buttons using hardware
interrupts to control recording capability and power
consumption. In Start Recording mode, the system
starts reading data by creating a new file on the SD-
card and writes the data it reads to this file. The
name of the file is determined by the timestamp cap-
tured by the DS3231 RTC module. Pause Recording
mode temporarily stops recording while recording is
in progress, but does not close the file. To continue
recording, Pause Recording button should be pressed
again. In Stop Recording mode, the created file is
closed and recording is stopped. Data written to the
SDcard is simultaneously sent to Bluetooth via the se-
rial port and to PC via Bluetooth. To test the Blue-
tooth connection with a PC, PuTTY was used. The
data that PuTTY writes to its console is saved in a
log file. The last mode, Low Power mode turns off
the sensors and communication channels busses on
the system, and puts the microcontroller in low power
mode, minimizing power consumption.
2.3 Data Collection Protocol
This study was conducted under a protocol approved
by the Koc University Institutional Review Board and
all subjects provided written consent. The system was
tested on two subjects (one male and one female) with
no history of cardiovascular or cardiorespiratory dis-
eases. The main body of the system (Fig. 2(b)) in-
cluding a tri-axial accelerometer, PPG module and
temperature sensor was mounted on the mid-sternum
of the subject using hypoallergenic transparent medi-
cal tape. Three ECG cables were attached to the chest
through gel electrodes in accordance with Einthoven’s
triangle. Additionally, the daughter body (Fig. 2(e))
including a tri-axial accelerometer and PPG module
was placed on the wrist with the same medical tape.
It should be noted that the accurate direction of the
accelerometers and skin-contact of PPG sensors were
ensured before starting data collection.
Along with the signals collected through the pro-
totype, reference respiration and ECG signals were
recorded simultaneously with the BIOPAC system
(BIOPAC Systems, Inc. Goleta, CA, USA). Refer-
ence respiration signal was measured using respira-
tion effort transducer and reference ECG signal was
acquired through three gel electrodes. The signals
were transferred to the BIOPAC system using wire-
less Bionomadix RSPEC-R module (BIOPAC Sys-
tems, Inc. Goleta, CA, USA). All reference signals
were sampled at 500 Hz.
As the main goal was to validate the system, the
protocol did not include any physiological modula-
tion. Instead, the subjects stood motionless vertically
for five minutes. The signals were post-processed us-
ing MATLAB (MathWorks, Natick, MA, USA).
2.4 Data Analysis
In this section, physiological parameters derived from
the reference signals and the ones acquired with the
prototype were compared to assess the performance
of the prototype. First, the signals were filtered us-
ing digital finite impulse response (FIR) band-pass
filters in accordance with the bandwidths reported in
the literature (Carek et al., 2017; Pandia et al., 2012;
Shandhi et al., 2019). For ECG and PPG, frequency
ranges were determined as 0.5 - 40 Hz and 1 - 16
Hz, respectively. For the SCG signals, two different
FIR filters were implemented. The one having 0 - 1
Hz range, which corresponds to the chest movements
originating from exhalation and inhalation, was ap-
plied to derive the respiratory information. On the
other hand, the one having 1- 40 Hz bandwidth was
used to represent the vibration and acoustic infor-
mation originating from the cardiac output and heart
sounds.
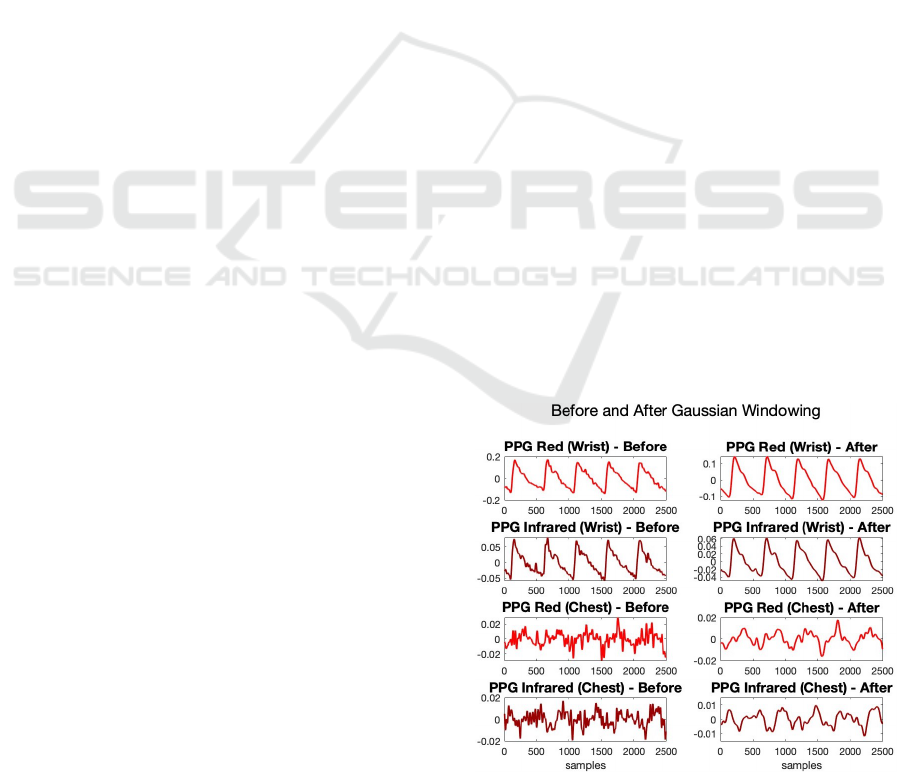
Figure 3: PPG signals before and after Gaussian window-
ing.
BIODEVICES 2023 - 16th International Conference on Biomedical Electronics and Devices
130
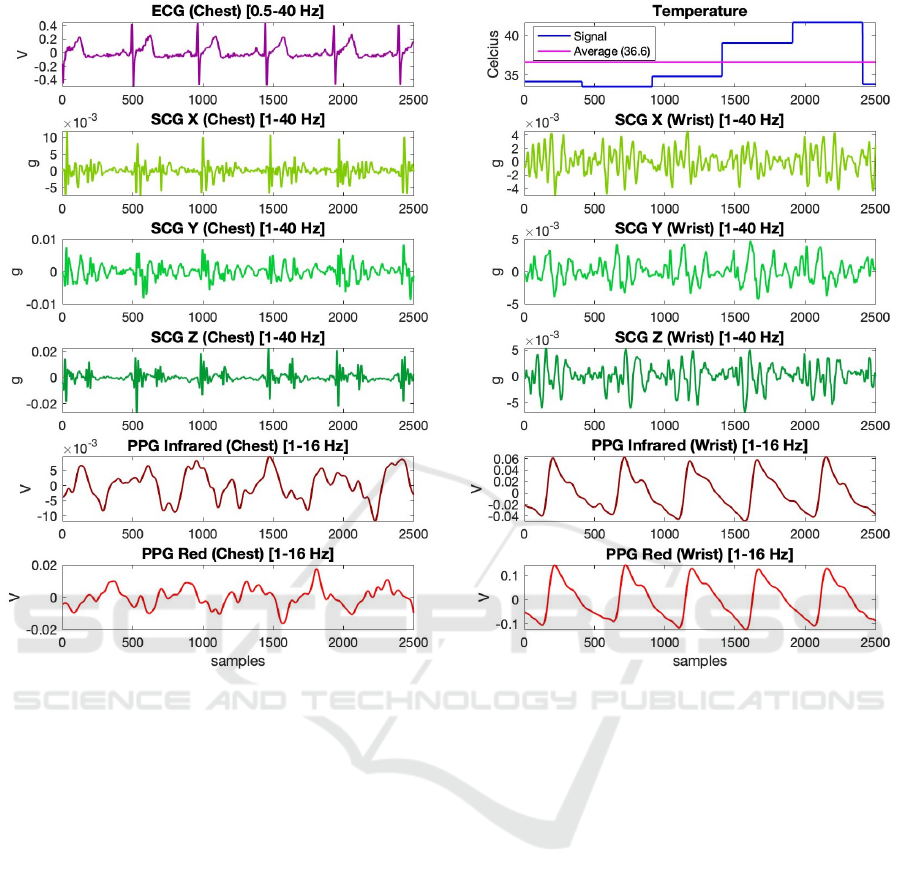
Figure 4: 5-second-long, pre-processed segments of the signals acquired with the system.
2.4.1 Derivation of Heart Rate and Heart Rate
Variability
First, performance of the prototype in estimating heart
rate (HR) and heart rate variability (HRV) values
through the acquired ECG and PPG signals was as-
sessed. It has been observed that the PPG signals
taken from the chest in particular contain a high level
of noise, therefore it was more difficult to determine
the peak and dicrotic points compared to the PPG
taken from the wrist. This was an expected result,
as it was more difficult to reach the microvascular re-
gion in the chest area compared to the wrist. To mit-
igate the negative impact of signal quality, Gaussian
smoothing (window length: 100, width factor: 2.75)
was applied to smooth out these noise-based oscilla-
tions observed in the signals. 5-second-long segments
from the PPG signals before and after Gaussian win-
dowing were presented in Fig. 3. HR and HRV were
then calculated using the following steps:
1. First, reference HR and HRV values were cal-
culated using the reference ECG signal recorded
with the BIOPAC system. To this end, R-points on
the ECG were determined and an RR vector was
created by calculating intervals between succes-
sive R-points. HR in beats per minute (bpm) and
HRV in milliseconds were calculated on this vec-
tor using Eq. 1 and Eq. 2, respectively (std: stan-
dard deviation, F
s
: sampling rate). The standard
deviation of inter-beat-interval (SDNN) is mea-
sured in ms. The short-term recording for SDNN
is 5 minutes (Shaffer and Ginsberg, 2017).
2. After computing the reference values, HR and
HRV were derived from the ECG signal acquired
through the prototype using the same formulas.
3. In the last step, PPG signals acquired through the
prototype from the wrist and chest were used to
derive the HR and HRV values. By calculating
the time interval between consecutive peaks on
the Gaussian-windowed red and infrared PPG sig-
nals, a PP vector similar to the RR vector was gen-
erated. HR and HRV values were calculated using
the same formulas, but inserting the PP vector in-
stead of the RR vector.
4. To calculate the percent error (%error), Eq. 3
A Novel Multi-Modal Sensing System Prototype for Cardiovascular and Cardiopulmonary Monitoring
131
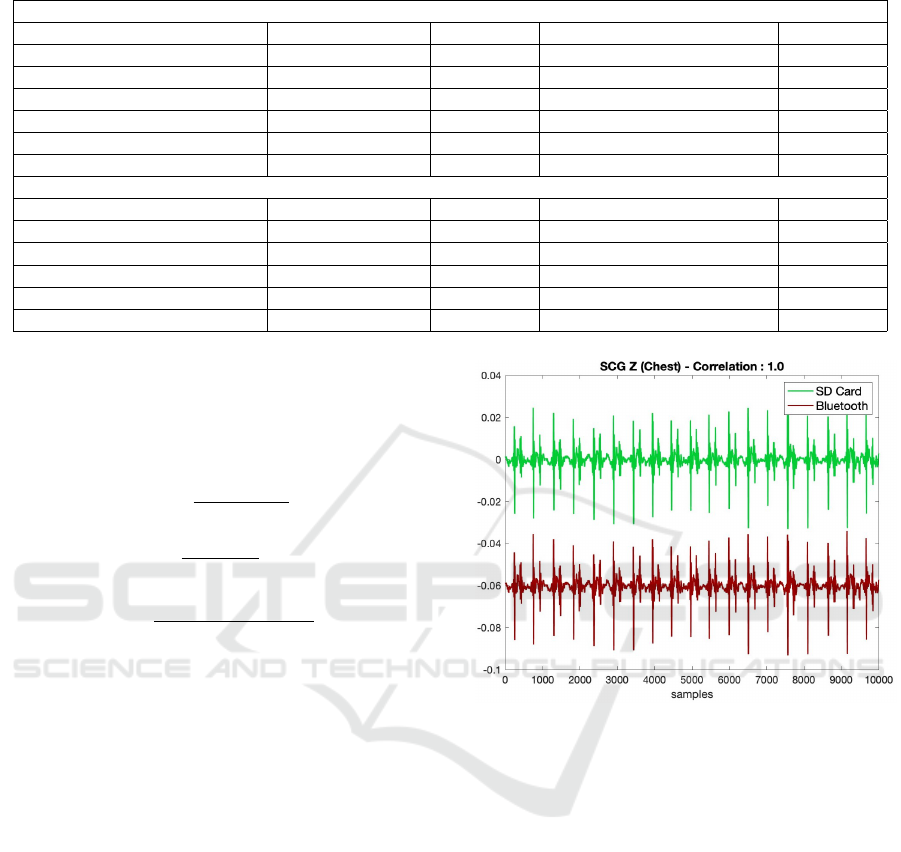
Table 1: Heart rate and heart rate variability calculations (bpm: beats per minute, ms: milliseconds).
First Subject
Heart Rate (bpm) Error (%) Heart Rate Variability (ms) Error (%)
BIOPAC ECG (Reference) 65.2 - 15.2 -
Wearable ECG 65.9 1.07 15.9 4.61
Wearable PPG Infrared (Wrist) 65.6 0.61 15.3 0.66
Wearable PPG Red (Wrist) 65.6 0.61 15.3 0.66
Wearable PPG Infrared (Chest) 66.3 1.68 15.5 1.97
Wearable PPG Red (Chest) 67.2 3.07 15.7 3.29
Second Subject
BIOPAC ECG (Reference) 88.8 - 15.0 -
Wearable ECG 90.2 1.58 17.2 14.6
Wearable PPG Infrared (Wrist) 90.2 1.58 17.2 14.6
Wearable PPG Red (Wrist) 89.8 1.12 17.2 14.6
Wearable PPG Infrared (Chest) 88.9 0.11 17.2 14.6
Wearable PPG Red (Chest) 91.9 3.49 17.4 16.0
was used where actual stands for the reference
HR and HRV values and calculated stands for the
ones computed using the ECG, PPG-red and PPG-
infrared signals acquired from the prototype.
HR =
60 ∗F
s
mean(RR))
(1)
HRV =
F
s
std(RR))
∗1000 (2)
%error =
actual −calculated
actual
∗100 (3)
2.4.2 Derivation of Respiration Rate
SCG signal, which was filtered in 0 - 1 Hz range, was
used to extract respiratory information. The analy-
sis was specifically performed on the dorso-ventral
axis in accordance with the literature (Pandia et al.,
2012). Subsequently, Gaussian windowing was ap-
plied as previously done in PPG case to smooth out
the oscillations observed in the signal. Using the
peaks on these signals, reference and SCG-derived
respiration rates (number of exhalation-inhalations in
one minute) were calculated.
3 RESULTS AND DISCUSSION
3.1 System Performance
5-second-long, pre-processed segments of the signals
acquired with the system from one of the subjects
were presented in Fig. 4. As can be seen from the
plots, the sensors could successfully collect the phys-
iological signals at the desired sampling rates. In ad-
dition, the representative SCG signals written to SD
Figure 5: Comparison of representative SCG signals written
to SD card and transferred to computer via Bluetooth. There
was a correlation of 100% and no data loss was observed
during Bluetooth transmission.
card and transferred to computer via Bluetooth are
presented in Fig. 5. It should be noted that the sig-
nal received via Bluetooth has been shifted down in
the y-axis to facilitate visualization. As seen, there is
a 100% correlation between the signals and there is
no data loss during transmission via Bluetooth.
3.2 Comparison with Reference
Measurements
3.2.1 Heart Rate and Heart Rate Variability
First, the performance of the prototype in estimating
HR and HRV values through the acquired ECG and
PPG signals was assessed. As detailed in Section
2.4.1, HR and HRV were calculated using the time
intervals between the consecutive peak locations on
ECG and PPG signals. On the other hand, the ref-
BIODEVICES 2023 - 16th International Conference on Biomedical Electronics and Devices
132
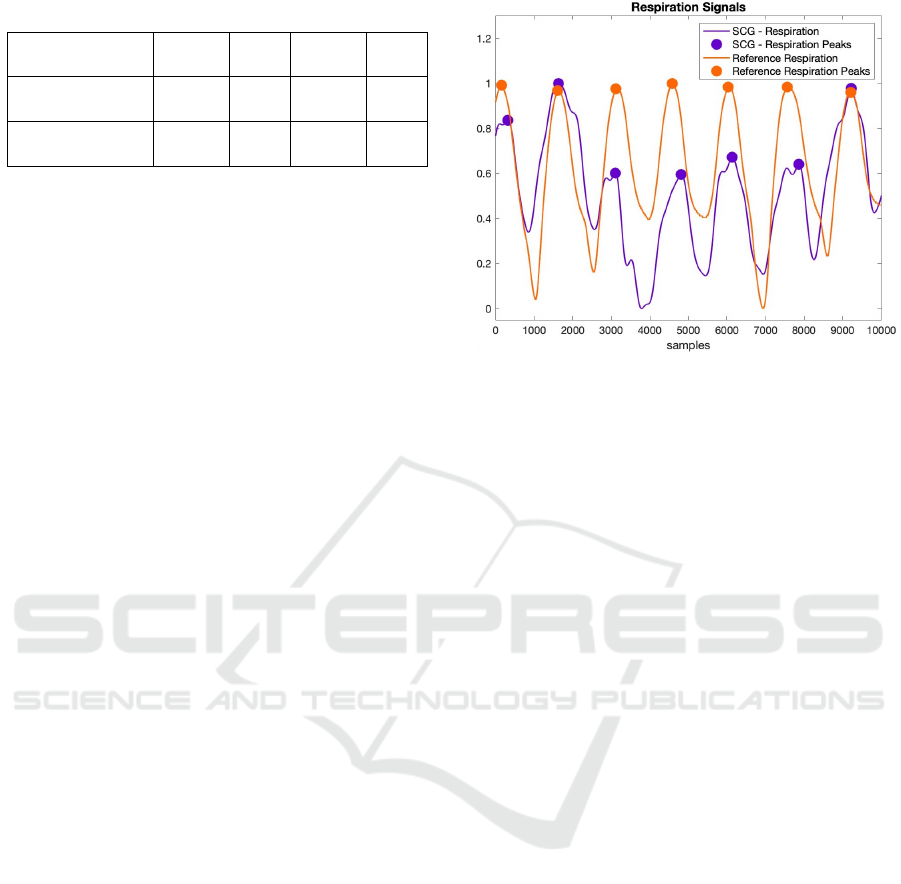
Table 2: Breathing Rate Calculations ( breaths per minute).
First
Subject
Error
(%)
Second
Subject
Error
(%)
BIOPAC Belt
(Reference)
24.5 - 21.1 -
Wearable SCG-Z
(Chest, 0-1 Hz)
24.8 1.22 20.7 1.89
erence HR and HRV were calculated using the peak
locations on the ECG acquired with the BIOPAC sys-
tem. The resulting HR and HRV values for both sub-
jects are presented in Table 1. The low margin of error
between the reference and prototype-derived values
shows the high performance of the designed system.
Specifically, there is a maximum of 2-beat difference
between the reference HR values and the ones derived
from ECG and PPG signals acquired from chest and
wrist. Additionally, although the PPG signal quali-
ties obtained from the chest and wrist were differ-
ent (chest being more susceptible to artifacts), this
negative effect could be eliminated with filtering and
Gaussian smoothing. Indeed, the HR values obtained
from the chest and wrist resulted in negligible errors,
both being similar to the reference HR measurements.
3.2.2 Respiration Rate
20-second-long segments from the reference and
SCG-derived respiration signals from one of the sub-
jects were presented in Fig. 6. As seen in the figure,
the respiratory signal generated from the SCG signal
moves in parallel with the reference respiratory sig-
nal. In addition, the number of breaths per minute
calculated on the reference and SCG signals for both
subjects is presented in Table 2. For the first subject,
reference and SCG-based breathing rates were cal-
culated as 24.5 and 24.8 breaths per minute, respec-
tively. For the second subject, these values were 21.1
and 20.7, respectively. Obtaining almost the same
number of respiration cycles with the reference wave-
form in both subjects shows that the sensors in the
system and the signal improvement methods work at
high performance.
4 CONCLUSIONS
In this work, an adaptable wearable patch prototype
is designed to enable comprehensive cardiovascular
and cardiopulmonary monitoring through simultane-
ous acquisition of ECG, PPG, SCG, and body tem-
perature signals. The design includes a main body to
be mounted on the mid-sternum to collect proximal
ECG, SCG, PPG and body temperature signals, and
a removable daughter body to allow distal SCG and
Figure 6: Comparison of the reference and SCG-derived
respiratory signals.
PPG measurements to assist in comprehensive health
assessment. Respiration rate, HR and HRV values
from two subjects obtained from the prototype were
compared with the reference ones acquired with the
BIOPAC system. Obtaining a low margin of error in
all cases showed that the prototype and the signal im-
provement methods work at high performance. In ad-
dition, the signals transferred with the Bluetooth sys-
tem achieved 100% correlation with the signals saved
on the SDcard. Despite receiving data from so many
sensors, having no data loss was indeed a promising
result for the future versions of the current prototype.
Future work will focus on validating the system
with a larger dataset including subjects having vary-
ing physiological and demographic features. Addi-
tionally, since the calculation of oxygen saturation
and blood pressure values from the PPG signal pri-
marily requires a calibration step, studies in this area
will be carried out after collecting data from a large
number of participants. In the long run, the prototype
will be converted into the PCB form having actual
main and daughter bodies to allow cable-free mea-
surements. Such a system will potentially be con-
venient for the patients and healthcare professionals
to achieve continuous health monitoring regardless of
time and environmental stressors.
ACKNOWLEDGEMENTS
This work was supported by the Scientific and Tech-
nological Research Council of Turkey (TUBITAK)
under grant number 121E133.
A Novel Multi-Modal Sensing System Prototype for Cardiovascular and Cardiopulmonary Monitoring
133

REFERENCES
Carek, A. M., Conant, J., Joshi, A., Kang, H., and Inan,
O. T. (2017). Seismowatch: wearable cuffless blood
pressure monitoring using pulse transit time. Proceed-
ings of the ACM on interactive, mobile, wearable and
ubiquitous technologies, 1(3):1–16.
cheol Jeong, I., Bychkov, D., and Searson, P. C. (2018).
Wearable devices for precision medicine and health
state monitoring. IEEE Transactions on Biomedical
Engineering, 66(5):1242–1258.
Da He, D., Winokur, E. S., and Sodini, C. G. (2011). A con-
tinuous, wearable, and wireless heart monitor using
head ballistocardiogram (bcg) and head electrocardio-
gram (ecg). In 2011 Annual International Conference
of the IEEE engineering in medicine and biology so-
ciety, pages 4729–4732. IEEE.
Di Rienzo, M., Meriggi, P., Rizzo, F., Vaini, E., Faini,
A., Merati, G., Parati, G., and Castiglioni, P. (2011).
A wearable system for the seismocardiogram assess-
ment in daily life conditions. In 2011 Annual In-
ternational Conference of the IEEE Engineering in
Medicine and Biology Society, pages 4263–4266.
IEEE.
Etemadi, M., Inan, O. T., Heller, J. A., Hersek, S., Klein, L.,
and Roy, S. (2015). A wearable patch to enable long-
term monitoring of environmental, activity and hemo-
dynamics variables. IEEE transactions on biomedical
circuits and systems, 10(2):280–288.
Fattah, S. A., Rahman, M. M., Mustakin, N., Islam, M. T.,
Khan, A. I., and Shahnaz, C. (2017). Wrist-card: Ppg
sensor based wrist wearable unit for low cost person-
alized cardio healthcare system. In 2017 IEEE Global
Humanitarian Technology Conference (GHTC), pages
1–7. IEEE.
Ganti, V. G., Carek, A. M., Nevius, B. N., Heller, J. A.,
Etemadi, M., and Inan, O. T. (2020). Wearable cuff-
less blood pressure estimation at home via pulse tran-
sit time. IEEE Journal of Biomedical and Health In-
formatics, 25(6):1926–1937.
Gupta, J. and Shea, M. (2021). Cardiovascu-
lar examination. Merck Manual. https:
//www.merckmanuals.com/en-pr/professional/
cardiovascular-disorders/approach-to-the-cardiac-
patient/cardiovascular-examination(visited:2022-09).
Hernandez, J., Li, Y., Rehg, J. M., and Picard, R. W.
(2014). Bioglass: Physiological parameter estimation
using a head-mounted wearable device. In 2014 4th
International Conference on Wireless Mobile Com-
munication and Healthcare-Transforming Healthcare
Through Innovations in Mobile and Wireless Tech-
nologies (MOBIHEALTH), pages 55–58. IEEE.
Inan, O. T., Baran Pouyan, M., Javaid, A. Q., Dowling, S.,
Etemadi, M., Dorier, A., Heller, J. A., Bicen, A. O.,
Roy, S., De Marco, T., et al. (2018). Novel wearable
seismocardiography and machine learning algorithms
can assess clinical status of heart failure patients. Cir-
culation: Heart Failure, 11(1):e004313.
Inan, O. T., Migeotte, P.-F., Park, K.-S., Etemadi, M.,
Tavakolian, K., Casanella, R., Zanetti, J., Tank, J.,
Funtova, I., Prisk, G. K., et al. (2014). Ballistocardio-
graphy and seismocardiography: A review of recent
advances. IEEE journal of biomedical and health in-
formatics, 19(4):1414–1427.
Lee, J., Matsumura, K., Yamakoshi, K.-i., Rolfe, P., Tanaka,
S., and Yamakoshi, T. (2013). Comparison between
red, green and blue light reflection photoplethysmog-
raphy for heart rate monitoring during motion. In 2013
35th annual international conference of the IEEE en-
gineering in medicine and biology society (EMBC),
pages 1724–1727. IEEE.
Li, S.-H., Lin, B.-S., Wang, C.-A., Yang, C.-T., and
Lin, B.-S. (2017). Design of wearable and wire-
less multi-parameter monitoring system for evaluat-
ing cardiopulmonary function. Medical Engineering
& Physics, 47:144–150.
Maeda, Y., Sekine, M., and Tamura, T. (2011). Relation-
ship between measurement site and motion artifacts
in wearable reflected photoplethysmography. Journal
of medical systems, 35(5):969–976.
Pandia, K., Inan, O. T., Kovacs, G. T., and Giovangrandi, L.
(2012). Extracting respiratory information from seis-
mocardiogram signals acquired on the chest using a
miniature accelerometer. Physiological measurement,
33(10):1643.
Sana, F., Isselbacher, E. M., Singh, J. P., Heist, E. K.,
Pathik, B., and Armoundas, A. A. (2020). Wearable
devices for ambulatory cardiac monitoring: Jacc state-
of-the-art review. Journal of the American College of
Cardiology, 75(13):1582–1592.
Semiz, B., Carek, A. M., Johnson, J. C., Ahmad, S.,
Heller, J. A., Vicente, F. G., Caron, S., Hogue, C. W.,
Etemadi, M., and Inan, O. T. (2020). Non-invasive
wearable patch utilizing seismocardiography for peri-
operative use in surgical patients. IEEE Journal
of Biomedical and Health Informatics, 25(5):1572–
1582.
Shaffer, F. and Ginsberg, J. P. (2017). An overview of heart
rate variability metrics and norms. Frontiers in Public
Health, 5.
Shandhi, M. M. H., Semiz, B., Hersek, S., Goller, N.,
Ayazi, F., and Inan, O. T. (2019). Performance
analysis of gyroscope and accelerometer sensors for
seismocardiography-based wearable pre-ejection pe-
riod estimation. IEEE journal of biomedical and
health informatics, 23(6):2365–2374.
Tavakolian, K., Portacio, G., Tamddondoust, N. R., Jahns,
G., Ngai, B., Dumont, G. A., and Blaber, A. P. (2012).
Myocardial contractility: A seismocardiography ap-
proach. In 2012 Annual International Conference of
the IEEE Engineering in Medicine and Biology Soci-
ety, pages 3801–3804. IEEE.
WHO (2020). The top 10 causes of death. Geneva: World
Health Organization. https://www.who.int/news-
room/fact-sheets/detail/the-top-10-causes-of-death
(visited: 2022-09).
Zuckerman, R. B., Sheingold, S. H., Orav, E. J., Ruhter,
J., and Epstein, A. M. (2016). Readmissions, observa-
tion, and the hospital readmissions reduction program.
New England Journal of Medicine, 374(16):1543–
1551.
BIODEVICES 2023 - 16th International Conference on Biomedical Electronics and Devices
134
