
Evaluating Differences in Insights from Interactive Dimensionality
Reduction Visualizations Through Complexity and Vocabulary
Mia Taylor
1
, Lata Kodali
2
, Leanna House
2
and Chris North
1
1
Department of Computer Science, Virginia Tech, U.S.A.
2
Department of Statistics, Virginia Tech, U.S.A.
Keywords:
Visualization, Dimensionality Reduction, Logistic Regression, Applied Natural Language Processing.
Abstract:
The software, Andromeda, enables users to explore high-dimensional data using the dimensionality reduction
algorithm Weighted Multidimensional Scaling (WMDS). How data are projected in WMDS is determined by
weights assigned to variables, and with
Andromeda
, the weights are set in response to user interactions. This
work evaluates the impact of such interactions on student insight generation via a large-scale study implemented
in a university introductory statistics course. Insights are analyzed using complexity metrics. This analysis is
extended to compare insight vocabulary to gain an understanding of differences in terminology. Both analyses
are conducted using the same semi-automated method that applies basic natural language processing techniques
and logistic regression modeling. Results show that specific user interactions correlate to differences in the
dimensionality and cardinality of insights. Overall, these results suggest that the interactions available to users
impact their insight generation and therefore impact their learning and analysis process.
1 INTRODUCTION
Visualizations are typically evaluated via task com-
pletion or insight generation. For task-based evalua-
tions, researchers ask analysts to complete a task where
metrics such as analysts’ accuracy and completion
time are measured. For insight-based evaluations, re-
searchers analyze participant-generated insights about
data. While asking analysts to complete a task seems
like a simpler method of evaluating a visualization,
some argue that because visualizations are created to
generate insights into data, then they should be eval-
uated in a similar manner (Card et al., 1999; North,
2006).
Defining “insight” and its “complexity” is beyond
the scope of this paper. Thus, we borrow from previous
work. An insight is defined as “as an individual obser-
vation about the data by the participant” (Saraiya et al.,
2005). We assess the complexity of insights using
three metrics: dimensionality, cardinality, and relation-
ship cardinality (Self et al., 2017; Self et al., 2018).
The dimensionality is the number of variables or at-
tributes explicitly mentioned. The cardinality is the
number of observations explicitly mentioned. Lastly,
relationship cardinality is the number of comparisons
made between variables and/or observations.
Insight complexity metrics are usually calculated
by hand. This imposes analytic limitations. First,
manual calculations require intensive labor. Second,
researcher annotation can be subjective. Third, the
complexity metrics do not describe the difference in
insight vocabulary between visualizations. The in-
sight analysis method in this work builds upon current
insight-based evaluation methods by automatically cal-
culating insight dimensionality, cardinality, and rela-
tionship cardinality. Using applied natural language
processing and logistic regression statistical modeling
for complexity metrics extends naturally to conducting
a keyword analysis on the insights.
Our method for analysis is applied to a large-scale
case study on the insights that students generate us-
ing an interactive dimensionality reduction application
called
Andromeda
. This work addresses the following
research questions and contributions.
Research Questions
1.
How does insight complexity relate to interaction
types available within Andromeda?
2.
How does insight vocabulary relate to interaction
types available within Andromeda?
3.
What does the analysis of insight complexity and
vocabulary portray about student learning with
Andromeda?
158
Taylor, M., Kodali, L., House, L. and North, C.
Evaluating Differences in Insights from Interactive Dimensionality Reduction Visualizations Through Complexity and Vocabular y.
DOI: 10.5220/0011663500003417
In Proceedings of the 18th International Joint Conference on Computer Vision, Imaging and Computer Graphics Theory and Applications (VISIGRAPP 2023) - Volume 3: IVAPP, pages
158-165
ISBN: 978-989-758-634-7; ISSN: 2184-4321
Copyright
c
2023 by SCITEPRESS – Science and Technology Publications, Lda. Under CC license (CC BY-NC-ND 4.0)
Contributions
1.
A novel methodology for insight evaluation using
natural language processing (NLP) techniques.
2.
An evaluation of the relationship between visual
analytics interaction types on insight generation
using the above novel methodology.
2 RELATED WORK
2.1 Insight-Based Visualization
Evaluation
A common way to evaluate a visualization is through
the insights it helps generate. North (2006) postu-
lates that “the purpose of visualization is insight. The
purpose of visualization evaluation is to determine
to what degree visualizations achieve this purpose”
(North, 2006). There exist multiple methodologies to
perform insight-based visualization evaluation.
A popular insight evaluation method commonly
used by visualization researchers is the Saraiya et
al. (2005) characterization which measures an insight’s
degree of directness, correctness, breadth, and depth
(Saraiya et al., 2005). A similar characterization
by North (2006) measures domain value, complex-
ity, depth, subjectivity, unexpectedness, and relevance
(North, 2006). Visualization researchers may apply
these characterizations by manually assigning char-
acteristic values to each insight and comparing these
values within their data analysis. Multiple works con-
tinue to apply and adapt these characterizations. The
O’Brien et al. (2011) characterization also counts met-
rics such as the insights per minute(O’Brien et al.,
2011). The Gomez et al. (2014) characterization
compares insight results with a task-based evaluation
(Gomez et al., 2014). Lastly, the He et al. (2021) char-
acterization also analyzes interaction logs and insight
quality (He et al., 2021). While these works showcase
the effectiveness of applying the Saraiya et al. (2005)
insight characterization, they are dependent on man-
ual insight characterization and do not describe the
difference in the language used in insights between
visualizations. This case study presents work that semi-
automatically analyzes insights by complexity metrics
and vocabulary.
2.2 Andromeda
Andromeda
is an interactive visualization and data
analysis tool that was originally designed to enable
analysts of all skill levels to explore high-dimensional
data (Self et al., 2016; Self et al., 2015). The visualiza-
tion relies on a dimensionality reduction algorithm.
Dimensionality reduction algorithms take in high-
dimensional data as input and outputs low-dimensional
data that is representative of the input data. The low-
dimensional data is usually represented in 2- or 3-
dimensions for visualization purposes.
Andromeda
specifically uses Weighted Multidimensional Scaling
(WMDS) (Kruskal and Wish, 1978). WMDS is a di-
mensionality reduction algorithm that associates each
dimension in the data with a weight that represents the
dimension’s relative importance in the visualization.
With
Andromeda
, users can explore the dimension
(variable) weights and the projections to better under-
stand the high-dimensional data.
Andromeda
is often studied using a dataset describ-
ing animals because analysts do not need any domain
knowledge to understand the dataset. Any future refer-
ence to the Animals dataset is specifically referring to
the dataset created by Xian et al. called Animals with
Attributes 2 (AWA2) (Xian et al., 2019). The follow-
ing section describes the interaction types available
in
Andromeda
using a reduced version of the Animals
dataset as an example. There are three types of inter-
actions in
Andromeda
that enable analysts to explore
high-dimensional data: surface-level interaction, para-
metric interaction, and observation-level interaction.
2.2.1 Surface-Level Interaction
Surface-level interaction (
SLI
) allows users to high-
light one or more data points by clicking or hover-
ing. This interaction enables users to view the data
points’ values without altering the projection or vari-
able weights. Thus,
SLI
does not interact with WMDS.
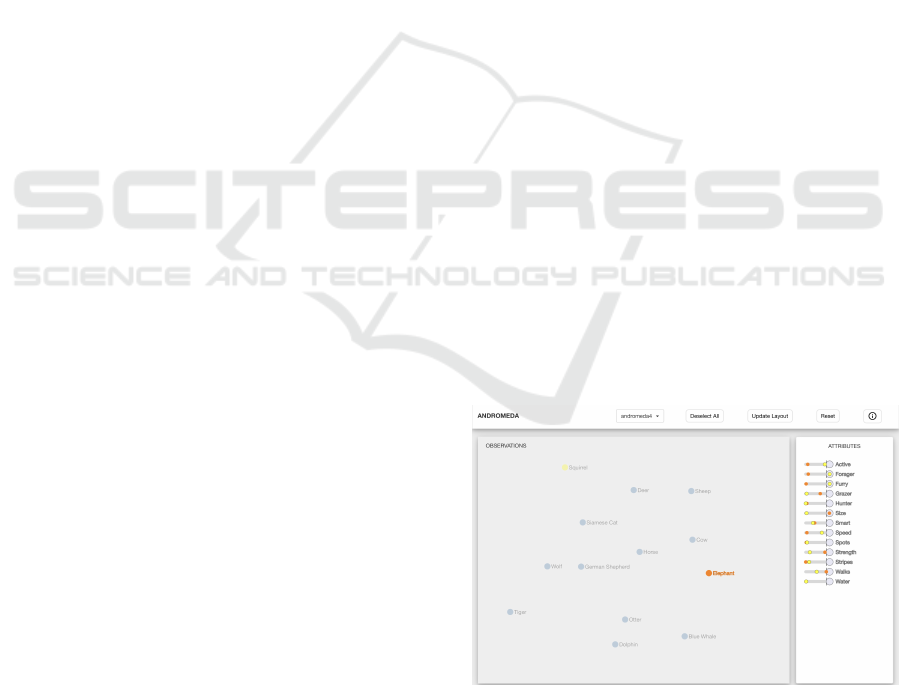
An example is shown in fig. 1.
Figure 1: Surface-level interaction (
SLI
) in
Andromeda
.
This is the initial projection with all variables weighted
equally. Applying
SLI
, the
Elephant
point was clicked,
and the cursor is hovering over
Squirrel
. The attribute, or
feature, values of Elephant and Squirrel are shown on the
right-hand side in orange and yellow, respectively.
SLI
does
not affect the projection nor the variable weights.
Evaluating Differences in Insights from Interactive Dimensionality Reduction Visualizations Through Complexity and Vocabulary
159
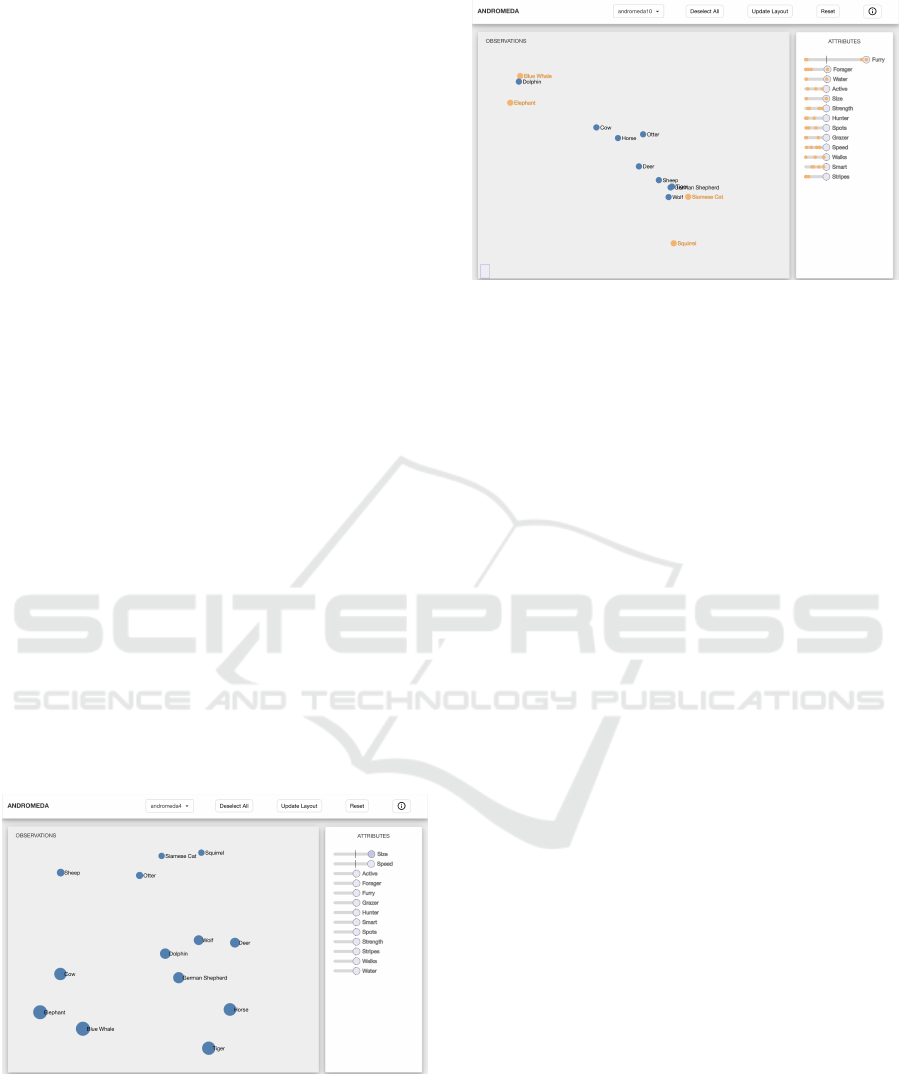
Figure 1 and subsequent
Andromeda
figures are
from the current web-version of
Andromeda
. The
study described in this work used an older version
of
Andromeda
that offered identical functionality with
negligible interface differences.
2.2.2 Parametric Interaction
The second interaction type, Parametric Interaction
(
PI
), allows users to interact with WMDS by changing
variable weights that are represented by sliders. This
assigns different levels of importance to the variables
such that a variable with a greater weight influences
the layout more than a variable with a lesser weight.
Figure 2 shows an example of PI.
2.2.3 Observation-Level Interaction
The final type of interaction is Observation-Level In-
teraction (
OLI
) (Endert et al., 2011).
OLI
allows users
to reposition data points in the layout. This indirectly
communicates variable weight changes via inverse
WMDS (House et al., 2015). After dragging points to
different locations on the projection and clicking the
“Update Layout” button, Andromeda solves for the op-
timal weights that preserve the user-defined projection.
Then, Andromeda updates its display with the new
weights. Figure 3 shows an example usage of OLI.
2.2.4 Studies in Education
Andromeda
was designed to enable data analysts of
all skill levels to explore high-dimensional data (Self
et al., 2015).
Andromeda
is available publicly as a
web application (Andromeda Website, ).
Figure 2: Parametric interaction (
PI
) in Andromeda. The
sliders for
Size
and
Speed
were dragged to the right to
increase their weight. The layout differs from the initial
layout in fig. 1 that relied on equal weights for all variables.
Hovering over the variable
Size
changes the size of the ani-
mal circles to be proportional with the animal’s
Size
value.
Because
Size
and
Speed
have higher weights, animals with
similar
Size
and
Speed
values tend to be projected near
each other such as the Siamese Cat and Squirrel.
Figure 3: Observation-level interaction (
OLI
) in
Andromeda
.
The
Squirrel
and
Siamese Cat
were dragged close to-
gether while the
Elephant
and
Blue Whale
were dragged
close together, but separate from the
Squirrel
and
Siamese Cat
. After clicking the update layout button, the
layout changes by learning variable weights that describe
how the dragged points are similar or dissimilar. These
learned weights are applied to the entire projection. As
shown by the high
Furry
variable weight,
Furry
best de-
scribes how the dragged points relate to each other.
Previous educational studies (Self et al., 2014;
Zeitz et al., 2018) analyzed how college students
performed on a series of data analysis assignments
by manually characterizing insight diversity (Amar
et al., 2005) and complexity. Insight complexity is
measured by dimensionality, cardinality, and relation-
ship cardinality. Results showed that students tended
to think in low dimensions by default. As a result
of using
Andromeda
, students generated insights that
were higher in dimensionality and more complex. The
work presented in this study uses the same measures
of insight complexity using manual calcuations. Semi-
automated metric calculations are described in subsec-
tion 3.2.
3 METHODS
3.1 Experiment Design
The large-scale classroom experiment was conducted
in the undergraduate introductory statistics course at a
university in Spring 2017. The course had a lecture por-
tion and an additional “recitation” section which was
a 50-minute small group section per week. Recitation
sections were on Mondays, Tuesdays, Wednesdays,
or Thursdays. For the study, students used the web-
based version of
Andromeda
. A total of 152 students
participated.
During the lecture portion of the course, all stu-
dents were taught about Weighted Multidimensional
Scaling (WMDS) and Andromeda. Students were able
IVAPP 2023 - 14th International Conference on Information Visualization Theory and Applications
160

to familiarize themselves with
Andromeda
using the
Animals dataset.
Four versions (one version per recitation) of
Andromeda
were given to students during recitation.
Each student was enrolled in a single recitation section.
Data were collected from the students during recita-
tion. The list below describes the different versions of
Andromeda.
1. NONE
: Only has access to surface-level interactions.
Essentially, static WMDS.
2. PI
: Has access to parametric and surface-level in-
teractions.
3. OLI
: Has access to observation-level and surface-
level interactions.
4. BOTH
: Has access to parametric, observation-level,
and surface-level interactions.
These four versions of
Andromeda
were randomly as-
signed to entire recitation groups, with Monday using
PI
(42 students), Tuesday using
NONE
(40 students),
Wednesday using
OLI
(40 students), and Thursday
using BOTH (30 students).
Students completed surveys throughout recitation
where they optionally consented to have their sub-
mission data collected for this study. The data were
collected with approval under IRB #21-911. Students
were asked to write down three insights about the Ani-
mals dataset before and after using their assigned ver-
sion of
Andromeda
. Insights generated before using
their version are called pre-recitation insights, while
insights generated afterward are called post-recitation
insights.
3.2 Insight Analysis Method
The same insight analysis method is used to deter-
mine differences in insight complexity and vocabulary.
The difference in insight complexity is calculated by
measuring differences in dimensionality, cardinality,
and relationship cardinality. The difference in insight
vocabulary is calculated by measuring differences in
word count. See figs. 4 to 6 to follow the cleaning
and vectorization of a single insight. The complexity
metric names have been shortened for presentation.
DIM
,
CARD
, and
REL CARD
are short for dimensionality,
cardinality, and relationship cardinality, respectively.
3.2.1 Clean Insights
The following text cleaning and processing steps are
applied in the context of this study but can be altered
for other datasets and experimental setups as appropri-
ate.
1.
Combine Three Insights. Concatenate each set of
three insights generated by students into a single
response.
2.
Remove Stop Words. Remove unimportant words
such as “the”, “and”, etc. These words are not
important for analysis. The NLTK
1
pre-made stop
word list was used.
3.
Apply Lemmatization. Lemmatization is the natu-
ral language process of grouping forms of a word
into a single word. For example, “changing” and
“changed” are changed to their base form “change”.
Lemmatization was done with the NLTK
1
lemma-
tizer and manual lemmatization was done for any
word forms that the NLTK lemmatizer missed.
4.
Combine
feature
,
attribute
,
variable
into a
Single Keyword. For the purposes of this study,
these words have the same meaning and are used
interchangeably by students. These words are con-
verted into variable.
3.2.2 Vectorize Insights
The cleaned insights are vectorized by calculating the
complexity metrics, counting the number of occur-
rences of each word, and normalizing the values. The
values are normalized so that the output of the logistic
regression models, as described in the next step, have
comparable magnitudes. The vectorization process
can be easily altered for its usage context. Figure 6
shows an example vectorized insights.
The insight metrics are calculated by replacing
instances of observations, variables, and compara-
tive words with their metric name. For the animal
dataset, convert all instances of variable names (such
as
Smelly
and
Size
) into the keyword
DIM
. Convert
all instances of observation names (such as
Giraffe
and
Gorilla
) into the keyword
CARD
. This does not
include group words like
Mammals
. Lastly, any in-
stances of comparative words or phrases like
Similar
or Equal are converted into the keyword REL CARD.
3.2.3 Develop Logistic Regression Model
Consider the following notation to further develop the
methods. Let
x
i
be insight
i
belonging to the set of all
insights
X
that consists of insights collected from two
insight groups. Let
y
i
∈ Y
be a binary indicator for
whether insight
i
belongs to the first or second insight
group to compare. Let
C
be the set of all covariates
to be compared. In this case,
C
consists of the three
“As expected, the bobcat is
larger than the spider monkey.”
Figure 4: An single, example insight referencing the Animals
dataset.
1
Natural Language Toolkit: www.nltk.org
Evaluating Differences in Insights from Interactive Dimensionality Reduction Visualizations Through Complexity and Vocabulary
161

expect
CARD
large
REL CARD CARD
Figure 5: The cleaned version of the insight from fig. 4.
Complexity Metrics Vocabulary
DIM CARD REL CARD expect large ...
0 2 1 1 1 ...
Figure 6: The vectorized version of the insight excerpt from
fig. 4. Because the insight mentioned two animals, its car-
dinality score is two. The values are not normalized. The
ellipsis (...) represents words that would be present in other
insights if this insight were used in a study.
complexity metrics and all unique words present across
all insights. After vectorizing
x
i
, let
x
ic
represent the
value of covariate c in insight i.
A logistic regression model is used as a proba-
bilistic, binary classifier based on observed covariates.
Here, a logistic regression model is used to classify
with probability the group from which insights are col-
lected given metric values and word counts; i.e., to
classify y
i
from x
ic
,
p
ic
=
1 + e
−β
0
−β
1
x
ic
−1
(1)
where
p
ic
represents the probability
y
i
= 1
given
x
ic
.
By fitting this model, the relationship between the
covariate
c
and group assignments is learned. The co-
efficient,
β
1
, reflects the direction and strength of this
relationship. A positive
β
1
indicates that the proba-
bility
y
i
increases with value
x
ic
. A large
β
1
indicates
a large change in probability. Additionally, the
β
1
magnitudes are comparable across models because the
vectorized insights are normalized.
3.2.4 Test Significance of Models
Hypothesis testing is used to determine whether
β
1
is
statistically significant. A two-sided t-test with a type
I error,
α
, set to 0.1 is used. This value is used, as
opposed to 0.05, because of the low cost of type I er-
rors (false positives) in the study. The null hypothesis
is that there is no relationship (
H
0
:
β
1
= 0)
between
element
e
and response
y
. When the p-value of the test
is less than
α
, the null hypothesis is rejected and it is
claimed that there is a relationship between
c
and
y
which supports that the value
c
is a significant word or
metric in the comparison.
Because a logistic regression model is fitted for
each word, there must be a control for multiple testing.
To do so, the Benjamini-Hochberg procedure (Ben-
jamini and Hochberg, 1995) is used. This is arguably
a liberal correction method that is appropriate in the
case of visualization studies where the cost of type I
errors is low. Applying this correction ensures a type I
error of α = 0.1 across all tests.
3.2.5 Identify Significant Keywords
After fitting a logistic regression model for each co-
variate in
C
and applying the Benjamini-Hochberg pro-
cedure, the values with
β
1
coefficients that are statisti-
cally significant are identified. Thus, the final output
is a list of keywords and/or metrics that, univariately,
explain the significant variance between the set of in-
sights X in the comparison.
3.2.6 Application
Our method described in this subsection is used to
identify differences in insight complexity and vocab-
ulary based on binary-labeled data from the study de-
scribed in subsection 3.1. This case study presents
the change in pre- to post-recitation insights for each
version of
Andromeda
as well as the difference in in-
sights between
PI
and
OLI Andromeda
. This compar-
ison was chosen because these versions of represent
each WMDS interaction as opposed to
NONE
(which
is essentially static WMDS) and
BOTH
which contains
both WMDS interactions. For identifying changes
in pre- to post-recitation insights, the insights are la-
beled
y = 1
for pre-recitation insights and
y = 0
for
post-recitation insights. For identifying differences in
insights between interaction types, the post-recitation
insights for each interaction type are labeled
y = 1
for
the first interaction type and y = 0 for the other.
4 RESULTS
4.1 Changes in Insight Complexity
The results of changes in insight complexity are shown
in table 2. The dimensionality of insights consistently
increases across versions of
Andromeda
. This means
that regardless of the interaction types available to
students, they produced insights that described signifi-
cantly more dimensions after recitation. Unexpectedly,
the results are not the same for cardinality and rela-
tionship cardinality. The cardinality of insights did not
significantly increase or decrease throughout recita-
tion. Relationship cardinality significantly decreases
for insights generated using SLI.
4.2 Changes in Insight Vocabulary
The results of changes in insight vocabulary are
shown in table 3. Insights generated using
PI
had
the most keywords identified.
Mammal
,
Far
, and
Would
increased the probability that insights were
pre-recitation while
Variable
,
Weight
,
Increase
,
IVAPP 2023 - 14th International Conference on Information Visualization Theory and Applications
162

and
Lot
increased the probability that insights were
post-recitation. For
NONE
-supported insights, the term
Even
decreases the probability that insights were post-
recitation while
Much
increases it. Lastly, for
OLI
- and
BOTH
-Andromeda, the terms
Variable
and
Weight
resulted in an increase in the probability that insights
were generated post-recitation.
BOTH
also identified
Change
as having this result. For insights generated us-
ing
PI
,
OLI
, and
BOTH
, using
Variable
and
Weight
results in an increased probability that these insights
were generated post-recitation.
4.3 Differences in Parametric and
Observation-Level Interaction
The results on differences in insight vocabulary be-
tween
PI
and
OLI Andromeda
are shown in table 4.
Only post-recitation insights were used for this com-
parison because the intention was to uncover vocabu-
lary differences between insights generated using
PI
and
OLI
. The goal of performing this comparison is
to discover whether students tend to generate different
insights based on access to a single WMDS interac-
tion in
Andromeda
. Insights generated using
PI
are
strongly associated with the dimensionality metric and
the words
Weight
,
Variable
,
Increase
, and
One
.
On the other hand, insights generated using
OLI
tend
to use terms associated with the cardinality metric and
the words Similar, Away, and Far.
Table 1: Descriptive statistics of pre- and post-recitation in-
sight complexity metrics across all versions of
Andromeda
.
Statistic Dimensionality Cardinality Rel. Cardinality
Pre Post Pre Post Pre Post
mean 0.85 2.06 4.84 4.76 3.76 3.48
std 1.53 2.88 3.31 3.17 1.93 2.09
min
0 0 0 0 0 0
max 11 34 19 13 12 11
Table 2: Complexity metric differences between insights gen-
erated pre- and post-recitation with a version of
Andromeda
1
.
Dimensionality
significantly increases across all versions
of Andromeda.
Groups Term Beta Std. Err. Prob. ↑ Signif.
NONE DIMENSIONALITY -1.0116 0.522 Post *
CARDINALITY 0.0083 0.198 Pre
RELATIONSHIP CARDINALITY 0.344 0.206 Pre *
PI DIMENSIONALITY -1.3018 0.282 Post ***
CARDINALITY 0.268 0.184 Pre
RELATIONSHIP CARDINALITY 0.003 0.181 Pre
OLI DIMENSIONALITY -0.445 0.227 Post **
CARDINALITY -0.272 0.193 Post
RELATIONSHIP CARDINALITY 0.179 0.194 Pre
BOTH DIMENSIONALITY -0.6936 0.267 Post ***
CARDINALITY 0.090 0.210 Pre
RELATIONSHIP CARDINALITY 0.042 0.210 Pre
Table 3: Significant keyword differences between in-
sights generated pre- and post-recitation with a version of
Andromeda
1
.
Even
is a significant term when comparing
NONE
insights. An insight is more likely to belong to (Prob.
↑) the Pre-recitation insights if it uses the term Even more.
Groups Term Beta Std. Err. Prob. ↑ Signif.
NONE Even 0.626 0.307 Pre **
Much -0.590 0.353 Post *
PI Mammal 0.441 0.228 Pre *
Far 0.503 0.269 Pre *
Would 0.563 0.309 Pre *
Variable -0.919 0.265 Post ***
Weight -0.484 0.209 Post **
Lot -0.430 0.253 Post *
Increase -0.423 0.242 Post *
OLI Variable -0.710 0.279 Post **
Weight -1.182 0.546 Post **
BOTH Variable -0.649 0.247 Post ***
Weight -0.610 0.253 Post **
Change -0.726 0.392 Post *
Table 4: Significant metric and keyword differences be-
tween insights generated after recitation with
PI
vs.
OLI
Andromeda
1
.
Even
is a significant term when comparing
NONE
insights. An insight is more likely to belong to (Prob.
↑) the Pre-recitation insights if it uses the term Even more.
Groups Term Beta Std. Err. Prob. ↑ Signif.
PI vs. OLI DIMENSIONALITY -0.612 0.213 PI ***
Weight -0.725 0.258 PI ***
Variable -0.619 0.226 PI ***
Increase -0.738 0.371 PI **
One -0.420 0.252 PI *
CARDINALITY 0.536 0.199 OLI ***
Similar 0.521 0.196 OLI ***
Away 0.492 0.253 OLI *
Far 0.609 0.318 OLI *
5 DISCUSSION
5.1 Changes in Insight Complexity
To address the first research question in this study, the
changes in insight complexity are measured per inter-
action type in
Andromeda
. The significant increase
in insight dimensionality shows that students are dis-
cussing more dimensions in their responses. The same
increase does not exist for cardinality and relationship
cardinality. Generally, this means that students insights
are more complex in a consistent manner across ver-
sions, except for those using
NONE
who have decreased
relationship cardinality. These findings suggest that
students are either initially comfortable with cardinal-
ity and relationship cardinality or found these concepts
1
A single asterisk (*) indicates that
p <= 0.1
, a double
asterisk (**) indicates that
p <= 0.05
, and a triple asterisk
(***) indicates that
p <= 0.01
. See subsection 3.2 for an
explanation of how significance is determined.
Evaluating Differences in Insights from Interactive Dimensionality Reduction Visualizations Through Complexity and Vocabulary
163

difficult to understand. Considering that cardinality
and relationship cardinality had averages of 4.84 and
3.76 respectively in the pre-recitation insights, it is
likely that students were initially comfortable with
these concepts. For comparison, dimensionality had
an initial average of 0.85. These results mirror the
findings in (Self et al., 2014; Zeitz et al., 2018) which
were calculated manually.
While dimensionality does significantly increase
across all versions of
Andromeda
, the average dimen-
sionality is only 2.06. This means that insights on
average describe approximately 2 dimensions of the
data. Thus, while dimensionality scores increase, they
do not increase enough such that the average insight
can be considered high-dimensional (
> 2
dimensions).
5.2 Changes in Insight Vocabulary
To address the second research question in this study,
the changes in insight vocabulary are measured per
interaction type in
Andromeda
. Insights generated
with all versions except
NONE
increasingly used the
words
Variable
and
Weight
. These terms are di-
rectly associated with WMDS and their increased us-
age shows that students felt more comfortable with
WMDS concepts at the end of recitation. This learning
was not supported by
NONE
which is expected consider-
ing
NONE
does not support interactive WMDS. Insights
generated with
NONE
do not have any significant in-
crease or decrease in word usage directly related to
the data or
Andromeda
. Upon further investigation, in-
sights using
Even
are using the word within the phrase
“even though” as a way to contradict expectations in
an insight. The word
Much
is used as a comparison
word in phrases like “much more”. This confirms that
even with just
NONE
, there is a difference in insight
vocabulary at the beginning and end of recitation.
5.3 Differences in Parametric and
Observation-Level Interaction
The significant metric and keyword differences be-
tween insights generated using
PI
and
OLI
are re-
ported in table 4. There is a clear dichotomy in the
results comparing PI and OLI.
For the insight complexity metrics, insights gen-
erated using
PI
describe variables more as shown
by the
Dimensionality
results while insights gen-
erated using
OLI
describe observations as shown by
Cardinality
. There is no significant difference in
Relationship Cardinality
between the versions.
There is a similar relationship in the significant key-
word differences. The words associated with an in-
crease in probability that an insight was generated
using
PI
are strongly related to WMDS mechanics.
On the other hand, insights generated using
OLI
are
associated with words that relate to the interpretation
of WMDS and relationships within the data.
5.4 Educational Implications
To address the third research question in this study, the
changes in insight complexity and vocabulary per in-
teraction type are considered in an educational context.
The initial educational goal determines whether the
recitation aided successful learning. Results showed
that insight complexity across
PI
,
OLI
, and
BOTH
Andromeda
improves consistently through increased
dimensionality scores, however cardinality and rela-
tionship cardinality do not significantly change. Also,
the average insight has a dimensionality of about 2
which is lower than hoped for. If the goal was to teach
students to think high-dimensionally and understand
WMDS mechanics, this can be considered a success,
however, there is room for improvement. If the goal
was to teach students to understand the concept of sim-
ilarity and relationships within the data, then the met-
rics show that students did not significantly improve.
Because the
PI
and
OLI
post-recitation insight compar-
ison showed that
OLI
insights had stronger cardinality,
focusing more on
OLI
in the classroom may prove to
increase the cardinality of insights. Given there are
insight differences based on versions of
Andromeda
,
the sequential application of learning objectives may
better suit the learning process.
5.5 Visualization Research Implications
Conducting a vocabulary-based insight analysis pro-
vided further context into the insights that was not
captured by the traditional complexity metrics. As
mentioned, this is the first use of natural language pro-
cessing in insight-based visualization research. NLP
methods are good for providing quick descriptions of
interesting patterns in the data, however, it is not as
in-depth as manual methods. For example, not all re-
sults were immediately understandable and required
researchers to look more deeply into the insights to
gain appropriate context. This may prove to be an
obstacle if participants generate insights using more
open-ended interactions in terms of language. De-
spite this, the insight analysis method used was able
to calculate traditional metrics used in visualization re-
search. These metric results mirrored previous studies
related to
Andromeda
in education. Along with this,
significant terminology used by participants was iden-
tified to provide a fuller understanding of how students
generate insights.
IVAPP 2023 - 14th International Conference on Information Visualization Theory and Applications
164

6 CONCLUSIONS
There exist potential avenues for future work. Quantita-
tively analyzing natural language is faster than manual
annotation and less subject to researcher bias. The
description of insight differences provided by this
study can give researchers a general understanding
of how different visualizations enable insight genera-
tion. When used in combination with insight complex-
ity metrics, the results provide a more holistic view
of participant insights. The insight analysis method
currently only analyzes insights on a per-word basis.
Extending the method to look at phrases, rather than
individual words, may yield interesting results. In this
case, a phrase-based approach may better capture the
idea of groups of points such as “aquatic animals” or
“physical traits”. Within education research, the insight
analysis may also be helpful to develop an automatic
grading scheme of natural language insights.
The presented case study analysis identifies differ-
ences in insight complexity and vocabulary within
Andromeda
. Across all interaction types available
within
Andromeda
, the dimensionality of insights in-
creases with its usage. While the insights see con-
sistent complexity changes, their vocabulary differs
based on the interaction types available. When compar-
ing insights generated with parametric interaction and
observation-level interaction, it is clear that insights
generated with parametric interaction are associated
with WMDS-related terminology, while insights gener-
ated with observation-level interaction tend to describe
WMDS interpretations of relationships in the data. The
analysis method presented in this work can be applied
and improved to further visualization research that
seeks to understand through automated processes.
REFERENCES
Amar, R. A., Eagan, J. R., and Stasko, J. T. (2005). Low-
level components of analytic activity in information
visualization. In INFOVIS.
Andromeda Website. Andromeda: Semantic interaction
for dimension reduction. https://infovis.cs.vt.edu/
andromeda.
Benjamini, Y. and Hochberg, Y. (1995). Controlling the
false discovery rate: A practical and powerful approach
to multiple testing. Journal of the Royal Statistical
Society Series B (Methodological), 57(1):289–300.
Card, S. K., Mackinlay, J. D., and Shneiderman, B., editors
(1999). Readings in Information Visualization: Using
Vision to Think. Morgan Kaufmann Publishers Inc.,
San Francisco, CA, USA.
Endert, A., Han, C., Maiti, D., House, L., Leman, S., and
North, C. (2011). Observation-level interaction with
statistical models for visual analytics. In Visual An-
alytics Science and Technology (VAST) 2011 IEEE
Conference, pages 121–130.
Gomez, S. R., Guo, H., Ziemkiewicz, C., and Laidlaw, D. H.
(2014). An insight- and task-based methodology for
evaluating spatiotemporal visual analytics. In 2014
IEEE Conference on Visual Analytics Science and
Technology (VAST), pages 63–72.
He, C., Micallef, L., He, L., Peddinti, G., Aittokallio, T., and
Jacucci, G. (2021). Characterizing the quality of in-
sight by interactions: A case study. IEEE Transactions
on Visualization & Computer Graphics, 27(08):3410–
3424.
House, L., Leman, S., and Han, C. (2015). Bayesian Visual
Analytics (BaVA). Journal of Statistical Analysis and
Data Mining, 8(2):1–13.
Kruskal, J. and Wish, M. (1978). Multidimensional Scaling.
SAGE Publications, Inc.
North, C. (2006). Toward measuring visualization insight.
IEEE Computer Graphics and Applications, 26(3):6–9.
O’Brien, T., Ritz, A., Raphael, B., and Laidlaw, D. (2011).
Gremlin: An interactive visualization model for ana-
lyzing genomic rearrangements. IEEE transactions on
visualization and computer graphics, 16:918–26.
Saraiya, P., North, C., and Duca, K. (2005). An insight-
based methodology for evaluating bioinformatics vi-
sualizations. IEEE Transactions on Visualization and
Computer Graphics, 11(4):443–456.
Self, J. Z., Dowling, M., Wenskovitch, J., Crandell, I.,
Wang, M., House, L., Leman, S., and North, C. (2018).
Observation-level and parametric interaction for high-
dimensional data analysis. ACM Transactions on Inter-
active Intelligent Systems, 8(2).
Self, J. Z., House, L., Leman, S., and North, C. (2015). An-
dromeda: Observation-level and parametric interaction
for exploratory data analysis. Blacksburg.
Self, J. Z., Hu, X., House, L., Leman, S., and North, C.
(2016). Designing usable interactive visual analytics
tools for dimension reduction. In CHI 2016 Work-
shop on Human-Centered Machine Learning (HCML),
volume May, page 7.
Self, J. Z., Self, N., House, L., Evia, J. R., Leman, S.,
and North, C. (2017). Bringing interactive visual an-
alytics to the classroom for developing eda skills. In
Proceedings of the 33rd Annual Consortium of Com-
puting Sciences in Colleges (CCSC) Eastern Regional
Conference, page 10.
Self, J. Z., Self, N., House, L., Leman, S., and North, C.
(2014). Improving students’ cognitive dimensionality
through education with object-level interaction.
Xian, Y., Lampert, C. H., Schiele, B., and Akata, Z. (2019).
Zero-shot learning—a comprehensive evaluation of
the good, the bad and the ugly. IEEE Transactions on
Pattern Analysis and Machine Intelligence, 41(9):2251–
2265.
Zeitz, J., Self, N., House, L., Evia, J. R., Leman, S., and
North, C. (2018). Bringing interactive visual analytics
to the classroom for developing eda skills. Journal of
Computing Sciences in Colleges, 33(3):115–125.
Evaluating Differences in Insights from Interactive Dimensionality Reduction Visualizations Through Complexity and Vocabulary
165
