
Impact of Body Position on Imaging Ballistocardiographic Signals
Alexander Woyczyk
1 a
and Sebastian Zaunseder
1,2 b
1
Faculty of Information Technology, University of Applied Sciences and Arts Dortmund, Dortmund, Germany
2
Professorship for Diagnostic Sensing, Faculty of Applied Computer Science, University Augsburg, Augsburg, Germany
Keywords:
Imaging Ballistocardiography, Camera Based Monitoring, Physiological Signal Sensing, Heart Rate.
Abstract:
Current works direct at the unobtrusive acquisition of vital parameters from videos. The most common ap-
proach exploits subtle color variations. The analysis of cardiovascular induced motion from videos (imaging
ballistocardiography, iBCG) is another approach that can supplement the analysis of color changes. The
presented study systematically investigates the impact of body position (supine vs. upright) on iBCG. Our
research directs at heart rate estimation by iBCG and on the possibility to analyse ballistocardiographic wave-
forms from iBCG. We use own data from 30 healthy volunteers, who went through repeated orthostatic ma-
neuvers on a tilt table. Processing is done according to common procedures for iBCG processing including
feature tracking, dimensionality reduction and bandpass filtering. Our results indicate that heart rate estima-
tion works well in supine position (root mean square error of heart rate estimation 5.68 beats per minute). The
performance drastically degrades in upright (standing) position (root mean square error of heart rate estima-
tion 21.20 beats per minute). With respect to analysis of beat waveforms, we found large intra-subject and
inter-subject variations. Only in few cases, the resulting waveform closely resembles the ideal ballistocardio-
graphic waveform. Our investigation indicates that the actual position has a large effect on iBCG and should
be considered in algorithmic developments and testing.
1 INTRODUCTION
Within the last decade, the processing of videos for
non-contact acquisition of vital parameters has de-
veloped into a large field of research. Particularly
for cardiovascular and respiratory monitoring, the
technique offers far-reaching opportunities (Molinaro
et al., 2022; Zaunseder et al., 2018; Zaunseder and
Rasche, 2022). Researchers were able to acquire
respiration (van Gastel et al., 2016), oxygen satura-
tion (Moc¸o and Verkruysse, 2021), blood pressure
(BP) (Steinman et al., 2021) and local perfusion dy-
namics (Rasche et al., 2020) from videos. The vast
majority of available works directs at the estimation
of heart rate (HR) or heart rate variability (HRV), re-
spectively. The most common approach to derive HR
or HRV exploits subtle variations in the pixels’ in-
tensity. Such variations reflect the varying light ab-
sorption due to filling of superficial blood vessels.
The similarity to the clinical photoplethysmography
(PPG) led to the name imaging photoplethysmogra-
phy (iPPG).
a
https://orcid.org/0000-0001-6026-8816
b
https://orcid.org/0000-0001-6114-3142
Instead of exploiting intensity variations, Balakr-
ishnan et al. have shown that HR can be determined
by tracking the location of feature points, i.e. not us-
ing intensity changes but exploit macro motion (Bal-
akrishnan et al., 2013). The technique closely relates
to the well known ballistocardiography (BCG) but
uses cameras (in reference to iPPG, we will name it
imaging ballistocardiography (iBCG) from here on).
Besides information on HR, BCG, particularly the
shape of the signal, carries information on other car-
diovascular quantities as cardiac output or ventricular
ejection time, rendering the technique very interest-
ing for cardiovascular monitoring (Inan et al., 2015;
Sadek, 2018). With respect to iBCG, few attention
was spent on a deeper characterization including the
factors influencing iBCG signals and on the possibil-
ities of using iBCG beyond HR.
Our work aims at a deeper characterization of
iBCG. Such investigation is important towards a po-
tential extended usage of iBCG, let it be alone or in
combination with iPPG. This paper presents prelim-
inary investigations on the general usability of iBCG
for HR and morphological analyses using iBCG in de-
pendency of the body position.
The remainder of the work is structured as fol-
Woyczyk, A. and Zaunseder, S.
Impact of Body Position on Imaging Ballistocardiographic Signals.
DOI: 10.5220/0011659900003414
In Proceedings of the 16th International Joint Conference on Biomedical Engineering Systems and Technologies (BIOSTEC 2023) - Volume 4: BIOSIGNALS, pages 55-65
ISBN: 978-989-758-631-6; ISSN: 2184-4305
Copyright
c
2023 by SCITEPRESS – Science and Technology Publications, Lda. Under CC license (CC BY-NC-ND 4.0)
55

lows. First, we provide the background on BCG in
general and present processing approaches for iBCG
in particular. In section 3 we detail the pursued pro-
cessing method and evaluation metrics. In section 4
we present results on the HR estimation by iBCG and
analyse the resulting iBCG morphologies. Finally,
section 5 discusses our findings and relates them to
the literature.
2 BACKGROUND ON
BALLISTOCARDIOGRAPHY
2.1 Physiological Background
BCG describes minor movements of the body caused
by the blood ejection of the heart. It is closely con-
nected to central haemodynamics, as it measures the
effect of the force accelerating the blood from the
heart into the aorta and the subsequent directional
changes of the blood flow. The terminology of the
ballistocardiographic waves was introduced by Starr
et al. and describe the body displacement along the
longitudinal, i.e. head-to-toe axis (Starr, 1958).
Among several small displacements, a healthy
BCG features a prominent movement complex (Fig-
ure 1, points I, J and K), which can be directly as-
sociated with the ejection of blood from the heart
and the following redirection of the blood’s move-
ment as it passes the aortic arch. The I-wave is
the effect of the force opposing the head-ward ac-
celeration of the blood being ejected from the left
ventricle into the aorta. Soon, the main portion of
the blood gets redirected and therefore accelerated in
foot-ward direction by passing through the aortic arch
and entering the abdominal aorta. The deceleration of
the head-ward and redirection to toe-ward movement
causes the J-wave. Lastly the K-wave is supposed to
originate from the deceleration of the blood stream
through the descending aorta. (Pinheiro et al., 2010)
Since the BCG directly originates from the blood
ejection, the acceleration and redirection of blood
flow, it is of high interest to cardiovascular monitor-
ing. The BCG can be used to evaluate various phys-
iological and cardiac parameters, e.g. cardiac output
or BP (Javaid et al., 2016; Su et al., 2019). Because
of its periodicity with each heart beat it is possible to
measure HR and HRV. Since the BCG waves can be
linked to different stages of the cardiovascular cycle,
the analysis of the signals’ shape can yield further in-
formation, e.g. it can serve as an indicator of heart
disease or stenosis within the aorta (Pinheiro et al.,
2010). In combination with other physiological sig-
nals as PPG, the BCG can be used to determine pulse
2
0
-2
axial acceleration
(in mm/s
2
)
0
time in s
1.5
1
0.5
0
ECG
(in mV)
I
J
K
R
Q
S
P
T
Figure 1: Illustration of the acceleration BCG (axial accel-
eration) signal together with the ECG. The BCG waveform
was modified from Pinheiro et al. (Pinheiro et al., 2010).
transit time (PTT). Examining the PTT can lead to
insight on vascular stiffness and is also connected to
BP (Leit
˜
ao et al., 2018; Pielmus et al., 2021).
2.2 Conventional Hardware for
Ballistocardiography
Since early descriptions in the 1940s, there have been
different approaches to record BCG signals. The most
common setup is described by Starr and measures the
BCG along the longitudinal axis of the body. This is
done either standing on modified scales (Inan et al.,
2009) or sitting on a chair with piezoelectric sen-
sors (Alamets
¨
a et al., 2004). Another common set-
up involves the subjects to lay in weight-sensitive
beds. As the force is recorded along the sagittal
axis (Soames and Atha, 1982), the setup results in a
different BCG morphology. Today, the possibilities
of small scale acceleration sensors and gyroscopes
present in fitness trackers and smart watches allows
to measure BCG under various circumstances (Zhang
et al., 2021; Shin et al., 2022). The usage of videos
is yet another possibility to carry out BCG, which has
gained importance in recent years.
2.3 Imaging Ballistocardiography
A fundamental work on BCG measurement from
video sequences was presented by Balakrishnan et
al. (Balakrishnan et al., 2013). The core idea is to
use prominent features in the face area to estimate ax-
ial displacement caused by the ejection of blood from
the heart. Prominent features are typically pixels with
high image gradient as corners or edges and are iden-
tified in the first frame. By using the Kanade-Lucas-
Tomasi (KLT) algorithm each feature’s new location
can be retrieved in the consecutive frames (Tomasi
and Kanade, 1991). The vertical motion trajectories
BIOSIGNALS 2023 - 16th International Conference on Bio-inspired Systems and Signal Processing
56

of several feature points are then used as input sources
for principal component analysis (PCA). In order to
determine the heart rate, Balakrishnan et al. select the
component with the highest periodicity among the de-
composed signals (Balakrishnan et al., 2013).
Shao et al. use a similar set-up, capturing the
face with a camera (Shao et al., 2017). Instead of
automatically searching for feature points, they man-
ually label prominent characteristics as moles, hair
or skin pigmentation and identify corner features us-
ing ”Good features to track” (Jianbo Shi and Tomasi,
1994). Those features are tracked using KLT and the
vertical trajectories are averaged over all features.
Hassan et al. also use KLT to track points within
the face (Hassan et al., 2017). Their selection of face
features consists of 32 points, horizontally aligned on
the forehead and another set of 16 feature points ver-
tically aligned on the nose ridge. The initial positions
are determined by using coordinates relative to a face
bounding box originating from the Viola-Jones face
detector (Viola and Jones, 2001). Using PCA they
deconstruct the multivariate signal into its main com-
ponents and evaluate the distribution of the main fre-
quency of each component in order to estimate the
HR.
Li et al. instead mount the camera onto the head
of their subjects (Li et al., 2020). Being able to use
the whole field of view (FOV) there is a higher prob-
ability of detecting high-quality corner features for
tracking. Similar to Balakrishnan et al. (Balakrish-
nan et al., 2013) they use the KLT tracking algo-
rithm to determine movement of the head by the dis-
placement of prominent features in the subjects FOV.
Using PCA and frequency analysis they estimate the
heart rate as the frequency with the largest amplitude
within the range of 0.75 to 3 Hz.
Lee et al. (Lee et al., 2021) present a fusion ap-
proach of iPPG and iBCG to estimate HR. They use a
deep learning approach, i.e. single shot detector with
ResNet, to detect the face and track 80 points in a re-
duced facial area using the KLT tracker. As before,
the iBCG is then extracted using PCA. Finally, Lee et
al. combine iBCG information with iPPG to yield a
stable HR.
Taken together, the existing approaches except Li
et al. (Li et al., 2020) are closely related. Minor dif-
ferences regarding the area to be considered should
not have a strong impact as commonly facial features,
excluding the eyes, are used. The feature points itself
are typically defined automatically according to the
detection of edges in the image. The further process-
ing is always based on the axial displacement. Dif-
ferences exist regarding additional processing steps,
particularly the usage of PCA or not.
Lastly the presented works differ in their ap-
proaches on estimating the HR from the calculated
iBCG signal, e.g. using the PCA-component with
the clearest main frequency (Balakrishnan et al.,
2013), peak frequency of the Fourier-transformed sig-
nal (Shao et al., 2017; Li et al., 2020; Lee et al., 2021)
or the mean of a normal distribution fitted to a set of
observed peak frequencies (Hassan et al., 2017).
3 MATERIAL AND METHODS
3.1 Dataset
Overview: The used data originates from own
multimodal experiments invoking healthy subjects.
Throughout the experiment, each participant executed
one or two cold stress tests, went through repeated
epochs of paced breathing and repeated orthostatic
maneuvers. During the experiment we recorded mul-
tiple vital signs and three RGB videos. All subjects
gave written consent. The study was approved by the
Ethics Committee at TU Dresden (EK 311082018).
Procedure: The subjects were asked to lay down on a
tilt-table, where they were connected to the measure-
ment systems. Over a duration of approximately 49
minutes the tilt-table was alternated between supine
and upright position every 7 minutes to provoke a car-
diovascular reaction. The position change took ap-
proximately 10 seconds and was executed with the
subject on the table. Each orthostatic maneuver marks
the beginning of a new epoch (supine or upright), re-
sulting in a total of seven epochs for each subject.
Between orthostatic maneuvers, i.e. within each 7
minute epoch, participants had resting phases and ex-
ecuted at least one cold stress test or paced breathing
sequence. During the cold stress test subjects had to
submerge their left hand into a basin of cold water
(1 – 4
◦
C) for a duration of 60 seconds. The paced
breathing exercise consisted of following a rhythm of
8 breath cycles per minute for 60 seconds.
Measurements: During the experiment, we recorded
RGB videos and multiple vital signs. Videos were
recorded with three RGB cameras (UI-3060CP-C-HR
Rev 2 by IDS Imaging Development Systems GmbH;
Obersulm, Germany). All cameras were fixed on a ro-
bust frame joint with the tilt-table and therefore static
in their relative position to the subject even during
tilting, as can be seen in figure 2. For this work,
only Camera 2 is of particular interest. This camera
recorded the subject’s head at a distance of approx-
imately 40 cm. The recorded area covered the head
and a small portion of the shoulders. Videos were
captured at a color depth of 12 bit, a frame rate of
Impact of Body Position on Imaging Ballistocardiographic Signals
57
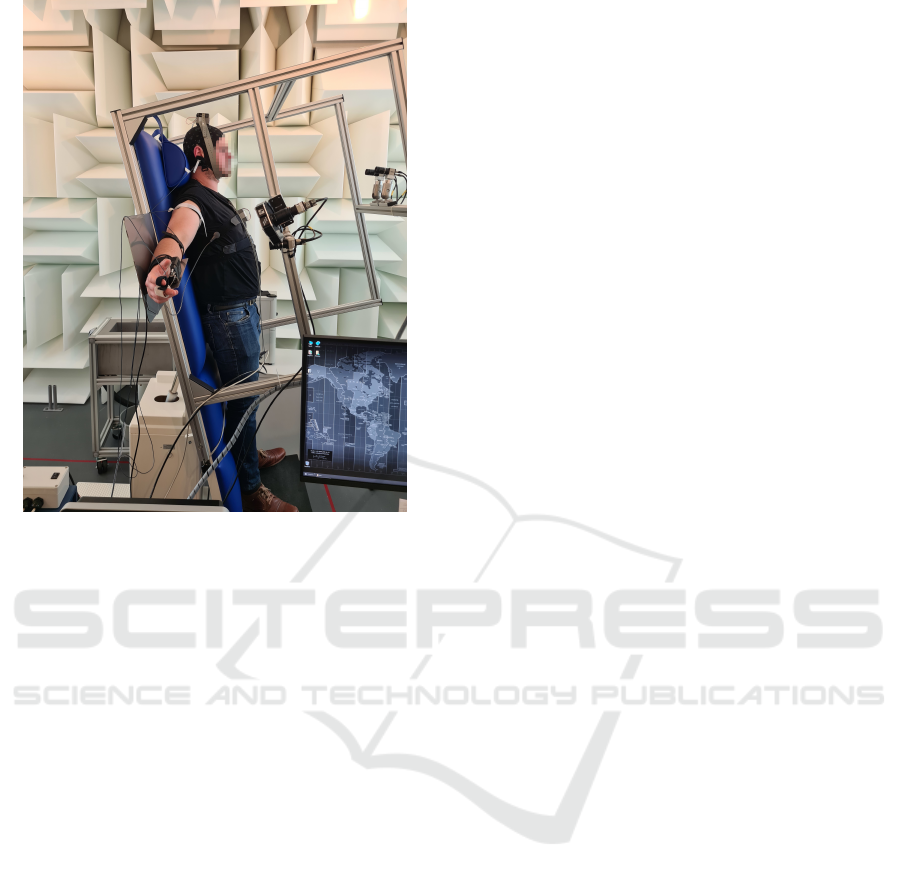
Figure 2: Experiment setup: Subject on tilt table in upright
position. Three cameras were attached to the table’s frame,
additionally ECG, PPG, respiration and BP were recorded.
25 Hz and a spatial resolution of 1280 px × 960 px.
The videos were saved in a proprietary format with
lossless compression. The recordings took place in
a controlled environment using indirect artificial il-
lumination (Walimex pro LED Sirius 160 Daylight
65W by WALSER GmbH & Co. KG; Gersthofen,
Germany).
Several physiological signals were recorded to
serve as reference, namely PPG and respiration
(MP36 by Biopac; Goleta, United States of America)
as well as electrocardiography (ECG) and BP mon-
itoring system (Finapres Nova by Finapres Medical
Systems; Enschede, Netherlands). The signals of par-
ticular relevance for this study were the electrocar-
diogram (Einthoven II) and a finger PPG signal. We
used the PPG signal to assess HR estimation based on
iBCG. We used the ECG signal, particularly the time
instants of QRS complexes, in order to analyse the
waveform from iBCG. Details regarding the handling
of reference signals are given in section 3.3.
Used Data: Overall, we use data of 30 healthy sub-
jects (11 female, 19 male; age 20 – 59). From each
subject we use excerpts from six epochs, three epochs
in supine and three epochs in upright position. Each
excerpt has a length of two minutes. During that time,
subjects were at rest and quiet. There were no further
behavioural advises, still the facial expressions might
vary but we would not expect marked movements.
3.2 Video Processing
As stated before, most works on iBCG share a com-
mon methodology, i.e. using image features within
the face and processing their longitudinal displace-
ment. Following, we present our applied methodol-
ogy, which closely relates to the core procedure and
processing steps of Balakrishnan et al. We also tested
some modifications but we will only briefly discuss
them in section 5.
3.2.1 Tracking Procedure
As first step to capture head movements, we detect fa-
cial landmarks. We use the Viola-Jones face detection
to get a estimate of the faces position and size (Vi-
ola and Jones, 2001). Landmarks are then identified
within the face bounding box and are used to further
refine the region of interest (ROI) in which tracking
points are located. There are 68 landmarks cover-
ing the jaw line, eyes, nose and mouth features. The
landmark detection in use is DLib’s HOG based im-
plementation of Kazemis ”Ensemble of Regression
Trees” (Kazemi and Sullivan, 2014; Dlib C++ Li-
brary, 2020). Instead of searching the whole face for
landmarks, we define a ROI covering an area between
mouth and eyes, i.e. we use landmarks at the in-
ner eye corners, mouth and nose. Within this ROI
we detect up to 60 feature points using the ”Good
features to track” algorithm (Jianbo Shi and Tomasi,
1994). The landmarks and feature points are identi-
fied in the first frame of each epoch’s video segment.
In the consecutive frames we use the KLT tracking
algorithm to calculate the displacement of each fea-
ture points (Tomasi and Kanade, 1991). Figure 3 il-
lustrates the face bounding box, landmark-based ROI
and selected feature points by an example.
3.2.2 iBCG Generation
The iBCG signal is generated by evaluating the tra-
jectories of the recorded feature points. As commonly
done throughout the literature, we used only the lon-
gitudinal axis, i.e. y-component, of each feature point
for signal generation. The further iBCG formation
follows the ideas of Balakrishnan et al. (Balakrish-
nan et al., 2013). We discard feature points with large
displacement in between frames as it indicates either
an unstable feature or possible movement caused by
facial expression. A large displacement is defined as
a displacement that is higher than the mode of max-
imum displacements of each feature. This process-
ing step is supposed to eliminate features which can
pollute the signal with high displacement values and
therefore decrease signal quality. The remaining tra-
BIOSIGNALS 2023 - 16th International Conference on Bio-inspired Systems and Signal Processing
58

jectories are filtered to reduce signal components un-
related to the heart’s beating activity. We use a band-
pass filter with cutoff frequencies at 0.75 and 5 Hz to
cover the signal and its first harmonics, which have
an influence on the signal’s morphology. The result-
ing signals serve as input for PCA. PCA decomposes
the input signals into its main components, i.e. com-
ponents responsible for the most variance in the sig-
nal. The resulting components are then sorted by their
contribution to the signals variance. Finally the most
probable candidate component for iBCG is selected
by choosing the component with the highest periodic-
ity among the first five components.
3.2.3 iBCG Post Processing
The further processing of iBCG signals differs ac-
cording to the aim of the analysis, i.e. HR estimation
or iBCG morphology analysis.
With respect to HR estimation from iBCG, we in-
troduce an additional bandpass filtering step. As done
in comparable works (Balakrishnan et al., 2013; Lee
et al., 2021), we employ a fith-order Butterworth fil-
ter with cutoff frequencies at 0.7 Hz and 2.5 Hz. The
filtered signal is then transformed to the frequency
domain using fast fourier transform (FFT). The FFT
is applied to sliding windows of 10 s at a displace-
ment of 1 s. The location of the highest peak between
40 and 180 Hz in the spectrum of each window yields
the estimated HR. Due to the overlap of the sliding
windows we calculate one HR estimate per second.
Each estimate is compared to a reference HR, which
is derived from the temporally aligned window ap-
plied to the synchronized reference signal (see sec-
tion 3.3.1 for details).
With respect to beat morphology, as not to impact
the waveform, we do not apply additional bandpass
filtering.
3.3 Evaluation
3.3.1 Performance of HR Estimation
We use accuracy, root mean square error (RMSE),
Bland Altman plots and correlation plots to compare
the iBCG approach to a reference HR. The reference
HR is derived from the PPG by the following proce-
dure. First, we detect all beats in the PPG excerpt by
a customized version of L
´
azaro et al. (L
´
azaro et al.,
2013). In accordance to the HR estimation by iBCG,
we then apply a 10 s sliding window with a step size
of 1 s to the detections and derive the reference HR
from the median inter-beat distance in each window.
We then calculate the accuracy of our HR estima-
tion from iBCG signals in reference to the PPG HR.
Figure 3: Exemplary illustration of detected feature points,
which are subsequently tracked. The image shows the
Viola-Jones bounding box (red square), the ROI defined
based on selected relevant facial landmarks (inner red poly-
gon) and the feature points (green dots).
The accuracy is defined as the percentage of the esti-
mated HR (further denoted HR
(Alg)
) within 5 bpm of
the reference HR (further denoted as HR
(Ref)
).
RMSE is defined by
RMSE =
v
u
u
t
∑
N
n=1
HR
(Alg)
n
− HR
(Ref)
n
2
N
(1)
where n denotes a single window (in our case 10 s).
Though evaluating overlapping windows, we con-
sider each estimate equally as HR estimation was
done independently of previously calculated HR es-
timates. All subjects share the same number of win-
dows for each two-minute excerpt thus yielding equal
weight for each subject.
3.3.2 Assessment of Beat Morphology
In accordance to the analysis of BCG signals, our
morphology analysis addresses the shape of iBCG
beats in the second order derivative, i.e. the accel-
eration iBCG signal. In order to analyse the shape,
we construct beat templates for each epoch by group-
ing 10 consecutive beats. To delineate single beats,
we employ the synchronized reference ECG. We first
detect QRS complexes using a customized version
of Pan Tompkins QRS detection algorithm (Pan and
Tompkins, 1985). Based on the occurrence of QRS
complexes, we extract iBCG segments by cutting the
signal midway in between QRS complexes. The sep-
arated segments are then aligned at the QRS complex’
R-peak and a template is generated by averaging the
signals of the iBCG segments. We then further im-
prove the template by correcting small phase delays
(less than 10 ms) utilizing the cross-correlation be-
tween preliminary template and each segment.
Impact of Body Position on Imaging Ballistocardiographic Signals
59

The quantitative evaluation of the waveforms di-
rects at the feasibility of morphological analysis of
iBCG signals and considers three aspects:
1. Beat-to-beat correlation within groups of 10 con-
secutive beats: A high beat-to-beat correlation co-
efficient indicates a stable signal and thus good
signal quality including a prominent iBCG wave.
2. Template-to-template correlation within each
epoch: High correlation coefficients between tem-
plates indicate a reliable signal quality throughout
the epoch. This indicator could serve as decision
criterion for comparing morphological structures
between epochs.
3. Template-to-template correlation between neigh-
bouring epochs: Since epochs alternate between
supine and upright position, low correlation coef-
ficients indicate substantial differences in supine
and upright BCG morphology.
All correlation coefficients were calculated after ac-
counting for small temporal displacements by using
cross-correlation. In addition, for qualitative analyses
we consider exemplary waveforms with respect to the
expectation on a conventional BCG waveform.
3.4 Comparative Method
We also evaluated vertical displacement trajectories
without using PCA, as suggested by Shao et al. (Shao
et al., 2017). We used up to 60 feature points, identi-
fied by the ”Good features to track” algorithm within
a reduced face bounding box, i.e. cropped horizon-
tally by 25 % in order to diminish the possibility
of background within the ROI. Finally we employ
the same bandpass filter (cutoff frequencies 0.75 and
5 Hz) and follow the same post processing steps as
described in section 3.2.
4 RESULTS
4.1 Heart Rate Estimation
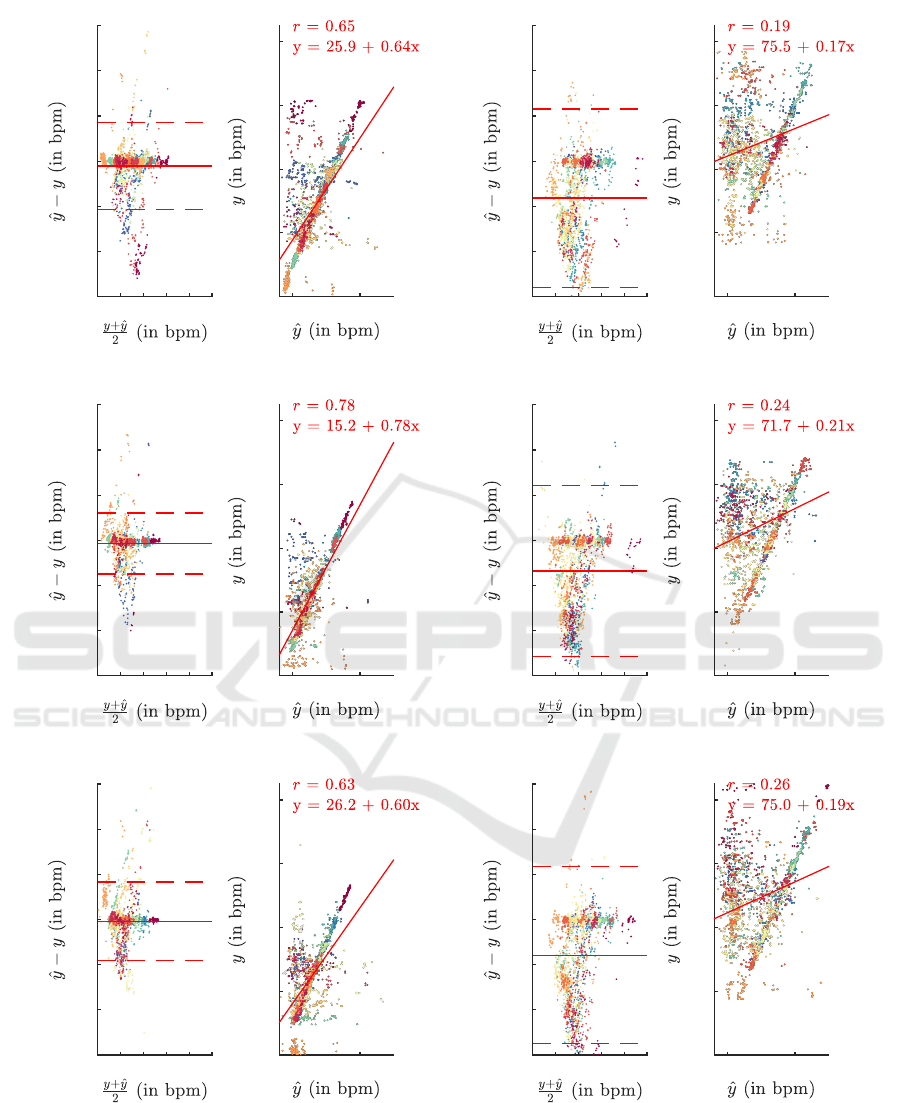
Figure 4 shows the results of the HR estimation for
each epoch. The figure illustrates a pronounced effect
of body position. Similarly, Table 1 shows the RMSE
for all epochs and supports the observation of notable
quality differences between the upright and supine
position. More in detail, Figure 5 shows the accu-
racy per subject and epoch. The graphic illustrates
three findings: firstly, as seen before, supine position
seems to be highly advantageous regarding accurate
HR estimation. Secondly, even on an intra-subject
Table 1: Overall RMSE of estimated HR grouped by body
position (all values in bpm).
Method Position Epochs
PCA supine 5.95 4.94 6.16
upright 21.78 19.40 22.42
without supine 19.97 18.86 17.01
PCA upright 35.49 34.18 37.53
basis the accuracy shows relevant changes between
different epochs of the same position. And thirdly,
some subjects behave markedly worse in most or all
epochs.
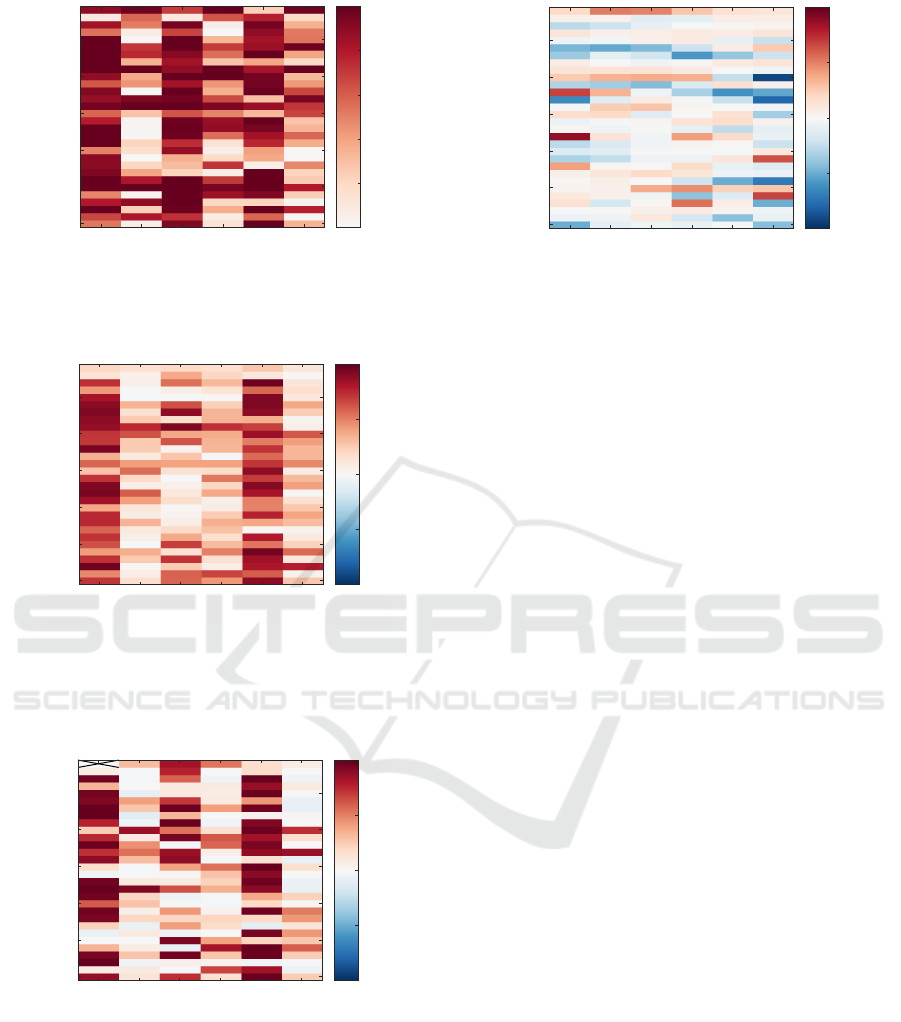
4.2 Beat Morphology Analysis
Figure 6 shows the mean inter-beat correlation coef-
ficient of single beats for each epoch and each sub-
ject. Evaluating the beat-to-beat correlation coeffi-
cient shows a higher value for supine epochs than
those in upright position. This indicates a more
stable beat morphology in supine position. Cre-
ating template beats by grouping several consecu-
tive beats together and then calculating the cross-
correlation of templates within one epoch also sup-
ports our finding supine position being highly benefi-
cial for iBCG recordings. Figure 7 shows for within-
subject comparison mostly a stronger inter-template
cross-correlation in supine epochs than in upright po-
sition. The high correlation demonstrates that the cre-
ated templates are similar throughout the whole epoch
and therefore suitable candidates for advanced BCG
analysis. Also Figure 8 demonstrates a low correla-
tion between templates of neighbouring, i.e. supine
vs. upright, epochs. Thus revealing that there are
substantial differences in templates from supine and
upright recordings.
4.3 Comparative Method
Using the trajectories without further signal decom-
position, i.e. PCA, we observed worse HR esti-
mations, as shown in table 1. Also the templates
generated with this method are less stable, than the
ones produced according to Balakrishnan et al. Even
though the results are inferior, it can still be observed,
that templates generated from epochs in supine body
position tend to be more stable than in upright posi-
tion.
5 DISCUSSION
Our investigations show that HR estimation by iBCG
works well in supine position. Our results are slightly
BIOSIGNALS 2023 - 16th International Conference on Bio-inspired Systems and Signal Processing
60
40 80 120
-60
-40
-20
0
20
40
60
17.24 bpm
-21.47 bpm
-2.12 bpm
50 100
40
60
80
100
120
(a) Results on first supine epoch
40 80 120
-60
-40
-20
0
20
40
60
23.10 bpm
-55.79 bpm
-16.35 bpm
50 100
40
60
80
100
120
(b) Results on first upright epoch
40 80 120
-60
-40
-20
0
20
40
60
12.11 bpm
-14.89 bpm
-1.39 bpm
50 100
40
60
80
100
120
(c) Results on second supine epoch
40 80 120
-60
-40
-20
0
20
40
60
24.32 bpm
-51.42 bpm
-13.55 bpm
50 100
40
60
80
100
120
(d) Results on second upright epoch
40 80 120
-60
-40
-20
0
20
40
60
16.59 bpm
-18.24 bpm
-0.82 bpm
50 100
40
60
80
100
120
(e) Results on third supine epoch
40 80 120
-60
-40
-20
0
20
40
60
23.37 bpm
-55.02 bpm
-15.82 bpm
50 100
40
60
80
100
120
(f) Results on third upright epoch
Figure 4: Bland Altman plots and illustration of correlation for all epochs with y as reference HR and ˆy as estimated HR. Each
point in the plots represents a single 10 s window, each color a subject.
worse than reported in the literature but at an compa-
rable level. E.g. for using iBCG only, Lee et al. report
an RMSE of 3.48 bpm, 5.71 bpm and 15.86 bpm for
resting conditions, facial expressions and movements,
respectively (correlation coefficients are 0.927, 0.920
and 0.051) (Lee et al., 2021). In general, with re-
Impact of Body Position on Imaging Ballistocardiographic Signals
61
supine 1
upright 1
supine 2
upright 2
supine 3
upright 3
5
10
15
20
25
30
subject number
0
0.2
0.4
0.6
0.8
1
Figure 5: Accuracy matrix showing values for all subjects
and epochs. There are distinct differences between supine
and upright epochs in almost all subjects.
supine 1
upright 1
supine 2
upright 2
supine 3
upright 3
5
10
15
20
25
30
subject number
-1
-0.5
0
0.5
1
Figure 6: Mean intra-epoch beat correlation on all consid-
ered subjects and epochs. The matrix shows the averaged
correlation coefficient (after accounting for minor displace-
ment by using cross-correlation) calculated in-between all
beats of an epoch.
supine 1
upright 1
supine 2
upright 2
supine 3
upright 3
5
10
15
20
25
30
subject number
-1
-0.5
0
0.5
1
Figure 7: Inter-template correlation of all considered sub-
jects and epochs. The matrix shows the correlation coef-
ficient (after accounting for minor displacement by using
cross-correlation) between all templates of an epoch.
Due to a delayed start of ECG recording of Subject 1 -
supine 1 only one template could be generated, therefore
no correlation was calculated.
spect to the absolute performance of HR estimation,
we have to emphasize that our work did not foster
an intense optimization, but we adhere to previously
supine 1
upright 1
supine 2
upright 2
supine 3
upright 3
5
10
15
20
25
30
subject number
-1
-0.5
0
0.5
1
Figure 8: Inter-epoch template correlation between neigh-
bouring epochs. The matrix shows the correlation coef-
ficient (after accounting for minor displacement by using
cross-correlation) between all templates of one epoch with
all templates of the neighbouring epochs.
published procedures. We thus believe that the results
from section 4 could be improved, but this is not our
main aim within this work. We consider the found
differences between supine and upright position to be
of greater importance. The body position obviously
has a strong impact on the results as the unsatisfy-
ing performance in upright position clearly demon-
strates. We did consider other methods and feature
points as well, e.g. the method proposed by Shao et
al. (Shao et al., 2017). Shao et al. directly exploited
axial movements without calculating the acceleration
signal. The method thus basically skips some steps of
Balakrishnan et al. (Balakrishnan et al., 2013). How-
ever, using movements directly, our HR estimation
was drastically worse.
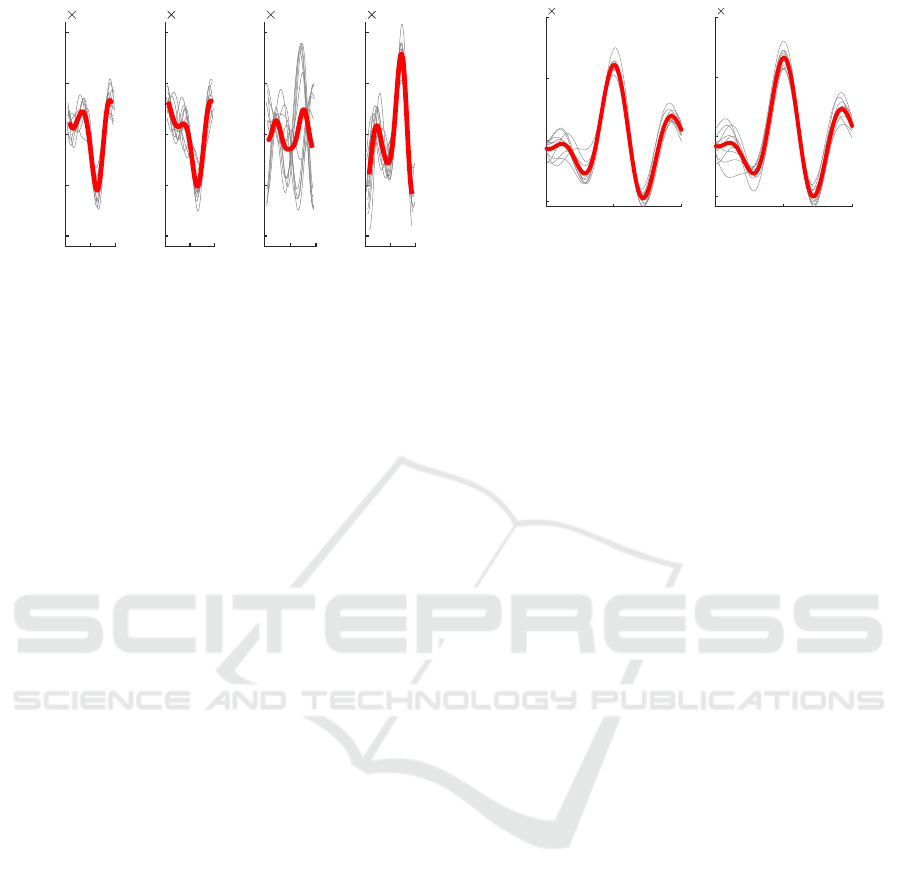
With respect to the signal morphology, our find-
ings indicate the iBCG to be troublesome regardless
of the body position. While in some cases, as dis-
played in Figure 10, we could yield a waveform that
resembles the well known BCG shape, these cases
were the exception rather than the rule. Instead, we
often found periodically varying but heavily distorted
waveforms and large morphological inter-subject and
intra-subject differences, exemplary shown in Fig-
ure 9. This observation coincides with exemplary sig-
nals from most other works, which do not exhibit dis-
tinct BCG characteristics. While a stable waveform
and high correlation to the HR make such segments
very likely to originate from movement induced by
the heart motion, the deformation of the iBCG wave-
form complicate the analysis of BCG specific features
as measuring timings or amplitudes of the BCG com-
plex.
Lastly, we were not able to reproduce the find-
ings of Shao et al., who provide examples of sig-
nal shapes that closely match the conventional BCG
waveform (Shao et al., 2017). One potential reason
BIOSIGNALS 2023 - 16th International Conference on Bio-inspired Systems and Signal Processing
62
Time (s)
Acceleration (a.u.)
0
-2
-1
0
1
2
10
-3
0
-2
-1
0
1
2
10
-3
0
-2
-1
0
1
2
10
-3
0
-2
-1
0
1
2
10
-3
Figure 9: Consecutive templates of varying beats, (subject
11, supine 3). Templates and beats are centered at ECG R-
peak.
might be the size of the observed area: if the spatial
resolution is too small, detailed ballistocardiographic
information might get blurred or lost completely. An-
other reason could be the careful manual selection of
a small ROI with a prominent characteristic as em-
ployed by Shao et al. (Shao et al., 2017), which leads
to a higher and more distinct waveform.
Concerning posture variations, we did expect dif-
ferences and some degradation. Jung et al. describe
a distinct impact of posture on the BCG morphol-
ogy (Jung et al., 2020). Similarly, Shin et al. re-
port relevant variation in BCG morphology between
standing, sitting and supine positions (Shin et al.,
2022). Though both works direct at wrist BCG, fa-
cial iBCG signals can be assumed to be affected by
positional changes and varying support of the head as
well. Against such background, our findings regard-
ing the signals’ shape are reasonable, though the (neg-
ative) effect is more pronounced than we expected.
Again, even with respect to the signals’ shape, we
would not rule out that methodological developments
or different recording parameters, e.g. higher reso-
lution or lower face to camera distance, might im-
prove the results. In fact, as the timing information
from iBCG provides highly relevant information, fu-
ture works should try to enhance and develop methods
towards more reliable iBCG waveforms.
6 CONCLUSIONS
Our analyses show that the body position has a rel-
evant impact on the quality of both, heart rate es-
timation and morphological analysis in iBCG. Such
findings are valuable for future research and develop-
ment, e.g. they indicate that more robust iBCG algo-
rithms should be developed and tested under varying
Time (s)
Acceleration (a.u.)
-0.5 0 0.5
-5
0
5
10
10
-3
-0.5 0 0.5
-5
0
5
10
10
-3
Figure 10: Recognizable BCG morphology (subject 18,
supine 1). Templates and beats are centered at ECG R-peak.
positions. As iBCG carries partially redundant and
partially complementary information to iPPG, iBCG
opens up wide opportunities for sensor data fusion
concepts. Particularly the possibility of constructing
PPG and BCG signals from the same (camera-)source
allows further investigations, as the temporal relation-
ship between heart activity and superficial blood pul-
sation or the possibility to reduce BCG based artefacts
from iPPG. We consider such research and develop-
ment as very interesting (though challenging) as it has
the potential to indirectly improve future applications
of iPPG as BP estimation or skin perfusion imaging.
ACKNOWLEDGEMENT
This work was funded by the Deutsche Forschungs-
gemeinschaft (DFG, German Research Foundation),
project 401786308.
REFERENCES
Alamets
¨
a, J., V
¨
arri, A., Koivuluoma, M., and Barna, L.
(2004). The potential of emfi sensors in heart activ-
ity monitoring.
Balakrishnan, G., Durand, F., and Guttag, J. (2013). Detect-
ing pulse from head motions in video. Proceedings of
the IEEE Computer Society Conference on Computer
Vision and Pattern Recognition, pages 3430–3437.
Dlib C++ Library (2020). Dlib 19.21 Documentation.
Hassan, M. A., Malik, A. S., Fofi, D., Saad, N. M., Ali,
Y. S., and Meriaudeau, F. (2017). Video-based heart-
beat rate measuring method using ballistocardiogra-
phy. IEEE Sensors Journal, 17(14):4544–4557.
Inan, O. T., Etemadi, M., Wiard, R. M., Giovangrandi, L.,
and Kovacs, G. T. A. (2009). Robust ballistocardio-
gram acquisition for home monitoring. Physiological
Measurement, 30(2):169–185.
Inan, O. T., Migeotte, P.-F., Park, K.-S., Etemadi, M.,
Tavakolian, K., Casanella, R., Zanetti, J., Tank, J.,
Funtova, I., Prisk, G. K., and Di Rienzo, M. (2015).
Impact of Body Position on Imaging Ballistocardiographic Signals
63

Ballistocardiography and Seismocardiography: A Re-
view of Recent Advances. IEEE Journal of Biomedi-
cal and Health Informatics, 19(4):1414–1427.
Javaid, A. Q., Ashouri, H., Tridandapani, S., and Inan, O. T.
(2016). Elucidating the hemodynamic origin of bal-
listocardiographic forces: Toward improved monitor-
ing of cardiovascular health at home. IEEE Journal
of Translational Engineering in Health and Medicine,
4:1–8.
Jianbo Shi and Tomasi (1994). Good features to track. In
Proceedings of IEEE Conference on Computer Vision
and Pattern Recognition CVPR-94, pages 593–600.
IEEE Comput. Soc. Press.
Jung, H., Kimball, J., Receveur, T., Agdeppa, E., and
Inan, O. T. (2020). Quantification of Posture-Induced
Changes in Bed-Based Ballistocardiogram. Comput-
ing in Cardiology, 2020-Septe:2020–2023.
Kazemi, V. and Sullivan, J. (2014). One millisecond face
alignment with an ensemble of regression trees. Pro-
ceedings of the IEEE Computer Society Conference
on Computer Vision and Pattern Recognition, pages
1867–1874.
L
´
azaro, J., Gil, E., Vergara, J. M., and Laguna, P. (2013).
Pulse rate variability analysis for discrimination of
sleep-apnea-related decreases in the amplitude fluctu-
ations of pulse photoplethysmographic signal in chil-
dren. IEEE journal of biomedical and health infor-
matics, 18(1):240–246.
Lee, H., Cho, A., and Whang, M. (2021). Fusion Method
to Estimate Heart Rate from Facial Videos Based on
RPPG and RBCG. Sensors, 21(20):6764.
Leit
˜
ao, F., Moreira, E., Alves, F., Lourenc¸o, M., Azevedo,
O., Gaspar, J., and Rocha, L. A. (2018). High-
resolution seismocardiogram acquisition and analysis
system. Sensors, 18(10):3441.
Li, F., Zhao, Y., Kong, L., Dong, L., Liu, M., Hui, M., and
Liu, X. (2020). A camera-based ballistocardiogram
heart rate measurement method. Review of Scientific
Instruments, 91(5).
Moc¸o, A. and Verkruysse, W. (2021). Pulse oximetry based
on photoplethysmography imaging with red and green
light. Journal of Clinical Monitoring and Computing,
35(1):123–133.
Molinaro, N., Schena, E., Silvestri, S., Bonotti, F., Aguzzi,
D., Viola, E., Buccolini, F., and Massaroni, C. (2022).
Contactless Vital Signs Monitoring From Videos
Recorded With Digital Cameras: An Overview. Fron-
tiers in Physiology, 13:160.
Pan, J. and Tompkins, W. J. (1985). A real-time qrs de-
tection algorithm. IEEE transactions on biomedical
engineering, (3):230–236.
Pielmus, A.-G., M
¨
uhlstef, J., Bresch, E., Glos, M., Jun-
gen, C., Mieke, S., Orglmeister, R., Schulze, A., Sten-
der, B., Voigt, V., and Zaunseder, S. (2021). Sur-
rogate based continuous noninvasive blood pressure
measurement. Biomedical Engineering / Biomedi-
zinische Technik, 66(3):231–245.
Pinheiro, E., Postolache, O., and Gir
˜
ao, P. (2010). Theory
and Developments in an Unobtrusive Cardiovascular
System Representation: Ballistocardiography. The
Open Biomedical Engineering Journal, 4(1):201–216.
Rasche, S., Huhle, R., Junghans, E., de Abreu, M. G., Ling,
Y., Trumpp, A., and Zaunseder, S. (2020). Associ-
ation of remote imaging photoplethysmography and
cutaneous perfusion in volunteers. Scientific Reports,
10(1):16464.
Sadek, I. (2018). Ballistocardiogram Signal Processing: A
Literature Review. arXiv preprint arXiv:1807.00951.
Shao, D., Tsow, F., Liu, C., Yang, Y., and Tao, N. (2017).
Simultaneous Monitoring of Ballistocardiogram and
Photoplethysmogram Using a Camera. IEEE Transac-
tions on Biomedical Engineering, 64(5):1003–1010.
Shin, S., Mousavi, A., Lyle, S., Jang, E., Yousefian, P.,
Mukkamala, R., Jang, D. G., Kwon, U. K., Kim, Y. H.,
and Hahn, J. O. (2022). Posture-Dependent Variabil-
ity in Wrist Ballistocardiogram-Photoplethysmogram
Pulse Transit Time: Implication to Cuff-Less Blood
Pressure Tracking. IEEE Transactions on Biomedical
Engineering, 69(1):347–355.
Soames, R. W. and Atha, J. (1982). Three-dimensional
ballistocardiographic responses to changes of pos-
ture. Clinical Physics and Physiological Measure-
ment, 3(3):169–177.
Starr, I. (1958). The relation of the ballistocardiogram to
cardiac function. The American Journal of Cardiol-
ogy, 2(6):737–747.
Steinman, J., Barszczyk, A., Sun, H.-S., Lee, K., and Feng,
Z.-P. (2021). Smartphones and Video Cameras: Fu-
ture Methods for Blood Pressure Measurement. Fron-
tiers in Digital Health, 3.
Su, B. Y., Enayati, M., Ho, K. C., Skubic, M., Despins, L.,
Keller, J., Popescu, M., Guidoboni, G., and Rantz, M.
(2019). Monitoring the relative blood pressure using
a hydraulic bed sensor system. IEEE Transactions on
Biomedical Engineering, 66(3):740–748.
Tomasi, C. and Kanade, T. (1991). Detection and Tracking
of Point Features. Technical report, Carnegie Mellon
University, Pittsburgh, PA.
van Gastel, M., Stuijk, S., and de Haan, G. (2016). Robust
respiration detection from remote photoplethysmog-
raphy. Biomedical Optics Express, 7(12):4941.
Viola, P. and Jones, M. (2001). Rapid object detection us-
ing a boosted cascade of simple features. In Proceed-
ings of the 2001 IEEE Computer Society Conference
on Computer Vision and Pattern Recognition. CVPR
2001, volume 1, pages I–511–I–518. IEEE Comput.
Soc.
Zaunseder, S. and Rasche, S. (2022). Chapter 7 - Clin-
ical applications for imaging photoplethysmography.
In Wang, W. and Wang, X., editors, Contactless Vital
Signs Monitoring, pages 149–164. Academic Press.
Zaunseder, S., Trumpp, A., Wedekind, D., and Malberg,
H. (2018). Cardiovascular assessment by imag-
ing photoplethysmography-a review. Biomedizinische
Technik, 63(5):529–535.
Zhang, Y., Zhang, X., Cui, P., Li, S., and Tang, J. (2021).
Key Feature Selection and Model Analysis for Blood
Pressure Estimation from Electrocardiogram, Ballis-
BIOSIGNALS 2023 - 16th International Conference on Bio-inspired Systems and Signal Processing
64
tocardiogram and Photoplethysmogram. IEEE Ac-
cess, 9:54350–54359.
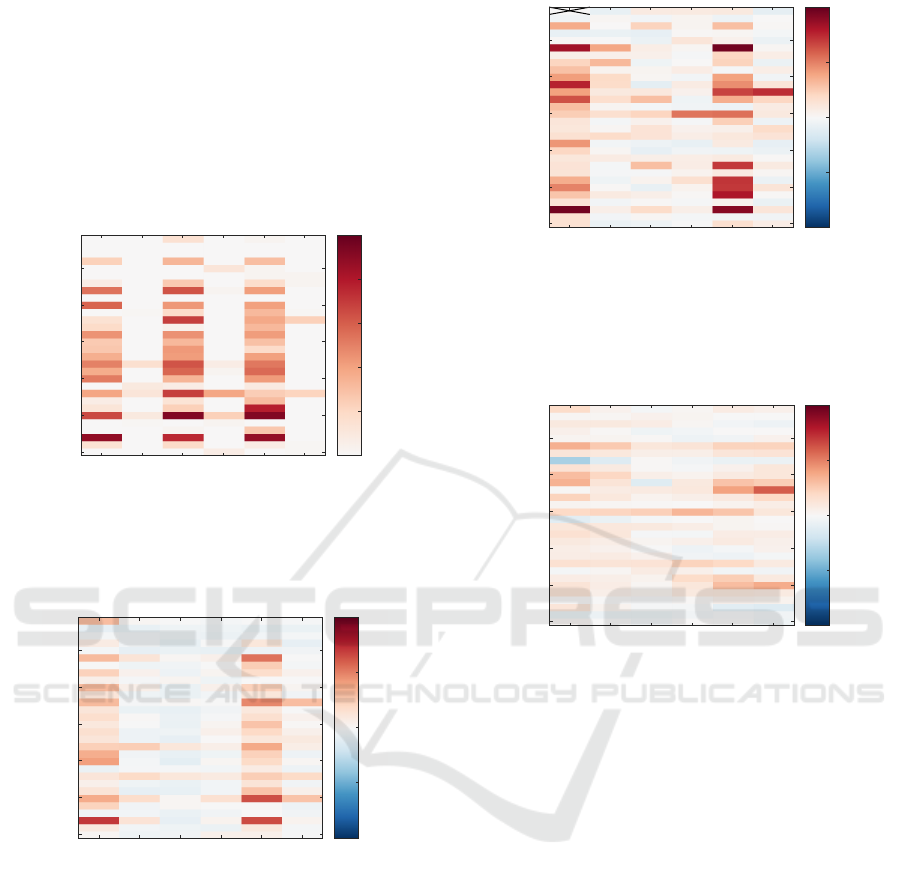
APPENDIX
Accuracy and correlation matrices of the processing
steps without PCA as described in section 3.4 are pre-
sented below.
supine 1
upright 1
supine 2
upright 2
supine 3
upright 3
5
10
15
20
25
30
subject number
0
0.2
0.4
0.6
0.8
1
Figure 11: Without PCA processing: Accuracy matrix
showing values for all subjects and epochs. There are dis-
tinct differences between supine and upright epochs in al-
most all subjects.
supine 1
upright 1
supine 2
upright 2
supine 3
upright 3
5
10
15
20
25
30
subject number
-1
-0.5
0
0.5
1
Figure 12: Without PCA processing: Mean intra-epoch
beat correlation on all considered subjects and epochs. The
matrix shows the averaged correlation coefficient (after ac-
counting for minor displacement by using cross-correlation)
calculated in-between all beats of an epoch.
supine 1
upright 1
supine 2
upright 2
supine 3
upright 3
5
10
15
20
25
30
subject number
-1
-0.5
0
0.5
1
Figure 13: Without PCA processing: Inter-template corre-
lation of all considered subjects and epochs. The matrix
shows the correlation coefficient (after accounting for minor
displacement by using cross-correlation) between all tem-
plates of an epoch.
supine 1
upright 1
supine 2
upright 2
supine 3
upright 3
5
10
15
20
25
30
subject number
-1
-0.5
0
0.5
1
Figure 14: Without PCA processing: Inter-epoch tem-
plate correlation between neighbouring epochs. The ma-
trix shows the correlation coefficient (after accounting for
minor displacement by using cross-correlation) between all
templates of one epoch with all templates of the neighbour-
ing epochs.
Impact of Body Position on Imaging Ballistocardiographic Signals
65
