
Analysis of the User Experience (UX) of Design Interactions for a
Job-Related VR Application
Emanuel Silva
1a
, Iara Margolis
1b
, Miguel Nunes
1c
, Nuno Sousa
1d
,
Eduardo Júlio Marques Nunes
2
and Emanuel Sousa
1e
1
Center for Computer Graphic, Campus de Azurém, Guimarães, Braga, Portugal
2
AEROMEC - Aeródromo Municipal de Cascais, Hangar 6, 2785-632, Tires, São Domingos Rana, Portugal
Keywords: Usability, Intuitive Design, Virtual Reality, Handling, PrEmo, SUS, Design Methodologies.
Abstract: A study was conducted to assess the user experience (UX) of interactions designed for a job-related VR
application. 20 participants performed 5 tasks in the virtual environment, using interactions such as “touching”,
“grabbing”, and “selecting”. UX parameters were assessed through PrEmo, SSQ (Simulator Sickness
Questionnaire) and SUS (System Usability Scale) methods. Overall, participants ended their sessions
demonstrating positive feelings about the application and their performance, in addition to reporting that they
had a positive user experience. Nevertheless, some issues related to ease of learning and satisfaction were
identified. 2 tasks in particular proved difficult for participants to complete. While various data-gathering
methods were used, the present work only focused on analysing the results from the questionnaire tools and
the post-tasks questions. Future work will focus on analysing the data gathered from these other methods, as
well as on using the results from this work to improve the application for future uses.
1 INTRODUCTION
Virtual reality (VR) technology has, for several years,
been considered a promising new medium to provide
users with immersive and engaging virtual
environments. Its use has been extensively proposed
both for entertainment purposes (allowing greater
engagement on alternative realities) and practical
applications, such as flight training (Oberhauser and
Dreyer, 2017) or teleoperation of robotic devices
(Rosen et al., 2018).
VR has also been proposed as a tool for virtual
assembly and rapid prototyping. However, these
kinds of tasks entail particular challenges, most
notably those tasks involving the manipulation of
virtual objects (in itself a technological challenge),
raising issues regarding the usability of the systems.
Mäkinen et al. (2022) point out that analyzing the
user experience (UX) within VR applications allows
for the creation of more comprehensive experiences,
a
https://orcid.org/0000-0002-8498-5278
b
https://orcid.org/0000-0003-1677-6607
c
https://orcid.org/0000-0002-9393-0906
d
https://orcid.org/0000-0002-1728-7939
e
https://orcid.org/0000-0001-5128-5753
among other benefits. The authors point out that
usability and technology adoption are the most
researched points of UX and refer the need for more
UX studies in immersive environments.
Some studies have analysed the usability of VR
systems through self-report tools, such as Butt et al.
(2018) who used the SUS and a faculty-designed
user-reaction survey to measure VR with haptic for
skill acquisition. Kardong-Edgren et al. (2019) also
used the SUS in conjunction with the User Reaction
Survey (URS). Süncksen et al. (2018) used the UEQ
(User Experience Questionnaire) and asked users to
rate the user interface of the application they studied,
in both desktop and VR modes, on a scale from 1 to 6
(best-worst). Bracq et al. (2019) used SSQ, SUS,
NASA Task Load Index, Task-completion time,
UTAUT2 questionnaire, and interviews. Several
different methods have thus been used to analyse and
seek improvements in VR and UX. Still, and as Park
et al. (2018, p. 2) puts it, only “a limited number of
Silva, E., Margolis, I., Nunes, M., Sousa, N., Nunes, E. and Sousa, E.
Analysis of the User Experience (UX) of Design Interactions for a Job-Related VR Application.
DOI: 10.5220/0011657800003417
In Proceedings of the 18th International Joint Conference on Computer Vision, Imaging and Computer Graphics Theory and Applications (VISIGRAPP 2023) - Volume 2: HUCAPP, pages
169-176
ISBN: 978-989-758-634-7; ISSN: 2184-4321
Copyright
c
2023 by SCITEPRESS – Science and Technology Publications, Lda. Under CC license (CC BY-NC-ND 4.0)
169

research used a truly immersive system to examine
the difficulties and benefits of using it (VR systems).”
In a literature review analysis on VR training,
ranging from 1992 to 2019, Abich et al. (2021) point
out that the benefits and problems with VR are
difficult to generalize, but that the training time, the
usability of the VR hardware, and the acquisition of
procedural knowledge, are influencing factors. This
includes retaining and acquiring knowledge and
reducing errors and increasing agility in response
time, which converges to the fact that familiarization
helps performance.
Given the above information, the present work
aims to evaluate the intuitiveness and usability of a
set of basic actions to interact with a VR-based
interface design application, as well as the user’s
experience when interacting with said application.
Fundamentally, it aims to answer the question: How
is the user experience of interactions, designed for
virtual object handling, when applied on a job-related
VR application?
2 USABILITY AND UX
In an analysis of the definition of user experience,
Gómez-López et al. (2019) defined it as a complex
term that describes the relation between the user and
the product, system, or environment under analysis. It
addresses the efficiency and effectiveness of the
interaction as well as the perception and feeling of the
user. To Hassenzahl (2008), UX has a direct link to
usability and user-centred design.
To Nielsen (1993), usability is an attribute to
assess the ease of use of an interface, which also
encompasses the acceptability of the system
regarding the requirements of the user and other
interested parties. This concept is part of a system of
acceptability within a social context. In addition, ISO
9241-210 (2019) defines usability as a measure of
efficiency, effectiveness, and satisfaction, within a
specific context of use. This converges to the
association with usability attributes, namely:
intuitiveness, efficiency, memorization, errors, and
satisfaction (Nielsen and Molich, 1990; Nielsen,
2010a). Nielsen (1993) signalled five major attributes
of usability, namely easy to learn, efficiency to use,
easy to remember, few errors, and subjectively
pleasing. Regarding its evaluation, there are several
types of UX questionnaires available with different
analysis proposals (Hinderks et al. 2019). These are
quantitative tools that measure the user's subjective
attitudes when interacting with the artefact under
analysis.
Furthermore, Tcha-Tokey et al. (2018), in
reference to immersive virtual environments,
identified 9 relevant components of UX, namely: (1)
presence, (2) engagement, (3) immersion, (4) flow,
(5) skill, (6) emotion, (7) usability, (8) technology
adoption judgment and (9) experience consequence.
These components are sometimes interdependent,
which makes their analysis both interesting and
complex. Some examples of this relationship are that
emotions are influenced by presence, flow, and
experience; engagement, in turn, influences
immersion; skill influences both experience
consequence and usability; while presence and
experience consequences influence judgment.
Conversely, ISO 9241-210 (2019) also links
satisfaction with physical, cognitive and emotional
responses.
The search for improving the usability,
effectiveness, efficiency, and satisfaction of an
interface is often a matter of considering both
usability related aspects like the ones mostly
addressed by Nielsen (1993, 2010b) and use-
experience dimensions like the ones address by Tcha-
Tokey et al. (2018) and ISO 9241-210 (2019).
3 RESEARCH METHODOLOGY
This study aims to evaluate the user experience of a
set of basic actions for object handling interactions on
a job-related VR-based interface-design application.
The protocol presented below was split into 6 steps:
(1) Signing of the informed consent form; (2)
Answering a first set of questionnaires on the
computer; (3) VR onboarding (tutorial phase); (4) 5
activities on the VR application (experimental phase),
(5) Final questionnaires on the computer; (6)
Interview.
Technological Instruments
Experiments were conducted using an HTC Vive Pro
VR system, composed of a Vive Pro headset, 2 Vive
base stations 1.0 (placed around the participant to
capture their movements and transpose them to the
VR environment), and 1 Vive controller (which
participants held on their right hand) (HTC
Corporation, n.d.). A GoPro Hero 9 Black camera
was used to capture the participant’s actions and
audio during their session (steps 3 and 4).
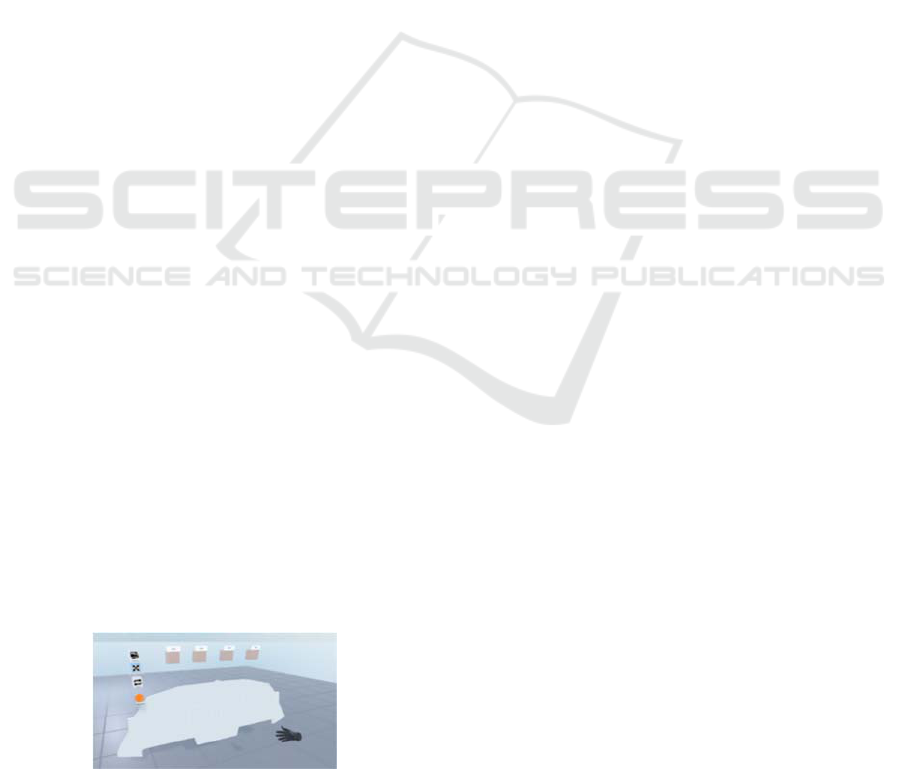
An immersive VR application, which is currently
in development, was used in this study (Figure 1).
Sessions were conducted in a lab room, in a space
isolated from external noise and movement. A
desktop PC was used for participants to fill out the
HUCAPP 2023 - 7th International Conference on Human Computer Interaction Theory and Applications
170
questionnaires. A laptop PC was used by the
researchers to write down notes.
Procedure
Participants were welcomed by the researcher and
introduced to the protocol (6 steps). The main
objectives of the study were presented, and
participants were asked to read and sign the Informed
Consent Form before participating in the session.
Following this, participants were asked to fill in
an initial set of questionnaires, namely (1) a
sociodemographic questionnaire — which included
questions regarding their age, gender, handedness,
previous contact with VR systems, visual
complications, and if they had any difficulties moving
their hands and/or arms (results presented on 3.5) —
(2) the SSQ, the (3) Affinity for Technology
Interaction (ATI) Scale (Franke at al., 2018), and the
(4) PrEmo 2. These questionnaires were filled out on
the desktop PC.
Participants were then taken to the area designated
for VR use, where they were given more details
regarding the procedure and what was asked of them.
They were asked to put on the VR headset, with help
from a researcher, and to grab onto the controller with
their right hand. Following this, the onboarding
(training) application was started, which taught
participants how to perform 3 interactions with the
controller, namely: (1) grabbing objects, by holding
the Trigger button; (2) selecting objects, by pressing
the centre trackpad button while the virtual hand was
not in contact with the virtual object, and keeping it
pressed until they touched the desired object; and (3)
touching objects, by approaching the index finger of
the virtual hand to the desired object, without pressing
any buttons. Participants were asked to practice these
interactions 3 times before continuing.
Pilot tests were conducted to check the
instructions and experimental protocol for errors and
potential improvements during both tutorial and
experimental phases. Nonetheless, the verbal
instructions given during the onboarding segment to
the first 8 participants (S01, E01, S02, E02, S03, S04,
S05 and S06) did not explicitly mention the
interaction that was being taught (grab, select, or
touch), which caused confusion. In their final
Figure 1: Objects and Panel of VR application.
interviews, these participants reported that, during the
onboarding segment, they had not been able to
memorize all the taught interactions. For this reason,
this aspect was changed in this segment, to provide a
clearer understanding to the following participants.
After finishing the tutorial, participants were
loaded into the VR application (mentioned in 3.1). In
it, they found an empty panel, with empty slots (to
which objects are loaded into during Task 1) above it,
and a round button with the “Menu” label (which
would open the menu interface after being touched)
at its side in front of them. Behind them (180º), in
turn, was an image containing all 14 PrEmo stills,
numbered from 1 to 14.
While in this application, participants were asked
to carry out 5 tasks, in order. At the start of each task,
participants were given the goal for that task,
followed by step-by-step instructions on how to do it,
and, lastly, an indication that they could begin. The
instructions, were (translated from Portuguese): (1)
Task 1 - Insert 4 objects into the scenario. To do this,
touch the menu, then touch the gallery icon inside the
menu, then touch each object; (2) Task 2 - Place the
4 objects onto the panel. To do this, grab an object
and drag it over to the panel and place it there; (3)
Task 3 - Organize the panel. To do this, organize the
objects by size, from the smallest to the biggest. Place
the objects as close as possible, on their left side, to
the previous object, and centre the objects with each
other. (4) Task 4 - Switch the 2 bigger-sized objects
with each other. To do this, go to the menu, then touch
the “Switch” (in Portuguese, “Trocar”) icon and
select the 2 bigger-sized objects; (5) Task 5 - Group
2 objects of your choice. To do this, go to the menu,
then touch the “Positioning” (in Portuguese,
“Posicionamento”) icon, select the 2 objects you
want, and move them to another location. Afterwards,
deselect those objects.
After each instruction, participants were asked if
they had any doubts or questions, and if so, these were
answered, before the command to begin the task was
given. After the participant informed that the task was
concluded, or that they wanted to give up, regardless
of whether the task was performed correctly or not,
the following questions were asked (translated from
Portuguese): (1) Do you have any questions about the
activity you just performed? (2) Is there anything
positive or negative about carrying out this activity?
(3) Please turn around from your left side and choose
one or more images that best express what you are
feeling right now. The first two questions were
inspired by Bracq et al. (2019). PrEmo was selected
to be applied between tasks in this VR procedure
because it is easy to fill out, without the user needing
Analysis of the User Experience (UX) of Design Interactions for a Job-Related VR Application
171

to exit the environment every time, it allows assessing
changes in emotions throughout each task, and it is a
quick procedure.
After concluding the 5 tasks, participants removed
the VR headset and were asked to fill out the SSQ,
SUS, UEQ, and PrEmo 2 again, at the desktop PC.
Lastly, a short interview was conducted to collect a
more qualitative and subjective view of the
experiment overall.
Questionnaires
In view of Tcha-Tokey (2018), it is understood that
the use of a single assessment technique can limit the
analysis of an interface, by reducing the number of
dimensions under evaluation. Five self-report
measurement questionnaires were thus used to
analyse complementary dimensions of the user
experience, namely: (1) SSQ (Kennedy et al., 1993),
used to assess the presence of 16 cybersickness
symptoms. The Portuguese version was used
(Carvalho et al., 2011); (2) SUS (Brooke, 1996), used
to assess participant’s perception of the system’s
usability. It was chosen due to the Lewis (2018)’
conclusions regarding the comparison between
methods for perceiving usability. The Portuguese
version was used (Freire, 2021); and (3) PrEmo 2
Tool (Laurans and Desmet, 2017), used to assess
participant’s self-reported emotional feelings towards
each task and towards the experiment overall, using a
pictographic scale.
The complete set of questionnaires used in this
study overall provide: 1) the user's innovative profile;
2) two analyses of usability perception; 3) an
instrument to assess if the use of VR had an impact
on motion sickness; 4) two different perspectives on
usability perception (one more focused on experience
and the other on usability); and, lastly, 5) an
emotional dimension. Some of their results are not
presented in this paper.
Data Analysis
Data analysis of each questionnaire was conducted
according to its references. For the SSQ results were
analysed according to Kennedy et al. (1993). The
parameters from Kennedy et al. (2003) were used for
comparison. The SUS was analysed according to
Brooke (1996), using the analysis parameters
established in Bangor et al. (2009). Additionally, a
stratified analysis of SUS, according to the Nielsen
scale, based on Boucinha and Tarouco (2013) was
also conducted, subdividing the analysis into
satisfaction (questions 1, 4 and 9), ease of
memorization (question 2), ease of learning
(questions 3, 4, 7 and 10), efficiency (questions 5, 6
and 8) and minimization of errors (question 6). In
PrEmo the emotions evoked are counted, according
to Laurans and Desmet (2017).
Analysis was conducted also on the (qualitative)
content of the questions asked between each task, as
well as those asked during the interview. However,
for the present study, the thinking aloud comments,
the timing of each task, and the answers to the final
interview, were not analysed, for the sake of brevity.
Participants
A total of 20 participants (8 female and 12 male), with
ages ranging from 23 to 69 years-old (M = 36.05 ±
SD 13.18) took part in this study. 1 participant was
left-handed, and 2 participants had hand handling
problems (i.e., tendinitis). 8 participants used their
own prescription glasses during the experiment, 8
participants reported no visual issues, 1 participant
reported having colour-blindness, and 1 participant
reported suffering from macular degeneration.
In general, participants were experienced in
playing video games and mobile games, but 7
participants had never used VR. Five participants
considering themselves to be experts regarding
handling VR. These were thus classified as being
experts, identified with “E”, while the remaining
participants who did not consider themselves experts,
or had no prior experience with VR, were identified
as “S”. The ATI Scale pointed to a neutral
technological tendency (between slightly disagree
and slightly agree).
4 RESULTS AND DISCUSSION
Throughout the 5 tasks, it was possible to note a
variation in usability, satisfaction, and efficiency. The
data for this section was gathered from the questions
asked after participants concluded each task, from the
researcher’s observations during participant’s
performance, and from the participant’s “help”
requests. The main problems analysed were: (1)
placing the objects in the slots in Task 1, which
tended to leave participants confused and
commenting that the activity did not make much
sense; (2) the “select objects” interaction, used in
tasks 4 and 5, mainly due to the order of actions
required, which demonstrated it to have a confusing
usability; and (3) the lack of visual feedback when
events occurred, such as when using the switch
function, and when interacting with menu items. The
Table 1 presents the success’ percentage of the tasks,
the number of participants that needed help, and the
total helps that they asked (some participants needed
more than one help in the same task). And finally, the
HUCAPP 2023 - 7th International Conference on Human Computer Interaction Theory and Applications
172
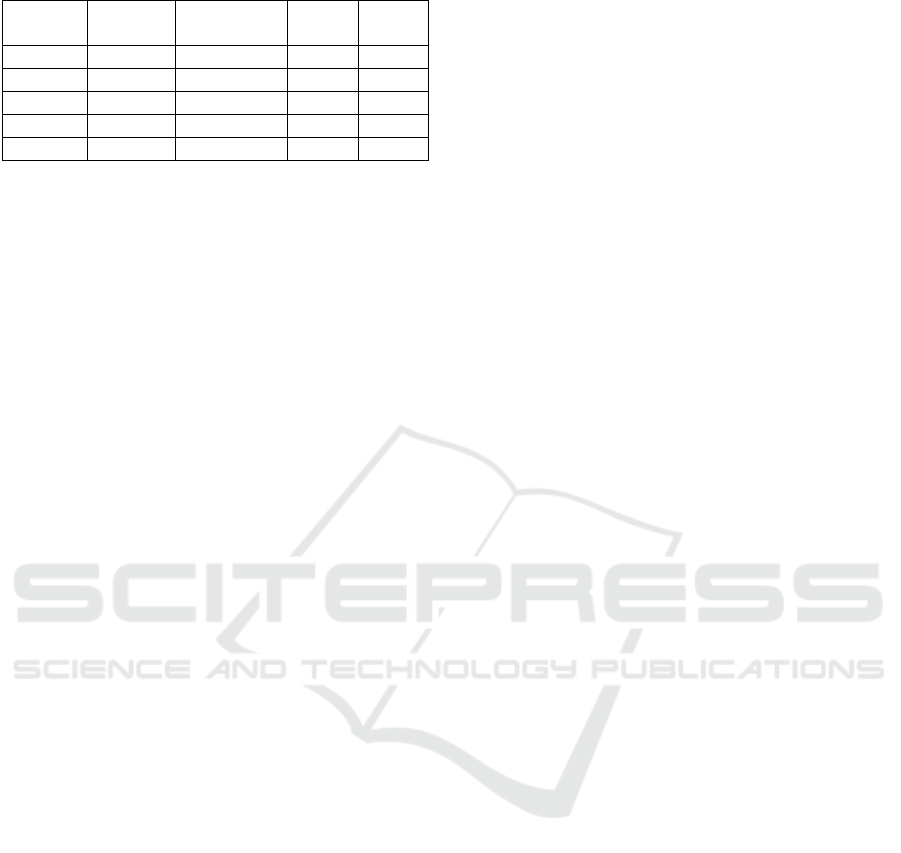
Table 1: Task success and help analysis.
Success
Help/
Participan
t
Total
Help
Gave
up
Task 1 100% 11 14 0
Task 2 100% 2 4 0
Task 3 95% 2 4 0
Task 4 85% 9 16 2
Task 5 75% 6 12 0
number of participants that gave up in each task.
During the course of Task 1, six participants also
completed Task 2 before voicing they had concluded
the task. It is important to highlight that Task 3
contained many instruction details, so, for the
efficiency analysis, scores were only given regarding
the handling of objects on the panel and the placement
of them in ascending order. In Task 4, some
participants changed the object manually instead of
using the switch function, while 9 participants made
the switch with the function and did not realize it,
resulting in a total of 17 more switches. One
participant (S06) made 5 switches using the function,
but ended up giving up on the task, not realizing they
had completed it. S02 stated that “The instantaneous
switching is confusing, ideally, you'd have some
movement, at the same time, even more so since the
objects have the same size, but a different color”.
Lastly, in Task 5, some participants moved the
objects separately, while others still had issues
selecting or deselecting objects.
SSQ
Medium SSQ results at the start of the session was
1.85 (SD = 2.87), and 2.1 (SD = 2.16) at the end of
the session. Seven participants did not present any
change in motion sickness symptoms between the
start and end of the session. Four participants had
their symptoms reduced, and 9 participants had their
symptoms increased, with a maximum of 4
participants having a 2-point increase in SSQ results.
The study was made up of tasks with little movement,
and, in total, lasted between 20 to 40 minutes, so we
can conclude that overall, there was no impact on
motion sickness.
SUS
The SUS had a final score of 68.5, which is above the
minimum acceptable limit, according to Brooke
(1996), and marginally high, according to Bangor et
al. (2009). In Bangor et al. (2009)’s adjective
perspective, SUS, in general, is rated as “Ok”.
When fragmenting the analysis between experts
and participants without VR experience, this scenario
changes. Participants without VR experience had a
general score of 65 (which remains on the high
marginal), but experts had a score of 79, which is
rated as “good” (score between 70 and 79).
Throughout the experiment, it was possible to
note that experts, due to already knowing how a VR
environment worked, were more focused on the
functionality aspects of the application. The
presentation of these results was divided into two
graphics (Figure 2 and 3) for ease of readability. In
both graphics, the acceptability ranges of Bangor et
al. (2009) and Brooke (1996)’s limit of acceptability
have been highlighted. From the perspective of
Bangor et al. (2009), 3 participants (S02, S04, and
S08) had their scores classified as not acceptable, and
5 participants perceived usability in the marginal area
(E01, S03, S06, S07, and S11). In Brooke (1996)’s
parameters, 12 participants (S01, E02, S05, E03, S09,
S10, S12, E04, E05, S13, S14, and S15) perceived the
application as acceptable. It is also possible to see that
a third of the participants that took part in the study
after the changes to the onboarding segment (SUS
Score in dark blue on Figure 2), perceived the
application as having low usability, compared to the
participants before the onboarding changes (SUS
Score in light blue on Figure 2).
In light of Nielsen’s heuristics, difficulties in ease
of learning and satisfaction could be noted (Figure 3).
They were at the marginally acceptable, for Bangor et
al. (2009), and not acceptable, for Brooke (1996).
Nonetheless, all other points were within the
acceptable range according to both authors.
PrEmo 2
Regarding PrEmo 2, it is possible to note a very clear
manifestation of positive emotions. A comparison was
made between the participant’s initial and final state.
There were slight increases in both the positive and
negative emotions (Figure 4). Furthermore, there were
significant changes in “Fascination”, which many
interpreted as “Curiosity”. It was also possible to notice
an increase of “Joy”, “Pride”, “Desire”, and
“Satisfaction” in at least 3 participants. At these stages,
participants were answering the PrEmo using the PC.
Analysis between tasks (Figure 5) was slightly
different. From the general results, a high indication
can be noted on “Fascination” and “Joy”.
“Fascination” has a gradual fall throughout the
activities. It should be noted that many participants
interpreted it as “Curiosity”. “Joy” was stable (with
little variation) except on Task 4, where participants
had more trouble completing the task. The least
indicated emotions were “Fear” and the only emotion
which was never reported was “Disgust”.
“Contempt”, and “Boredom”, were reported only
once each, and “Sadness” was reported 3 times.
Analysis of the User Experience (UX) of Design Interactions for a Job-Related VR Application
173
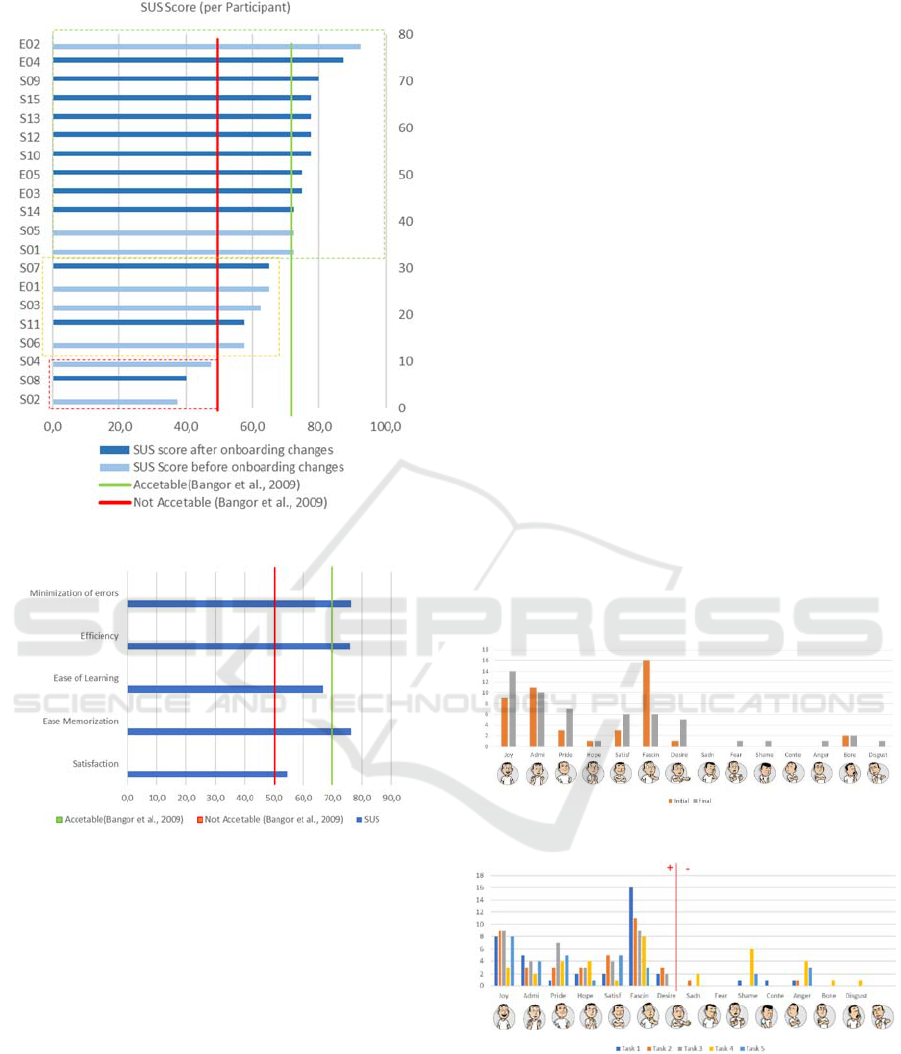
Figure 2: SUS Score per participants.
Figure 3: SUS – stratification.
From the perspective of the Tasks, it is possible to
see that Task 1 was the one in which participants most
reported “Fascination” (which many related with
“Curiosity”) and “Admiration”. It was the only task in
which “Contempt” was reported. 4 negative emotions
(“Disgust”, “Boredom”, “Fear”, and “Sadness”) were
not present in this task. Task 2 was the one in which
“Desire” was reported the most. Task 3 was the one
which generated the highest number of positive
emotions, with 38 reports. It was also the only activity
that didn’t generate any negative emotions. Task 4 was
the one which generated the lowest number of positive
emotions (a total of 22) and the one that generated the
highest number of negative emotions, totalling 14
emotions. Task 5 was the second to last task to trigger
the least number of positive emotions, and the second
to last task to trigger the most negative emotions. It was
also the task with the least number of reports of
“Desire”, “Sadness”, “Fear”, “Contempt”, “Boredom”
and “Disgust”.
It should be noted that all positive emotions were
reported on all tasks, with the exception of “Desire”,
which was not found on tasks which made use of the
select interaction (Tasks 4 and 5). Positive emotions
were reported 6.6 times more often than negative
emotions. Lastly, an analysis was made to the
emotions reported before the onboarding
modification. Significant changes in emotions were
noticeable between the 2 groups. The first group
reported more negative emotions.
Discussion
After analysing all dimensions presented here, it was
possible to note some issues with the application’s
usability, regarding factors of intuitiveness, like
learnability and memorability. These items, alongside
the aspects mentioned by participants in the
interview, converged to the results found on the SUS.
They were also reflected in the results from
PrEmo. This reinforces the relation between the
analysis focused on (1) the use-experience dimension,
as well as the emotional issue analysed in this study
and highlighted by Tcha-Tokey et al. (2018), (2) the
aspects of usability, addressed by Nielsen (1993,
Figure 4: PrEmo results, before and after the experiment.
Figure 5: PrEmo results, per task.
2010b), such as the improvement that must be made
for ease of learning, or (3) the satisfaction, as
addressed by ISO 9241-210 (2019).
Regarding the tasks, the grabbing (Task 2) and
handling objects (Task 3) tasks were considered
intuitive and as having good usability. However, it
HUCAPP 2023 - 7th International Conference on Human Computer Interaction Theory and Applications
174

was possible to note that Task 1 can be simplified and
removed, as its more intuitive to grab objects from the
“gallery” and drag them directly onto the scenario. On
Task 4, it is necessary to improve the feedback
provided when switching the position of objects, as
well as which buttons are associated with this
interaction in the controller itself.
In the usability questionnaires, it was possible to
perceive an “ok” acceptance, in Bangor et al. (2009)
adjective scale, with potential for improvement.
Regarding PrEmo, it was possible to note that
when tasks went very well, such as Task 3, they
generated mostly positive with little to no negative
emotions being reported. However, when tasks
started to present usability issues, negative emotions
were evoked, the main ones being “Shame” and
“Anger”. It was also possible to perceive the
difference in emotions with the changes to the
onboarding segment. This converges to the notes of
Abich et al. (2021), who see training as an important
point in the face of immersive interactions, and as
being quite effective for those who are less familiar
with the training content. Another important factor is
that after failure, and with the acquisition of
knowledge, positive emotions are generated again.
Finally, the importance of an initial training to
create a better experience was evident, as well as that
having a previous experience using VR helps in the
mastery of the interactions used in this study.
Limitation and Future Work
This study had some limitations, namely: (1) the
analysis of interactions was performed outside the
context of a real application, which may cause some
divergencies in their real-world applicability. (2)
problems related to task instruction (Task 3 and Task
5). (3) here, the partial results of the study were
presented, mainly focused on the SSQ, SUS and
PrEmo tools. (4) PrEmo answers between activities
were given orally, which might have led some
participants to be reluctant in sharing their real
emotions. Lastly, (5) this study has the potential to be
used for handling objects in virtual environments, in
work-related settings, so overall interactions may
have to last longer in the immersive universe.
Therefore, the SSQ results might change from those
obtained here with prolonged use of the equipment,
even in the face of an activity without major visual or
physical movements.
There are also recommendations for future work.
In the face of the usability problems that were
encountered, and in search of a better user interaction
with the VR system, as well as given the limitations
exposed in this work, the analysis of all the tools used
in the test. Another suggestion is the improvement of
the onboarding segment, for a re-analysis of the
system. Lastly, for future work, a more in-depth
analysis is suggested to access the effectiveness of
UX methods in VR.
5 CONCLUSIONS
This study analysed the UX of interactions, designed
for virtual object handling, when applied on a job-
related VR application. To this end, several analysis
tools were used, such as SSQ, SUS and PrEmo 2, in
addition to some questions which are made after each
task. The results of the analysis of PrEmo pointed to
a system that generates satisfaction and arouses
positive emotions, but also that still presents some
usability and interaction problems. According to the
SUS results, the developed application is classified in
the adjective rating of “Ok”, or, in the perspective of
acceptability, as marginally high, with need for
improvement in easy to learn and satisfaction. In
PrEmo, it was possible to see changes in emotions
resulting from the mistakes and successes, which
demonstrates the emotional impact on the user
experience. The main point of improvement was
related to the “select” interaction, but other usability
issues were also found, mainly related to
intuitiveness, such as understandability and easy to
learn. Overall, this study was successful in providing
a holistic understanding of the user experience,
encompassing not only usability, but also emotional
aspects of the interaction, an often-neglected
dimension of user-experience.
ACKNOWLEDGEMENTS
This research has been carried out under project
“I2AM - Intelligent Immersive Aircraft
Modification”, funded by the FEDER component of
the European Structural and Investment Funds
through the Operational Competitiveness and
Internationalization Programme (COMPETE 2020)
[Funding Reference: OCI-01-0247-FEDER-070189].
REFERENCES
Abich, J., Parker, J., Murphy, J. S., & Eudy, M. (2021). A
review of the evidence for training effectiveness with
virtual reality technology. Virtual Reality 25, 919–933.
Bangor, A., Kortum, P., & Miller, J. (2009). Determining
What Individual SUS Scores Mean: Adding an
Analysis of the User Experience (UX) of Design Interactions for a Job-Related VR Application
175

Adjective Rating Scale. Journal of Usability Studies,
4(3), pp. 114-123
Bracq, M-S., Michinov, E., Arnaldi, B., Caillaud, B.,
Gibaud, B., Gouranton, V., & Jannin., P. (2019).
Learning procedural skills with a virtual reality
simulator: An acceptability study. Nurse Education
Today, 79, 153-160.
Boucinha, R. M., & Tarouco, L. M. R. (2013). Avaliação
de Ambiente Virtual de Aprendizagem com o uso do
SUS - System Usability Scale. RENOTE, 11(3), 1-10.
Brooke, J. (1996). SUS: A quick and dirty usability scale.
Usability Eval. Ind., 189
Butt, A., S. Kardong-Edgren, &A. Ellertson. (2018). Using
Game-Based Virtual Reality with Haptics for Skill
Acquisition. Clinical Simulation in Nursing 16: 25–32.
Carvalho, M. R.., Costa, R. T., & Nardi, A. E. (2011).
Simulator Sickness Questionnaire: translation and cross-
cultural adaptation. J Bras Psiquiatr., 60(4), 247-52.
Franke, T., Attig, C., & Wessel, D. (2018). A Personal
Resource for Technology Interaction: Development and
Validation of the Affinity for Technology Interaction
(ATI) Scale. International Journal of Human–
Computer Interaction, 35(6), 456-467.
Freire, L. L. (2022). Método Integrado para Avaliação de
Usabilidade em E-Learning [Universidade do Minho].
https://hdl.handle.net/1822/78087
Gómez-López, P., Simarro, F. M., & Bonal, M. T. L.
(2019). Analysing the UX scope through its definitions.
Proceedings of the XX International Conference on
Human Computer Interaction - Interacción ’19.
Hassenzahl, M. (2008). User experience (UX): Towards an
experiential perspective on product quality. ACM
International Conference Proceeding Series 339, 11–15
Hinderks, A., Schrepp, M., Mayo, F. J. D., Escalona, M. J.
E., & Thomaschewski, J. (2019). Developing a UX KPI
based on the user experience questionnaire, Computer
Standards & Interfaces, 65, 38-44.
HTC Corporation. (n.d.). VIVE Pro Full Kit. Retrieved
September 13, 2022, from https://www.vive.com
/us/product/vive-pro-full-kit/
ISO 9241-210 (2019) Ergonomics of human-system
interaction.
Kardong-Edgren, S., K. Breitkreuz, M. Werb, S. Foreman,
and A. Ellertson. (2019). Evaluating the Usability of a
Second Generation Virtual Reality Game for
Refreshing Sterile Urinary Catheterization Skills.
Nurse Educator, 44 (3), 137–141
Kennedy, R. S., Lane, N. E., Berbaum, K. S., & Lilienthal,
M. G. (1993). Simulator Sickness Questionnaire: An
Enhanced Method for Quantifying Simulator Sickness.
The International Journal of Aviation Psychology, 3(3),
203–220.
Kennedy, R., Drexler, J., Compton, D., Stanney, K.,
Lanham, D., & Harm, D. (2003). Configural scoring of
simulator sickness, cybersickness and space adaptation
syndrome: similarities and differences. In Virtual and
adaptive environments: applications, implications, and
human performance issues. (pp. 247–278). CRC Press.
https://doi.org/10.1201/9781410608888.ch12
Laurans, G., & Desmet, P. M. A. (2017). Developing 14
animated characters for non-verbal self-report of
categorical emotions. Journal of Design Research
(Online), 15(3/4), 214–233.
Lewis, J. R. (2018): Measuring Perceived Usability: The
CSUQ, SUS, and UMUX, International Journal of
Human–Computer Interaction, 34(12), 1148–1156.
Mäkinen, H., Haavisto, E., Havola, S., & Koivisto, J.-M.
(2022). User experiences of virtual reality technologies
for healthcare in learning: an integrative review,
Behaviour & Information Technology
, 41(1), 1-17.
Nielsen, J. (1993) Usability Engineering. Academic Press,
Inc., Harcourt Brace & Company, San Diego, USA.
Nielsen, J. (2010a) What is usability? User experience Re-
master, 3-12.
Nielsen, J. (2010b). Ten Usability Heuristics. Useit.com.
Retrieved 29 May 2010. http://www.useit.com/
papers/heuristic/heuristic_list.html
Nielsen, J. & Molich, R. (1990). Heuristic evaluation of
user interfaces. In: SIGCHI conference on human
factors in computing systems. proceedings. ACM.
Oberhauser, M., Dreyer, D. (2017). A virtual reality flight
simulator for human factors engineering. Cogn Tech
Work 19, 263–277
Park, M., Im, H., & Kim, D. Y. (2018). Feasibility and user
experience of virtual reality fashion store. Fashion and
textiles, 5(32), 1-17.
Rosen, E., Whitney, D., Phillips, E., Ullman, D., & Tellex,
S. (2018). Testing robot teleoperation using a virtual
reality interface with ROS reality. In Proceedings of the
1st International Workshop on Virtual, Augmented, and
Mixed Reality for HRI (VAM-HRI) (pp. 1-4).
Süncksen, M., H. Bendig, M. Teistler, M. Wagner, O. Bott,
& K. Dresing. (2018). Gamification and Virtual Reality
for Teaching Mobile X-ray Imaging. In Proceedings of
the 6th IEEE International Conference on Serious
Games and Applications for Health, SeGAH, 1–7.
Vienna: IEEE.
Tcha-Tokey, K., Christmann, O., Loup-Escande, E., Loup,
G., & Richir, S. (2018). Towards a Model of User
Experience in Immersive Virtual Environments.
Advances in Human– Computer Interaction, 2018, 1–
10.
HUCAPP 2023 - 7th International Conference on Human Computer Interaction Theory and Applications
176
