
Experimental Setup and Protocol for Creating an EEG-signal Database
for Emotion Analysis Using Virtual Reality Scenarios
El
´
ıas Marqu
´
es Valderrama
a
, Auxiliadora Sarmiento Vega
b
, Iv
´
an Dur
´
an-D
´
ıaz
c
,
Juan A. Becerra
d
and Irene Fond
´
on Garc
´
ıa
e
Departamento de Teor
´
ıa de la Se
˜
nal y Comunicaciones, Escuela Superior de Ingenier
´
ıa, Universidad de Sevilla,
41092 Seville, Spain
Keywords:
Emotion Induction, Emotion Recognition, Virtual Reality, Electroencephalogram.
Abstract:
Automatic emotion recognition systems aim to identify human emotions from physiological signals, voice,
facial expression or even physical activity. Among these types of signals, the usefulness of signals from elec-
troencephalography (EEG) should be highlighted. However, there are few publicly accessible EEG databases
in which the induction of emotions is performed through virtual reality (VR) scenarios. Recent studies have
shown that VR has great potential to evoke emotions in an effective and natural way within a laboratory en-
vironment. This work describes an experimental setup developed for the acquisition of EEG signals in which
the induction of emotions is performed through a VR environment. Participants are introduced to the VR
environment via head-mounted displays (HMD) and 14-channel EEG signals are collected. The experiments
carried out with 12 participants (5 male and 7 female) are also detailed, with promising results, which allow
us to think about the future development of our own dataset.
1 INTRODUCTION
Emotions play a significant role on the cognitive
processes in human including, motivation, percep-
tion, creativity, attention, memory, reasoning, lear-
ning, problem solving and decision-making (Hosseini
et al., 2015).
There is great interest in developing automatic
systems that are capable of automatically recognizing
the emotion that a subject is feeling by analyzing one
or more parameters, that can range from postural and
gestural characteristics to physiological signals. The
applications of these systems are very varied, ranging
from web site personalization, neuromarketing, edu-
cation and games to health care, especially mental di-
sorders.
The design of systems for automatic emotion
recognition (ER) is a complex problem involving se-
veral areas of knowledge such as artificial intelli-
gence, physiology, psychology, etc.
a
https://orcid.org/0000-0002-9050-0812
b
https://orcid.org/0000-0003-2587-1382
c
https://orcid.org/0000-0002-7206-1203
d
https://orcid.org/0000-0002-4351-7830
e
https://orcid.org/0000-0002-8955-7109
Human emotions involve complex interactions of
subjective feelings, as well as physiological and be-
havioral responses triggered primarily by external
stimuli subjectively perceived as “personally mea-
ningful”. Therefore, the emotions can be analyzed
using different approaches (Tyng et al., 2017): (1)
subjective approaches that assess feelings and subjec-
tive experiences, (2) behavioral responses from facial
expressions (Song, 2021), vocal expressions (Lausen
and Hammerschmidt, 2020) and gestural changes
(Sapi
´
nski et al., 2019) and (3) objective approaches
through different physiological responses that can be
objectively measured by neuroimaging and biosen-
sors.
Physiological responses include the electrical and
hemodynamic activities of the central nervous system
(CNS) which consist of the brain and the spinal cord
(Calvo and D’Mello, 2010) and autonomic nervous
system (ANS) responses, such as heart rate, respira-
tory volume/rate, skin temperature, galvanic skin res-
ponse, cerebral blood flow and electrooculographic
signals (Apicella et al., 2021; Pan et al., 2006). Phy-
siological responses of the CNS and ANS are more
difficult to consciously conceal or manipulate com-
pared to subjective and behavioral responses.
Many ER systems focus on the study of the brain
Valderrama, E., Vega, A., Durán-Díaz, I., Becerra, J. and García, I.
Experimental Setup and Protocol for Creating an EEG-signal Database for Emotion Analysis Using Virtual Reality Scenarios.
DOI: 10.5220/0011656600003417
In Proceedings of the 18th International Joint Conference on Computer Vision, Imaging and Computer Graphics Theory and Applications (VISIGRAPP 2023) - Volume 1: GRAPP, pages
75-86
ISBN: 978-989-758-634-7; ISSN: 2184-4321
Copyright
c
2023 by SCITEPRESS – Science and Technology Publications, Lda. Under CC license (CC BY-NC-ND 4.0)
75

signal since emotions arise from activations of spe-
cialized neuronal populations in several parts of the
cerebral cortex (
ˇ
Simi
´
c et al., 2021). Brain signals can
be measured by various techniques such as Positron
Emission Tomography (PET), Magneto Encephalo-
graphy (MEG), Near Infrared Spectroscopy (NIRS),
Functional Magnetic Resonance Imaging (fMRI),
Event Related Optical Signal (EROS) and Electroen-
cephalogram (EEG), the latter offering the best tem-
poral resolution.
EEG is a method of neurophysiological explo-
ration based on the recording of brain activity through
sensors that translate bioelectrical activity into elec-
trical current. It allows the measurement of voltage
fluctuations resulting from the ionic current of the
post-synaptic potentials of neurons. For the electri-
cal signal to be detectable, a complete set of neurons
must be activated in synchrony to generate a suffi-
ciently strong electric field. EEG-based ER systems
have received wide attention in recent years com-
pared to other physiological measurements because
acquisition of EEG signals can be easily performed
using non-invasive techniques and that EEG signals
are highly sensitive to external stimuli.
To develop an automated system, it is essential to
train the system using a labelled database. To ob-
tain these databases, emotion induction experiments
are used to elicit emotional states to a subject under
controlled conditions in which the subject is evoked
a certain emotion through external stimuli while one
or more signals are recorded. The emotion that is la-
belled to the recorded signals usually corresponds to
the emotion that the subject reports having felt after
the experiment, usually by means of a self-assessment
sheet based on a mannequin or a score.
One of the most important parameters in the ex-
perimental protocol design is the selection of the eli-
citation mechanism. The most common stimuli are
audio-visual type, which consist of listening to sounds
and/or viewing images or films passively. However,
in recent years, several authors have investigated the
use of virtual reality (VR) as a medium to elicit emo-
tions (Ba
˜
nos et al., 2012; Brundage et al., 2016; Riva
et al., 2007). Indeed, recent studies have shown that
VR can enhance the intensity of emotions as well as
the sense of presence compared to non-VR stimuli
(Chirico et al., 2017) and therefore better results can
be achieved in ER systems (Ko et al., 2020; Yokota
and Naruse, 2021) .
VR technology immerses users in three-
dimensional environments in order to provoke a
sense of immersion and presence. This is achieved
through a combination of computer-generated ob-
jects and environments, sounds, haptics, authoring,
interaction and simulation systems. In fact, Head
Mounted Displays (HMD) are becoming increasingly
advanced and accessible, offering more immersive
VR experiences thanks to the representation of high-
quality images and the use of peripherals that allow
freedom of movement in the virtual environment
(Parong et al., 2020).
Immersion and a sense of presence in VR are criti-
cal: users must be able to exclude the physical reality
in order to embrace the digital reality offered to them.
When users have higher levels of presence, they are
more likely to behave in VR similarly to how they
behave in physical reality, blurring the line between
these two realities (Dincelli and Yayla, 2022).VR has
the ability to create experiences that reliably repro-
duce reality or, conversely, experiences outside the
laws of physics by being able to jump through space
and time, endowing users with capabilities such as
flying, breathing underwater, controlling objects re-
motely etc. (Steffen et al., 2019). This provides this
technology with infinite possibilities.
In this study, an experimental setup and a protocol
for the elaboration of a database of EEG recordings
in which VR is used as a medium for emotion induc-
tion is described. This experimental setup is currently
being used to build a sufficiently large database to be
used in the development of automatic emotion recog-
nition systems based on EEG signals.
The rest of the paper is structured as follows.
Section 2 discusses the taxonomy of emotions, giv-
ing some considerations about emotion classification
techniques in Section 3 . It is followed by Section
4, which outlines the methods for emotion induction
while Section 5 presents some EEG databases. Sec-
tion 6 describes the experimental setup, detailing the
hardware and software used as well as the data col-
lection, annotation, pre-processing and export proce-
dures. Finally, Section 7 concludes the paper.
2 TAXONOMY OF EMOTIONS
Several models have been developed to identify
and represent emotions and emotional states, being
the circumplex model proposed by Russell (Russell,
1980) and developed by Russell and Feldman (Feld-
man Barrett and Russell, 1998) the most widely used
for emotion recognition (Maithri et al., 2022). It is
a two-dimensional model based on the valence and
arousal dimensions, in which the emotions are dis-
tributed in a circumference in which the horizontal
axis is the valence (east-west, depending on the de-
gree of pleasure or displeasure) and the vertical is
arousal (north-south, from higher to lower degree of
GRAPP 2023 - 18th International Conference on Computer Graphics Theory and Applications
76

Figure 1: Circumplex model for emotion classification re-
produced from (Maithri et al., 2022).
arousal), as shown in Figure 1. Thus, fear would be
related to a negative emotion with a strong degree of
activation, represented by an angle located in the se-
cond quadrant, much closer to 90º than to 180º. Af-
fective states of moderate intensity can be modeled
with a smaller radius in the model, with a neutral fee-
ling being in the centre.
3 EMOTION RECOGNITION
BASED ON ELECTRO-
ENCEPHALOGRAPHY
EEG-based emotion recognition methods can be clas-
sified into two broad families, methods based on tradi-
tional machine learning and methods employing deep
learning (Liu et al., 2021). The recognition of a un-
derlying emotion is, in other words, a classification
task that needs an operation criteria. For this reason,
there exist different feature extractions approach in-
volved in this problems as the based on time domain
features, which are focused on the waveform (Namazi
et al., 2020), the based on frequency domain trying
to find the spectral components of the signal (Zhou
et al., 2013) or the based on time-frequency domain
responding to the statistical instability of the collected
EEG signals with techniques as the presented in (Gao
et al., 2020). These one typically need a previous
knowledge, in order to select the feature domain that
fits better to the problem that wants to be solved. In-
stead, there is a fourth extraction approach based on
the called deep domain features (Roy et al., 2019),
that relays on the possibility of neuronal networks for
discover and select those features that are more de-
scriptive, loosing their physical meaning. Depend-
ing on the researching environment, the features do-
main selected could differ, taking into account, that
the time or frequency domain features have the capa-
bility of associate the EEG recordings with biolog-
ical responses. This election is independent to the
database and is not unique, that is, a database can be
used with any of these approaches depending on the
objectives of the study.
4 METHODS FOR INDUCING
EMOTIONS
Emotion induction techniques can be classified into
several categories depending on the stimuli used in
the experiments such as audio-visual stimuli, evoking
significant emotional autobiographical memories, or
introducing the subject to predefined situations with
the objective of provoking a certain emotion (Barrett
and Wager, 2006).
Most studies in the literature employ passive
methods when the subject is limited to watching or
listening to certain items selected from standardized
databases. Three of these passive methods are those
using verbal stimuli, music and images, for which
there are a variety of databases related to various emo-
tions.
Verbal stimulus consists of the individual reading
either words or sentences written in the first person,
with happy, sad or neutral emotional content. Cu-
rrently, there are several lists of words classified ac-
cording to dimensions such as affective valence and
activation, which facilitate standardization and ex-
perimental control. The best known at international
level is the Affective norms for English words ANEW
(Bradley and Lang, 1999), a corpus of affective ra-
tings for 1.034 non-contextualized words which has
been expanded and adapted to many languages.
Basic emotions, such as happiness, sadness and
fear can also be evoked with music (Ribeiro et al.,
2019). For example, music composed in a major
mode and with a fast tempo elicits happiness, whereas
music composed in a minor mode and with a slow
tempo elicits sadness. Some audio tracks datasets
annotated with arousal and valence rating are the
MTG-Jamendo (Bogdanov et al., 2019), which is
composed of 18.483 audio tracks, and TROMPA-
MER dataset (G
´
omez-Ca
˜
n
´
on et al., 2022) that con-
tains information from 181 participants, 4.721 anno-
tations, and 1.161 music excerpts.
The most common methods of passive emotion
induction employ imagery. In the literature, there
are different standardized databases, such as the In-
ternational Affective Picture System (IAPS) (Bradley
and Lang, 2017), Nencki Affective Picture System
Experimental Setup and Protocol for Creating an EEG-signal Database for Emotion Analysis Using Virtual Reality Scenarios
77

(NAPS) (Marchewka et al., 2014) and its extension
NAPS BE (Riegel et al., 2016), the Geneva Affective
Picture Data Set (GAPED) (Dan-Glauser and Scherer,
2011) and the Open Affective Standardized Image
Set (OASIS) (Kurdi et al., 2017). Currently, NAPS
consists of more than 1000 color photographic ima-
ges grouped into 20 sets, each with an average of 60
images classified according to the Circumplex two-
dimensional model. GAPED has 730 different ima-
ges rated in terms of arousal and valence within the
range [0, 100] and OASIS contains 900 images rated
in terms of arousal and valence within the range [1, 7].
In contrast to the passive methods described
above, the induction of emotions through VR can be
performed in an active way, which is more realistic
and therefore led to the generation of more intense ex-
periences. Unfortunately, there are currently no stan-
dardized databases of VR environments to our know-
ledge, and therefore researchers need to create their
own virtual experiences or to utilize experiences de-
veloped for other purposes, usually video games.
Some researchers use image databases, such as
the aforementioned IAPS in (Bekele et al., 2017) and
GAPED in (Marcus, 2014), to present images in a vir-
tual environment in a static way, for example as if
they were pictures hanging on the walls of a room.
Also, authors have implemented computer-generated
avatars that reproduce facial expressions to evoke the
emotions (Bekele et al., 2017; Guti
´
errez-Maldonado
et al., 2014). However, the emotional intensity evoked
by these stimuli is expected to be low compared to
other mechanisms more interactive.
Other authors employ immersive virtual experien-
ces with greater dynamism. For example, in (Ce-
beci et al., 2019) authors induced unpleasant emo-
tions through a terror environment and cyber-sickness
through a roller coaster experience, while neutral fee-
lings were related to a campfire environment. Also,
VR games are a great source to create emotional com-
ponents in the subjects, and its capability as an ac-
tive method in ER systems is increasingly gaining
attention among researchers in the field (Meuleman
and Rudrauf, 2021; Mohammadi and Vuilleumier,
2022). Many VR games are readily available on strea-
ming platforms such as Oculus Store for Oculus Rift
(https://www.oculus.com/experiences/rift) and Steam
for HTC Vive (https://store.steampowered.com/).
5 EEG SIGNALS DATASETS
An automated system for EEG-based emotion recog-
nition needs an annotated EEG signals dataset. There
are very few such datasets that are publicly availa-
ble. SEED, DEAP and DREAMER are the most fre-
quently employed, while the new BED has been re-
cently developed.
SEED (SJTU Emotion EEG Dataset) used 15 Chi-
nese film clips as stimuli for emotions. EEG signals
were recorded from 15 participants watching those
clips for 3 times (Duan et al., 2013; Zheng and Lu,
2015).
DEAP (Database for emotion analysis using phy-
siological signals) used 40 music videos, that were
shown to 32 participants while recordings were taken.
Arousal, valence and dominance are provided for
each recording (Koelstra et al., 2012).
DREAMER (Katsigiannis and Ramzan, 2018)
consists of both EEG and electrocardiogram record-
ings from 23 participants. Arousal, dominance, and
valence are available together with self-assessment
(SA).
The BED dataset (Arnau-Gonz
´
alez et al., 2021)
contains EEG recordings from 21 different indivi-
duals when using 12 different stimuli that aim to elicit
concrete affective states, captured over three diffe-
rent recording sessions, each separated in time by one
week. These stimuli include affective images from
the OASIS and GAPED databases.
6 SETUP DESCRIPTION
The acquisition of EEG signals in conjunction with
the induction of emotions with VR is a very com-
plex task, both from the point of view of the inter-
connection of the different devices and of obtaining
signals of sufficient quality due to the potential elec-
tronic noise that the VR headset can introduce in the
signals recorded in the EEG helmet. In this section,
the hardware and software used in the experiments is
detailed as well as the main EEG signal quality pro-
blems encountered in the experiments.
6.1 EEG Signal Acquisition
For EEG signal acquisition, a solution from g.tec
manufacturer was used. That consist of three hard-
ware parts, illustrated in Figure 2 and a software con-
nection through a Matlab script.
The electrodes in the helmet follow the interna-
tional 10/20 system shown in Figure 3, so named
because the electrodes are spaced between 10% and
20% of the total distance between recognizable points
on the skull (frontal (F), parietal (P) occipital (O),
temporal (T) and central (C)) and to the hemisphere
(odd numbers for left, even number for right and Z
for midline). The EEG signal is measured as the dif-
GRAPP 2023 - 18th International Conference on Computer Graphics Theory and Applications
78

ference between the signal from the active electrode
and the reference electrode. A third electrode (ground
electrode) is used to average the voltage difference be-
tween the other two electrodes.
Channels AF3, AF4, F7, F8, F3, F4, FC5, FC6,
T7, T8, P7, P8, O1 and O2 were selected to be
recorded. The ground electrode was allocated at Pz
and the reference was taken from the right ear lobe,
represented as A2. This configuration gets a distri-
bution of information from the frontal, parietal, tem-
poral and occipital lobes, presenting more density in
the frontal lobe. The impedance between the head
scalp and each electrode was reduced by deleting
the air in each location by means of the use of an
electro-conductive gel.
Therefore, each channel was connected to the
g.GAMMAbox (tipped as 2 in Figure 2). This
element handles possible artifacts such as electrode
movements, 60/50Hz interferences produced by the
electrical network, impedance irregularities between
electrodes and skin, and background noise.
Finally, the g.USBamp-Research (tipped as 3 in
Figure 2) performs the sampling task with four pa-
rallel analog to digital converters (ADC). This ele-
ment presents different configurations, regulated by
the oversampling factors in ADC but with a fixed
bandwidth of 2,4576 MHz. After passing this com-
ponent the signal recorded by the personal computer
Figure 2: Hardware consisting on (1) the helmet cap, (2) the
g.GAMMAbox and (3) the g.USBamp-Research.
Figure 3: Helmet scheme following the 20/10 system. The
channel recorded electrodes are filled in red. Ground and
reference electrodes are filled in yellow and blue respec-
tively.
(PC) via USB presented a sampling rate of 256 Hz.
This sampling rate could present small instantaneous
oscillations in some times, so that the time vector is
also stored.
The Matlab script holds the Transmission Control
Protocol (TCP) communication necessary to send the
data recorded by the g.USBamp-Research to any ap-
plication on the PC.
6.2 VR Environment and Headset
The VR environments chosen in this article have been
selected to induce various emotions in a short period
of time. During the experiments, the participants
were invited to get into two environments. The
first one was a tutorial from the Google Earth app
(https://www.oculus.com/experiences/rift/151399530
8673845/) with a duration of about 5 minutes.
The tutorial is divided into a first introductory
video of 1 minute and 33 seconds of length, and
a tutorial for the use of the interactive controls
of between 2 and 3.30 minutes of duration. The
intention of using this tutorial is to familiarize the
subjects with VR technology as well as to drive
to all participants to a common state of calm and
happiness in the arousal-valence plane. This first
introductory stage is recorded in order to provide the
researchers with an initial baseline state. The second
environment projected was the Oculus Dreamdeck
(https://www.oculus.com/experiences/rift/941682542
593981/), a series of short experiences spanning
four scenarios developed with Epic Games’ Unreal
Engine with 3 minutes of duration. The choice of
the Dreamdeck scenario is mainly motivated by two
Experimental Setup and Protocol for Creating an EEG-signal Database for Emotion Analysis Using Virtual Reality Scenarios
79

reasons. Firstly, the recording of EEG signals can be
significantly altered by the subject’s movements, so
it is not recommended that the subject should be able
to move during the recording. Dreamdeck scenarios
do not allow movement beyond head movement so
subjects participating in the experiment do so seated.
In this aspect, it is recommended that participants
do not make sudden head movements and try to
move their heads as little as possible. Secondly, the
intensity with which an emotion is induced is not
homogeneous over the duration of the experience.
If EEG recordings are made over a long period of
time, it may happen that the induced emotion is
sufficiently intense only in a portion of time of the
total recording, being very complicated to select these
portions in the recordings once the experiment has
been carried out. Accordingly, it may be preferable
to have recordings of shorter duration but in which
the intensity and persistence of the induced emotion
is more uniform over the duration of the recording.
In addition, long-term VR experiences can have
undesirable side effects on subjects, such as eye
fatigue, headaches and cybersickness. In this sense,
the duration of the Dreamdeck scenarios, less than
one minute each, is adequate and sufficient to create
the database. Figure 4 shows example images of each
of the scenarios.
The first scenario, called Lowpoly Forest, recre-
ates an animal filled low polygon forest designed in
a very particular artistic style. The colors, the artis-
tic style and the sound invite the participant to a re-
laxed state. In this scenario VR is not used as a tool to
achieve maximum realism, but the artistic style char-
acterized by the lack of geometric details and textures
together with the absence of unexpected events and
shocks makes the user to feel relaxed. The second
(a) Lowpoly Forest. (b) Alien.
(c) Futuristic City. (d) T-Rex.
Figure 4: Dreamdeck scenarios.
scenario puts the subject in front of a nice alien in
some kind of extra-terrestrial world. The alien greets
and speaks in an unknown language and keeps staring
at the subject leading him or her to an excited state.
In this scenario VR is used to create a sense of real-
ism, although the fact of focusing the user in an en-
vironment that is not natural and does not belong to
Earth may shock the user. At the same time, the alien
is very close to the user, hence the user is attentive
to what may happen, since he or she does not under-
stand what the alien is saying and cannot know if it
is a friendly environment or if it is dangerous. The
third scenario places the user on a small ledge above
a striking futuristic urban landscape. It is an impres-
sive scenario that takes the user into a state of surprise.
Although one might think that the height at which the
user is standing might induce fear, in reality the user
is aware that he or she cannot fall, only turn his or her
head and inspect the environment, which is perceived
by the user as a safe environment. Finally, in the last
scenario, the user is confronted with a giant T-rex run-
ning towards him or her, in what looks like a museum.
The T-rex roars and gets dangerously close to the user,
who has nowhere to hide. It then continues on its way
walking over the user, almost about to crush him, and
disappears into the darkness of the corridor. In this
scenario, the user is expected to be taken into a state
of fear. In summary, it was expected the emotions to
induce in each scenario are:
• Relaxed(Lowpoly Forest);
• Excited (Alien);
• Surprised (Futuristic City);
• Fear (T-Rex).
None of these scenarios allow the user to interact
through the controls with the elements of the envi-
ronments, which enhances the activation of arousal
response in the scenarios with a possible feeling of
unsafety. The VR experiences were presented to the
participants using Oculus Quest 2 head-mounted dis-
play (HMD), shown in Figure 5. The VR glasses were
connected to the PC by means of the Oculus Rift USB
procedure. This allows real-time display on the PC of
the scene observed by the user in the HMD.
6.3 iMotions Software
iMotions is a software platform capable of integrating
and synchronizing tasks related to the simultaneous
joint use of biometric sensors. In this work, the sen-
sors to be integrated are the g.tec amplifier used in
the acquisition of EEG signals and the Oculus Quest
2 VR glasses used in the induction of emotions This
GRAPP 2023 - 18th International Conference on Computer Graphics Theory and Applications
80
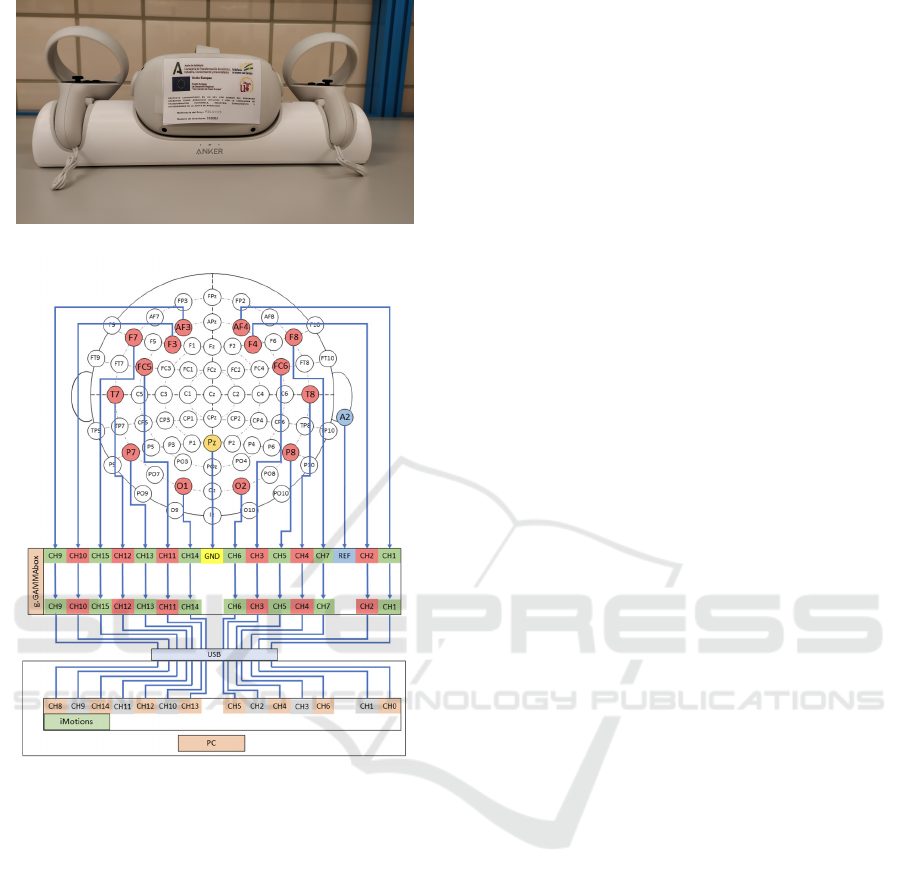
Figure 5: VR glasses and controls.
Figure 6: Channel references at the respective systems.
software not only serves as an orchestrator but also al-
lows to check the quality of the data, to annotate them
in different ways, to select epochs, to pre-process the
raw data and so on.
Among all the possibilities offered by the soft-
ware, the so-called screen recording is used, which
allows recording everything the subject is seeing in
the VR headset. This recording mode allows to spe-
cify the start and end of each type of stimulus in the
time vector of the EEG signals acquired in the experi-
ments. In this work we indicate the instants at which
the Google Earth tutorial as well as each of the four
Oculus Dreamdeck scenarios begin and end, these
entries being available in the data exported by the
iMotions software. This procedure, which is called
data segmentation, is performed manually for each
experiment. The connection scheme of the channels
of the EEG helmet and the iMotions software is illus-
trated in Figure 6.
6.4 Data Collection and Annotation
At present, it has been conducted experiments with a
group of 12 participants, 5 males and 7 females, with
an average age of 22 years. All participants are stu-
dents at the School of Engineering of the University of
Seville, who have voluntarily agreed to participate in
the experiments. First, the participants are informed
about the experiment, its goals, safety procedures and
their rights with an information sheet and through a
signed consent form. After reading informative notes,
the participants are asked about their familiarity with
this kind of technology. After the informative stage,
the subject is invited to take a sit and then, the cap is
placed on his or her head. The electrodes are filled
with the electroconductive gel and then the Oculus
Quest 2 HMD is located and adjusted. After that,
prior to conducting the experiment, the researcher ca-
rries out a pilot test to discard any problems that may
encounter during data collection (the stimulus length
was incorrect/non-random/non-optimal, etc.). Once it
has been verified that everything is working correctly,
data acquisition begins with the launch of the Google
Earth’s tutorial. When the tutorial finishes, the parti-
cipants are asked to provide one level for arousal and
one level for valence by a self-assessment mannequin
(SAM) poll. Afterwards, the Oculus Dreamdeck VR
experience starts. When the experience ends, the VR
headset and the recording EEG helmet are removed,
and the participant is provided with material for clea-
ning the gel on the head. Afterwards, the participants
are asked to provide the arousal and valence levels for
each scenario by a SAM poll. An example of a partici-
pant performing the experiment is shown in Figure 7.
As discussed above, EEG signals are acquired
continuously throughout the experiment, from the in-
troductory experience with Google Earth to the com-
pletion of the Oculus Dreamdeck experience. This
implies that in order to correctly analyze the signals
it is necessary to segment the acquired data, kno-
wing the precise instants at which each of the scena-
rios starts and ends. This procedure is performed by
adding respondent annotations to the EEG recordings
of each participant after the end of the experiment. To
indicate the beginning and end of each scenario the
researcher looks at the recordings to see what the par-
ticipant was seeing in the VR glasses at each moment.
For each Dreamdeck scenario segments of 25 conse-
cutive seconds were selected, while for the introduc-
tory Google Earth tutorial two segments of 1 minute
and 30 seconds duration were extracted.
It is very common for the same stimulus to give
rise to different types of emotions in different sub-
Experimental Setup and Protocol for Creating an EEG-signal Database for Emotion Analysis Using Virtual Reality Scenarios
81

Figure 7: Example of a participant performing the experi-
ment.
jects, and even in the same subject at different times
of experimentation. Therefore, the ground truth of
the induced stimulus must be provided by the par-
ticipant immediately after the end of the experiment.
Data annotation consists of assigning each segment an
arousal and valence level provided by the participant
using a SAM poll. In total, participants completed 5
SAM surveys in each experiment, one at the end of
the Google Earth tutorial and 4 at the end of the full
Dreamdeck experience, that is, the four Dreamdeck
scenarios.
Figure 8 shows a statistical model of the annota-
tions provided by the 12 participants in the four sce-
narios of Oculus Dreamdeck. In particular, the data
have been fitted to a two-dimensional Gaussian dis-
tribution. Means and standard deviations of the fitted
distributions are detailed in Table 1. The data from
the Google Earth’s tutorial is also presented.
In view of these results, it could be said that the
scenes achieve approximately the emotions expected.
Moreover, the Google Earth’s tutorial presents the
Table 1: Means and standard deviations of all scenarios.
Mean Standar Deviation
(Valence/Arousal) (Valence/Arousal)
Google
6,25/2,42 0,75/1,08
Earth
Forest 5,75/1,83 0,87/1,47
Alien 4,33/4,33 1,72/1,23
Futuristic
5,08/4,25 1,68/0,87
City
T-Rex 4,25/5,75 2,49/0.87
1 2 3 4 5 6 7
Valence
1
2
3
4
5
6
7
arousal
(a) Lowpoly Forest.
1 2 3 4 5 6 7
Valence
1
2
3
4
5
6
7
arousal
(b) Alien.
1 2 3 4 5 6 7
Valence
1
2
3
4
5
6
7
arousal
(c) Futuristic City.
1 2 3 4 5 6 7
Valence
1
2
3
4
5
6
7
arousal
(d) T-Rex.
Figure 8: Valence-arousal statistical representations of the
Oculus Dreamdeck scenarios.
lowest standard deviation, which indicates that all
participants were driven to approximately the same
initial state of arousal and valence.
It should also be noted that the arousal dimension
seems to increase as the experiments progress. This
effect may be associated with the expectation of what
the next scenario will be and the increased sense of
immersion over time. Some participants also com-
mented that in the alien, futuristic city and T-Rex sce-
narios they selected high values in the valence dimen-
sion because, although the scene could evoke negati-
vity, the quality of the image made them feel positive.
6.5 Data Pre-Processing and Export
EEG signals have a very small amplitude, on the or-
der of microvolts, so they can be heavily contami-
nated with various types of internal and external ar-
tifacts and background noise. In particular, EEG re-
cordings are prone to subject motion (breathing, blin-
king, head movement), power line interference and
disturbances introduced by devices for emotion in-
duction and signal recording (amplifiers, cables and
VR headset) (Martinek et al., 2021). Therefore, it is
very important for the researcher to monitor the qua-
lity of the signals both during the signal acquisition
experiment and at the end of the experiment to de-
cide whether or not to incorporate the records into the
database.
The raw data acquired in the experiments exhibit
several of these artifacts. In most of the experiments
performed, the electrical potential of the EEG signals
GRAPP 2023 - 18th International Conference on Computer Graphics Theory and Applications
82
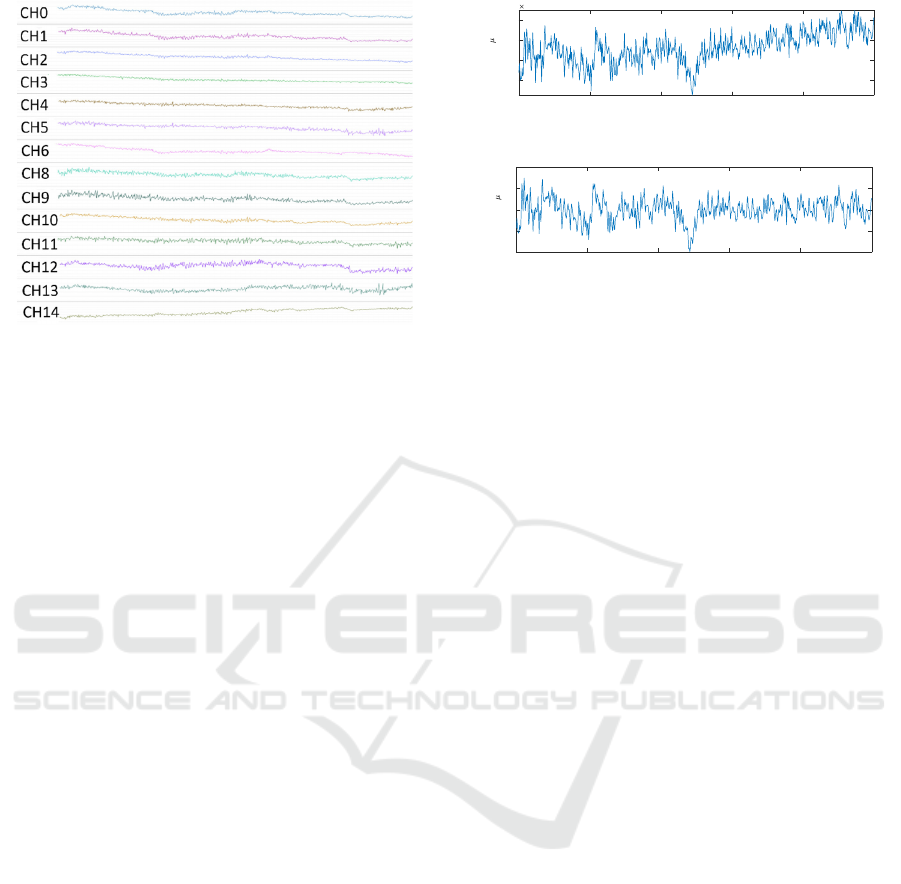
Figure 9: Example of EEG signals visualization with
iMotions software of a portion of the EEG signals acquired
during one of the experiments.
showed a continuous decrease. Once the existence
of defective electrodes was ruled out, this effect may
be due to the participant’s head movement during the
viewing of the VR experiences worsening the connec-
tion between the electrode and the scalp, or to the lack
of gel between the electrode and the skin. The best
remedy for this type of disturbance is usually preven-
tive, for example, by instructing the participants not
to move their heads abruptly or move unnecessarily.
However, to fully enjoy immersive experiences in VR
it is generally necessary to move your head to explore
the entire environment and therefore the presence of
these trends are very probable. To reduce this issue
the low frequencies below 0,5 Hz have been digitally
filtered. Some authors use filters with cutoff frequen-
cies of 4 Hz, however this irremediably affects the
delta band ranging from 1 to 3 Hz, so it has been
discarded. The raw signal has been also digitally fil-
tered to eliminate the high frequencies above 100 Hz,
and the possible presence of power line noise at 50
Hz with a notch filter. Therefore, the pre-processing
of the data includes a zero phase-lag band-pass filter
(Butterworth 0,5-100 Hz) and a zero phase-lag notch
filter (Butterworth 50 Hz).
Figure 9 shows the iMotions data display window
with a fragment of the EEG signals acquired during
one of the experiments, and Figure 10 illustrates the
effect of the two digital filters in a portion of EEG
recording.
In case of not being able to correct these distor-
tions and artifacts, iMotions allows you to mark time
intervals in the recorded signals in which the qua-
lity of the same is not adequate for the subsequent
analysis of the signals, so that only the unaffected
data is exported. Currently, this process is carried out
manually.
Finally, when exporting the data of the experi-
0 0.5 1 1.5 2 2.5
Time [s]
2.494
2.496
2.498
2.5
Voltage [ V]
10
4
(a) Raw signal.
0 0.5 1 1.5 2 2.5
Time [s]
-40
-20
0
20
40
Voltage [ V]
(b) Filtered signal.
Figure 10: Effect of the notch and band-pass digital filters
in a portion of channel 0 (electrode AF4). The millivolts
values observed in the raw signal are produced by the ope-
ration point of the amplifier.
ments, iMotions generates a .csv file for each par-
ticipant. This file includes the raw sensor data pro-
vided by the g.tech amplifier, the pre-processed data
provided by iMotions’ signal processing algorithms
as well as annotations. The voltage values are stored
by columns, in microvolts, and the sample time is in
milliseconds. The segments and the annotations are
also stored in columns. As mentioned above, the ex-
ported data includes 25 seconds of continuous records
for each VR scenario and two 1 minute and 33 sec-
onds segments of continuous records for the Google
Earth tutorial per participant. No post-processing has
been done to the exported signal, leaving this aspect
relegated to future improvements.
7 CONCLUSIONS
Nowadays, virtual reality is taking special importance
in people’s lives, not only for leisure time but also for
professional development. The emotion induced by
this kind of device and its impact on health has be-
come in a dude in the last few years. This work has
presented a methodology to ride experiments for cre-
ating a database of EEG signals for emotion recogni-
tion in VR environments.
The VR environments used in this experimental
protocol have been selected to maximize the inten-
sity and persistence of the emotions they are intended
to induce. The first environment of the experimen-
tal protocol is the Google Earth tutorial, which has
been used to provide the participant with a first con-
tact with the VR technology without the intention of
inducing any kind of emotion but to bring the subject
to a neutral state. Nevertheless, it has been decided
to include a substantial part of the EEG recordings
Experimental Setup and Protocol for Creating an EEG-signal Database for Emotion Analysis Using Virtual Reality Scenarios
83

belonging to this experience in the database, in order
to provide the researchers with information about the
initial emotional state of the subject in the experimen-
tation. The second VR experience consists of a suc-
cession of four 3-minute scenarios called Dreamdeck.
Each of these scenarios induces a different emotional
state in the participant and is presented to the subjects
consecutively. It is at the end of the four scenarios
that the subjects complete the surveys that pertain to
these four scenarios.
The database contains for each participant two
segments of EEG recordings of 1 minute and 30 sec-
onds duration corresponding to the Google Earth tu-
torial and four segments of EEG recordings of 25
seconds duration corresponding to each one of the
Dreamdeck experiences. Currently, records from 12
different participants are available. These records
show the feasibility of the proposed experimental
setup for the development of a database of EEG
recordings under a VR-based emotion induction pro-
tocol, although experiments with more participants
are needed to create a sufficiently large database.
The combined use of EEG sensors and VR head-
sets is very complex and has supposed a challenge
due to several reasons. First, it is necessary to con-
figure and synchronize the data flows from the sen-
sors and devices. This has been solved with the help
of the iMotions software, which allows to capture the
VR content using a screen recording stimulus along
with EEG signals. Secondly, the VR glasses can in-
terfere with the EEG helmet as well as introduce mo-
tion artifacts, both head and blink related. The arti-
facts found in the recorded signals are similar in ap-
pearance to the artifacts introduced by eye blinks and
head movements. We did not notice any alterations in
the recordings due to the electronics of the VR head-
sets, although we cannot completely discard this. For
all these reasons, it is very important to reduce pos-
sible sources of noise in the acquired signals as well
as to pay special attention to the pre-processing of the
acquired signals. At present, it has not been imple-
mented any post-processing of the signal beyond the
possibilities offered by the iMotions software. In the
future we want to expand the pre-processing of the
signals to eliminate artifacts due to flicker as well as
increase the number of EEG channels recorded and
test with other virtual reality glasses.
ACKNOWLEDGEMENTS
This research was supported by grant P20 01173
funded by FEDER and the Andalusian Regional
Government’s Ministry of Economic Transfor-
mation, Industry, Knowledge and Universities,
PAIDI2020, and by grants PID2021-123090NB-I00
and TEC2017-82807-P funded by MCIN/AEI/
10.13039/501100011033.
REFERENCES
Apicella, A., Arpaia, P., Mastrati, G., and Moccaldi, N.
(2021). Eeg-based detection of emotional valence to-
wards a reproducible measurement of emotions. Sci-
entific Reports, 11(1):21615.
Arnau-Gonz
´
alez, P., Katsigiannis, S., Arevalillo-Herr
´
aez,
M., and Ramzan, N. (2021). Bed: A new data set for
eeg-based biometrics. IEEE Internet of Things Jour-
nal, 8(15):12219–12230.
Ba
˜
nos, R. M., Etchemendy, E., Castilla, D., Garc
´
ıa-
Palacios, A., Quero, S., and Botella, C. (2012). Pos-
itive mood induction procedures for virtual environ-
ments designed for elderly people. Interacting with
Computers, 24(3):131–138.
Barrett, L. F. and Wager, T. D. (2006). The structure of
emotion: Evidence from neuroimaging studies. Cur-
rent Directions in Psychological Science, 15:79–83.
Bekele, E., Bian, D., Peterman, J., Park, S., and Sarkar, N.
(2017). Design of a virtual reality system for affect
analysis in facial expressions (vr-saafe); application to
schizophrenia. IEEE Transactions on Neural Systems
and Rehabilitation Engineering, 25(6):739–749.
Bogdanov, D., Won, M., Tovstogan, P., Porter, A., and
Serra, X. (2019). The mtg-jamendo dataset for au-
tomatic music tagging. In ICML 2019.
Bradley, M. and Lang, P. J. (1999). Affective norms for
english words (anew): Instruction manual and affec-
tive ratings. Technical Report Technical Report C-1,
The Center for Research in Physiology, Univeristy of
Florida.
Bradley, M. M. and Lang, P. J. (2017). International Affec-
tive Picture System, pages 1–4. Springer International
Publishing, Cham.
Brundage, S. B., Brinton, J. M., and Hancock, A. B.
(2016). Utility of virtual reality environments to ex-
amine physiological reactivity and subjective distress
in adults who stutter. J Fluency Disord, 50:85–95.
Calvo, R. A. and D’Mello, S. (2010). Affect detection: An
interdisciplinary review of models, methods, and their
applications. IEEE Transactions on Affective Comput-
ing, 1(1):18–37.
Cebeci, B., Celikcan, U., and Capin, T. K. (2019). A com-
prehensive study of the affective and physiological re-
sponses induced by dynamic virtual reality environ-
ments. Computer Animation and Virtual Worlds, 30(3-
4):e1893.
Chirico, A., Cipresso, P., Yaden, D. B., Biassoni, F., Riva,
G., and Gaggioli, A. (2017). Effectiveness of immer-
sive videos in inducing awe: An experimental study.
Scientific Reports, 7(1):1218.
Dan-Glauser, E. S. and Scherer, K. R. (2011). The geneva
affective picture database (gaped): a new 730-picture
GRAPP 2023 - 18th International Conference on Computer Graphics Theory and Applications
84

database focusing on valence and normative signifi-
cance. Behav Res Methods, 43(2):468–477.
Dincelli, E. and Yayla, A. (2022). Immersive virtual re-
ality in the age of the metaverse: A hybrid-narrative
review based on the technology affordance perspec-
tive. The Journal of Strategic Information Systems,
31(2):101717. 2021 Review Issue.
Duan, R.-N., Zhu, J.-Y., and Lu, B.-L. (2013). Differential
entropy feature for eeg-based emotion classification.
In 2013 6th International IEEE/EMBS Conference on
Neural Engineering (NER), pages 81–84.
Feldman Barrett, L. and Russell, J. A. (1998). Indepen-
dence and bipolarity in the structure of current af-
fect. Journal of Personality and Social Psychology,
74:967–984.
Gao, Q., Wang, C.-h., Wang, Z., Song, X.-l., Dong, E.-z.,
and Song, Y. (2020). Eeg based emotion recognition
using fusion feature extraction method. Multimedia
Tools and Applications, 79(37):27057–27074.
G
´
omez-Ca
˜
n
´
on, J. S., Guti
´
errez-P
´
aez, N., Porcaro, L.,
Porter, A., Cano, E., Herrera-Boyer, P., Gkiokas, A.,
Santos, P., Hern
´
andez-Leo, D., Karreman, C., and
G
´
omez, E. (2022). Trompa-mer: an open dataset for
personalized music emotion recognition. Journal of
Intelligent Information Systems.
Guti
´
errez-Maldonado, J., Rus-Calafell, M., and Gonz
´
alez-
Conde, J. (2014). Creation of a new set of dynamic
virtual reality faces for the assessment and training
of facial emotion recognition ability. Virtual Reality,
18(1):61–71.
Hosseini, S. A., Khalilzadeh, M. A., Naghibi-Sistani, M. B.,
and Homam, S. M. (2015). Emotional stress recog-
nition using a new fusion link between electroen-
cephalogram and peripheral signals. Iran J Neurol,
14(3):142–151.
Katsigiannis, S. and Ramzan, N. (2018). Dreamer: A
database for emotion recognition through eeg and ecg
signals from wireless low-cost off-the-shelf devices.
IEEE Journal of Biomedical and Health Informatics,
22(1):98–107.
Ko, J., Jang, S.-W., Lee, H. T., Yun, H.-K., and Kim, Y. S.
(2020). Effects of virtual reality and non-virtual real-
ity exercises on the exercise capacity and concentra-
tion of users in a ski exergame: Comparative study.
JMIR Serious Games, 8(4):e16693.
Koelstra, S., Muhl, C., Soleymani, M., Lee, J.-S., Yazdani,
A., Ebrahimi, T., Pun, T., Nijholt, A., and Patras, I.
(2012). Deap: A database for emotion analysis ;using
physiological signals. IEEE Transactions on Affective
Computing, 3(1):18–31.
Kurdi, B., Lozano, S., and Banaji, M. R. (2017). Introduc-
ing the open affective standardized image set (oasis).
Behav Res Methods, 49(2):457–470.
Lausen, A. and Hammerschmidt, K. (2020). Emotion
recognition and confidence ratings predicted by vocal
stimulus type and prosodic parameters. Humanities
and Social Sciences Communications, 7(1):2.
Liu, H., Zhang, Y., Li, Y., and Kong, X. (2021). Review
on emotion recognition based on electroencephalog-
raphy. Frontiers in Computational Neuroscience, 15.
Maithri, M., Raghavendra, U., Gudigar, A., Samanth,
J., Datta Barua, P., Murugappan, M., Chakole, Y.,
and Acharya, U. R. (2022). Automated emotion
recognition: Current trends and future perspectives.
Computer Methods and Programs in Biomedicine,
215:106646.
Marchewka, A.,
˙
Zurawski, Ł., Jednor
´
og, K., and
Grabowska, A. (2014). The nencki affective picture
system (naps): Introduction to a novel, standardized,
wide-range, high-quality, realistic picture database.
Behavior Research Methods, 46(2):596–610.
Marcus, A., editor (2014). Can Virtual Reality Increase
Emotional Responses (Arousal and Valence)? A Pi-
lot Study, Cham. Springer International Publishing.
Martinek, R., Ladrova, M., Sidikova, M., Jaros, R., Be-
hbehani, K., Kahankova, R., and Kawala-Sterniuk,
A. (2021). Advanced bioelectrical signal processing
methods: Past, present and future approach-part ii:
Brain signals. Sensors (Basel), 21(19).
Meuleman, B. and Rudrauf, D. (2021). Induction and profil-
ing of strong multi-componential emotions in virtual
reality. IEEE Transactions on Affective Computing,
12(1):189–202.
Mohammadi, G. and Vuilleumier, P. (2022). A multi-
componential approach to emotion recognition and
the effect of personality. IEEE Transactions on Af-
fective Computing, 13(3):1127–1139.
Namazi, H., Aghasian, E., and Ala, T. S. (2020).
Complexity-based classification of eeg signal in nor-
mal subjects and patients with epilepsy. Technology
and Health Care, 28(1):57–66.
Pan, Z., Cheok, A., Haller, M., Lau, R. W. H., Saito, H., and
Liang, R., editors (2006). Emotion Recognition Using
Physiological Signals, Berlin, Heidelberg. Springer
Berlin Heidelberg.
Parong, J., Pollard, K. A., Files, B. T., Oiknine, A. H., Sina-
tra, A. M., Moss, J. D., Passaro, A., and Khooshabeh,
P. (2020). The mediating role of presence differs
across types of spatial learning in immersive technolo-
gies. Computers in Human Behavior, 107:106290.
Ribeiro, F. S., Santos, F. H., Albuquerque, P. B., and
Oliveira-Silva, P. (2019). Emotional induction
through music: Measuring cardiac and electrodermal
responses of emotional states and their persistence.
Front Psychol, 10:451.
Riegel, M.,
˙
Zurawski, Ł., Wierzba, M., Moslehi, A., Klo-
cek, Ł., Horvat, M., Grabowska, A., Michałowski, J.,
Jednor
´
og, K., and Marchewka, A. (2016). Character-
ization of the nencki affective picture system by dis-
crete emotional categories (naps be). Behavior Re-
search Methods, 48(2):600–612.
Riva, G., Mantovani, F., Capideville, C. S., Preziosa, A.,
Morganti, F., Villani, D., Gaggioli, A., Botella, C., and
Alca
˜
niz, M. (2007). Affective interactions using vir-
tual reality: the link between presence and emotions.
Cyberpsychol Behav, 10(1):45–56.
Roy, Y., Banville, H., Albuquerque, I., Gramfort, A., Falk,
T. H., and Faubert, J. (2019). Deep learning-based
electroencephalography analysis: a systematic review.
Journal of neural engineering, 16(5):051001.
Experimental Setup and Protocol for Creating an EEG-signal Database for Emotion Analysis Using Virtual Reality Scenarios
85

Russell, J. A. (1980). A circumplex model of affect. Journal
of Personality and Social Psychology, 39:1161–1178.
Sapi
´
nski, T., Kami
´
nska, D., Pelikant, A., and Anbarjafari,
G. (2019). Emotion recognition from skeletal move-
ments. Entropy, 21(7).
ˇ
Simi
´
c, G., Tkal
ˇ
ci
´
c, M., Vuki
´
c, V., Mulc, D.,
ˇ
Spani
´
c, E.,
ˇ
Sagud, M., Olucha-Bordonau, F. E., Vuk
ˇ
si
´
c, M., and
R Hof, P. (2021). Understanding emotions: Origins
and roles of the amygdala. Biomolecules, 11(6).
Song, Z. (2021). Facial expression emotion recognition
model integrating philosophy and machine learning
theory. Front Psychol, 12:759485.
Steffen, J. H., Gaskin, J. E., Meservy, T. O., Jenkins, J. L.,
and Wolman, I. (2019). Framework of affordances for
virtual reality and augmented reality. Journal of Man-
agement Information Systems, 36(3):683–729.
Tyng, C. M., Amin, H. U., Saad, M. N. M., and Malik, A. S.
(2017). The influences of emotion on learning and
memory. Front Psychol, 8:1454.
Yokota, Y. and Naruse, Y. (2021). Temporal fluctuation of
mood in gaming task modulates feedback negativity:
Eeg study with virtual reality. Frontiers in Human
Neuroscience, 15.
Zheng, W.-L. and Lu, B.-L. (2015). Investigating criti-
cal frequency bands and channels for eeg-based emo-
tion recognition with deep neural networks. IEEE
Transactions on Autonomous Mental Development,
7(3):162–175.
Zhou, G.-D., Ding, Y.-l., Li, A.-q., and Sun, P. (2013). Es-
timation method of evolutionary power spectrum for
non-stationary fluctuating wind using wavelet trans-
forms. Engineering Mechanics, 30(3):89–97.
GRAPP 2023 - 18th International Conference on Computer Graphics Theory and Applications
86
