
Prediction of Sleep Stages Based on Wearable Signals Using Machine
Learning Techniques
Rodrigo Duarte Braga
1
, Daniel Osório
1,2
and Hugo Gamboa
1,2
1
Department of Physics, Faculdade de Ciências e Tecnologia da Universidade Nova de Lisboa, Monte da Caparica,
2892-516, Caparica, Portugal
2
Plux-Wireless Biosignals S.A, Avenida 5 de Outubro 70, 1050-59, Lisboa, Portugal
Keywords: Deep Learning, Machine Learning, Wearable, Photoplethysmography, Sleep Stages, Heart Rate Variation.
Abstract: Sleep’s impact on mood and health is widely recognized by medical researchers with such understanding
disseminating among average people in recent years. The main objective of this work was the development
of machine learning algorithms for automatic sleep cycles detection. The features were selected based on
the AASM manual, which is considered the gold standard for human technicians. For training the models
we used MESA, a database containing 2056 full overnight unattended polysomnographies. With the goal of
developing an algorithm that would only require a photoplethysmography (PPG) device to be able to
accurately predict sleep stages and quality, the main channels used from this dataset were peripheral oxygen
saturation and PPG. Testing the performance of Random forest, Gradient Boosting, Gaussian Naive-bayes,
K-Nearest Neighbours, Support Vector Machine and Multilayer Perceptron classifiers, and using features
extracted from the dataset, we achieved 80.50 % accuracy, 0.7586 Cohen’s kappa, and 77.38% F1-score, for
five sleep stages, using a Multilayer Perceptron. To assess its performance in a real-world scenario we
acquired sleep data and compared the classifications attributed by a popular sleep stage classification
android app and our algorithm, resulting in a strong level of agreement (90.96% agreement, 0.8663 Cohen’s
kappa), for four sleep stages.
1 INTRODUCTION
Sleep’s impact on mood and health is widely
recognized by medical researchers with such
understanding disseminating among average people
in recent years. While newer studies strengthen the
suspected link between inadequate sleep and a wide
range of infirmities (Minkel et al., 2012), the general
population is not very conscious of their sleep
quality. As a result, there is much interest in having
proper means of studying sleep, given its importance
and how difficult it is to accurately diagnose sleep
disorders, considering how individuals are affected
by sleep loss, and their ability to recover from said
sleep loss, varies significantly (Tkachenko and
Dinges, 2017). The discovery of the brain’s
electrical activity was the main contributor
responsible for the development of the field of sleep
medicine in the second half of the 20th century. The
examination of the electroencephalogram (EEG)
patterns that occur during sleep lead to the current
division of the sleep period into different stages, thus
creating the basis of sleep medicine and the study of
human sleep (Worley, 2018). One of the major
discoveries was that sleep is much more restorative
to both waking cognition and health when it occurs
and goes through the appropriate physiological
sequences. This is to say that, due to the way that
sleep is structured into distinct stages, where each
one has a certain set of characteristics and its own
physiological role, the exclusive measurement of the
amount of time slept is not enough for the quality of
sleep to be determined. As such, sleep quality
depends not only on total time slept but on many
other factors such as fragmentation, amount of time
spent in each sleep stage, and how the sleep cycles
are structured.
Currently, polysomnography (PSG) is the most
common technique used to study sleep disorders,
being able to record multiple biosignals
simultaneously (Rundo and Downey, 2019; Karlen
et al., 2009). It has, however, the issue of being
expensive and inconvenient (Kelly et al., 2012), with
the fact that this type of exam is normally performed
Braga, R., Osório, D. and Gamboa, H.
Prediction of Sleep Stages Based on Wearable Signals Using Machine Learning Techniques.
DOI: 10.5220/0011655200003414
In Proceedings of the 16th International Joint Conference on Biomedical Engineering Systems and Technologies (BIOSTEC 2023) - Volume 4: BIOSIGNALS, pages 195-202
ISBN: 978-989-758-631-6; ISSN: 2184-4305
Copyright
c
2023 by SCITEPRESS – Science and Technology Publications, Lda. Under CC license (CC BY-NC-ND 4.0)
195

in a clinic additionally raising the issue of negative
bias, as people may behave differently than normal
when they know they are being monitored.
Furthermore, there is the matter of longitudinal data.
Laboratory PSGs are usually a single-night snapshot,
whereas sleep is a dynamic process that is affected
by the existence and intensity of many other factors
that vary from day to day.
Wearable sleep-trackers, on the other hand, are
low-cost devices capable of measuring biosignals
and, from this data, inferring information about
certain behaviours, like sleep. They present many
advantages over PSG, such as their convenience,
ease of use, affordability and data accessibility, with
the possibility of using some sort of cloud-based
platform for storage of data, thus allowing the
acquisition of an unprecedented amount of
information about sleep and other behaviours or
health parameters.
Because of the costs and time expenditures
associated with PSG, there is much interest in the
development of algorithms that can be deployed in a
wearable device, being able to automatically and
accurately classify sleep stages with a similar degree
of accuracy as the current gold-standard. Ideally,
such an algorithm should also strive to be as simple
as possible (both in terms of signals used and model
complexity).
1.1 State-of-the-Art
As sleep disorders are common in modern society,
with the main difficulty of their treatment being
detection and diagnosis (Pavlova and Latreille,
2019), and with the recent increase in popularity of
using wearable devices in medicine (Akkaş et al.,
2020), some studies have already been developed on
the performance of models for sleep stage prediction
using different biosignals, features or classifiers.
In the literature about the performance of these
kinds of wearables, it was possible to find
information about Fitbit Charge 2, which records
wrist activity through accelerometers and pulses
through photoplethysmography (PPG). In Stucky et
al. (2021), the authors compared this device against
portable home PSG, displaying reasonably accurate
mean values of sleep and heart rate (HR) estimates,
should it follow careful data processing. One other
device is the Heally Recording System which,
through the combination of embedded sensors and
electrodes in a shirt that measures respiratory and
cardiac physiology, monitors sleep based on
autonomic signals. It exhibited accuracy at
approximately 80% agreement with manual scoring,
which is similar to accuracies obtained through
actigraphy, considered an appropriate method for the
assessment of sleep in patients with certain sleep
disorders (McCall and McCall, 2012).
Other studies, relying on ML, have successfully
developed algorithms for sleep stage prediction. For
example, Tsinalis et al. (2020) managed to obtain
sleep stage-specific characteristics with an average
accuracy of 86% based on EEG data, while Yildirim
et al. (2019), developed and applied a 19-layer 1D
convolutional neural network model to EEG and
EOG signals, achieved the highest classification
accuracies for 5 of its 6 sleep classes as over 91%.
More specifically for studies using the same
dataset (that will be described in the next section)
that was chosen for this work, we have Kudo et al.
(2022) that, using PPGs and accelerometers’
information extracted from the public datasets Apple
watch Sleep (Walch et al., 2019), and Multi-Ethnic
Study of Atherosclerosis (MESA) (Zhang et al.,
2018; Chen et al., 2015), achieved a macro F1 score
of 0.655 and Cohen’s kappa score of 0.527, using a
recurrent neural network. Another similar study,
published by Sridhar et al. (2020), using the ECG
signal of both the Sleep Heart Health Study (Quan et
al., 1997) and the MESA dataset for training,
validation and testing of the developed algorithm,
obtained an 47 overall performance of 77% accuracy
and 0.66 Cohen’s kappa against the reference stages
on a held-out portion of the datasets used for
training.
All these studies suggest that the development of
similar fully automatic recognition systems could
serve as a suitable replacement for manual
inspection of PSG signals, particularly for large-
scale studies.
2 DATASET DESCRIPTION
Initially, the algorithm was trained through the use
of a publicly available online database, selected
from others such as the NCH Sleep DataBank (Lee
et al., 2021), or the Sleep Heart Health Study. After
a comparison between several of these databases,
one was selected based on its size, sensor quality
and quantity, detail of the scoring, and how recently
collected was the data.
The set of PSG recordings used for this work
was obtained from MESA. This dataset included a
sleep exam with 2237 participants, consisting of full
overnight unattended polysomnographies that were
conducted between 2010-2012, and had the
following demographics described in Table 1.
BIOSIGNALS 2023 - 16th International Conference on Bio-inspired Systems and Signal Processing
196

Table 1: Dataset demographics of the MESA database
(adapted from (NSRR team, 2022)).
Characteristics Value
Number of PSGs 2056
Number of Patients 2237
Age (Years)
Mean 69.6
Median 69.0
Standard deviation ± 9.2
Minimum 54.0
Maximum 95.0
Gender
Female 1198
Male 1039
Race/ethnicity
White, Caucasian 830
Chinese American 265
Black, African-American 616
Hispanic 526
The information pertaining to the PSG studies in
the MESA dataset are contained in two separate file
formats for each study. The EDF files store 27
biosignal channels, from which we used only three,
HR information, the PPG recording, and oxygen
saturation. With the exception of the PPG signal that
was sampled at 256 Hz, the channels were sampled
at 1 Hz. On the other hand, the XML files contain
annotations corresponding to the PSG recordings,
such as sleep stages and their duration.
For the real-world validation of the developed
models, 14 nights of sleep were acquired using a
biosignalsPlux device on the posterior side of the
left wrist (Plux Wireless Biosignals, 2022) that
recorded both PPG and accelerometer data, and a
smartwatch (Ticwatch E2) on the right wrist.
3 METHODOLOGY
In order to build the code developed in this work to
analyse and process the dataset, as well as build the
ML models, Python was used through the code
editor Spyder. Several different libraries were used,
including BeautifulSoup4, Pandas, NumPy, scikit-
learn, Tensorflow, and hrvanalysis. After the
development of the algorithms, to test them in a real-
world scenario, they were used to classify the sleep
stages of the acquired 14 nights of sleep. These
classifications were then compared to the results
obtained from “Sleep as Android“ (Chaudhry,
2017), which is one of the most reviewed android
sleep analysis smartphone applications, using the
measurements taken using the smartwatch.
In the next Sub-Sections, the algorithms used to
perform the classification of the data, the metrics
upon which they are evaluated, and both which
features and how they were extracted are described.
3.1 Data Pre-Processing and Feature
Extraction
The first step of the extraction of the data from the
PPG records was the standardization of the signal,
achieved through the subtraction of the signal’s
mean followed by its division by its standard
deviation. After that, the signal was segmented in
short windows (half second interval) and the mean
of each of these intervals was subtracted to minimize
baseline drift. Subsequently a 4th order Chebyshev
II bandpass filter (sampling frequency of 256 Hz and
cut-off frequencies of 0.05 and 30 Hz) was used.
At this stage we segmented the signal according
to the sleep stage annotations and began extracting
features. These features, a total of 30, range from the
maximum, mean and minimum values of oxygen
saturation and HR, in this case also including its
standard deviation, to features related to heart rate
variation (HRV). The resulting analysis of HRV is
grouped under time-domain and frequency-domain.
In the time-domain, 12 features were used, such
as root mean square of successive differences
between N-N intervals (RMSSD), standard deviation
of these differences (SDSD), number of pairs of
successive N-N intervals that differ by more than 50
ms and 20 ms (NN50 and NN20), total proportion of
NN50 and NN20 in relation to the total number of N-
N intervals, standard deviation of all N-N intervals
(calculated over each 30 second interval), mean and
median of the N-N intervals (Mean_nni and
Median_nni), coefficient of variation (SDNN divided
by Mean_nni), coefficient of variation of successive
differences (RMSSD divided by Mean_nni) and,
finally, the difference between the longest and
shortest N-N interval.
As for the frequency-domain, seven features
were used, including total power spectral density
(Golgouneh and Tarvirdizadeh, 2020), power in the
very low (vlf), low (lf), and high (hf) frequency
bands (Salahuddin et al., 2007), normalised lf and hf
power, and the ratio between these two powers.
Two additional features related to the PPG
signal’s entropy (more specifically fuzzy (Chen et
al., 2007) and dispersion entropy (Rostaghi and
Prediction of Sleep Stages Based on Wearable Signals Using Machine Learning Techniques
197

Azami, 2016)) were extracted after averaging its
value in windows of 32 samples, to minimize time
spent for this step and the information loss resulting
from the averaging.
Finally, despite only classifying sleep in 30
second intervals, the two preceding stage
classifications were also used as features, so as to
take into account the continuity of sleep.
3.2 Classification Models
To classify the sleep stages, we used both machine
learning models (such as Random Forest, Gradient
Boosting, Gaussian Naïve-Bayes, K-Nearest
Neighbours, and Support Vector Machine) and
artificial neural networks (Multilayer Perceptrons).
The choice of these algorithms was based on
both literature reviews done for other sleep stage
classification studies, and trial and error.
3.2.1 Random Forest
Random Forest is an ensemble learning method that
constructs and uses numerous decision trees. Due to
random variable selection and bootstrap aggregation
leading to lower correlation across trees, the
ensemble prediction is generally more accurate than
any of its decision trees individual predictions.
3.2.2 Gradient Boosting
Gradient Boosting is an ensemble learning method
of weak prediction models, usually decision trees.
With careful tuning of its parameters, it may result
in better performance than Random Forest models.
3.2.3 Gaussian Naive-Bayes
Gaussian Naive Bayes classifiers are based on
applying Bayes’ theorem with a strong
independence assumption to classify the data.
3.2.4 K-Nearest Neighbours
K-Nearest Neighbours (KNN) classifiers utilise
proximity to make predictions. For classification
problems, a class label is assigned to a data element
based on the vote of the K number of its nearest
neighbours. It is possible to construct a weighted
version using the distance between data points.
3.2.5 Support Vector Machine
Support-Vector Machine (SVM) algorithms attribute
classifications by finding a hyperplane in an N-
dimensional space that is able to separately classify
the data points.
3.2.6 Multilayer Perceptron
Multilayer Perceptrons are a fully connected class of
feedforward artificial NNs, consisting of at least
three layers of nodes. With the exception of the
nodes in the input layer, each node is a neuron that
uses a nonlinear activation function.
3.3 Model’s Hyperparameters
The characteristics of machine learning algorithms
are strongly tied to their hyperparameters, with their
optimization and tuning being pivotal to a model’s
performance (Feurer and Hutter, 2019). For the non-
neural network models, the chosen method to tune
these hyperparameters was grid search, which is a
tuning technique that computes their optimum
values through an exhaustive search in a manually
introduced subset of values. Scikit-learn library’s
implementation of this function was used, with the
hyperparameters’ values being presented in table 2.
Table 2: Values for the different parameters to be
optimized when utilizing scikit-learn’s grid search.
Parameters Values
Random
Forest
n_estimators
10-100, 100-1000 (increasing
b
y 10 and 100, respectively)
Criterion gini, entropy
max_depth
None, 10-100 (increasing by
10
)
Gradient
Boosting
n_estimators
10-100, 100-1000 (increasing
b
y 10 and 100, respectively)
Criterion
friedman_mse, squared_error,
mse
max_depth
1,3,5, 10-100(increasing by
10
)
KNN
n_neighbours 1, 3, 5, 7, 9, 11
Weights uniform, distance
Metric manhattan, Euclidean
SVM
C
0.0001, 0.01, 0.05, 0.1, 0.5,
1.0, 5, 10
Kernel linear, poly, rbf
Gamma
scale, 0.0001, 0.01, 0.05, 0.1,
0.5, 1.0, 5, 10
For the neural network models, their
hyperparameters were chosen to be tuned through
trial and error due to their increased complexity.
BIOSIGNALS 2023 - 16th International Conference on Bio-inspired Systems and Signal Processing
198
3.4 Model Evaluation
After training the algorithms, it is necessary to
evaluate their performance. To do this, the MESA
dataset was first split into testing and training sets,
so as to permit an assessment and minimization of
the impact of the model’s overfitting to the data,
which would otherwise lead to an imprecise
estimation of the model’s capabilities. Additionally,
as sleep stages’ distribution is naturally unbalanced
(Worley, 2018), to promote a more even learning
process, these sets were balanced.
Finally, some metrics were calculated to evaluate
their performance. These metrics were accuracy,
Cohen’s kappa and macro average F1-score.
4 RESULTS
For the non-neural network models, after optimizing
their hyperparameters through grid search, the
evaluated metrics for the best performing models of
each type obtained are presented in Table 3.
Table 3: Values of the chosen metrics for the highest
performance non-neural network models of each type.
Accurac
y
(
%
)
Cohen's ka
pp
a
Random Forest 79.30 0.7412
Gradient Boosting 82.34 0.7792
Gaussian Naive-
Bayes
68.41 0.6052
KNN 21.99 0.0249
SVM 25.03 0.0628
As can be observed in Table 3, the best
performing models are Random Forest and Gradient
Boosting, with this last model presenting an overall
more balanced performance for all of its
classifications when compared to the other models
and presenting the highest accuracy and Cohen’s
kappa for the balanced test dataset.
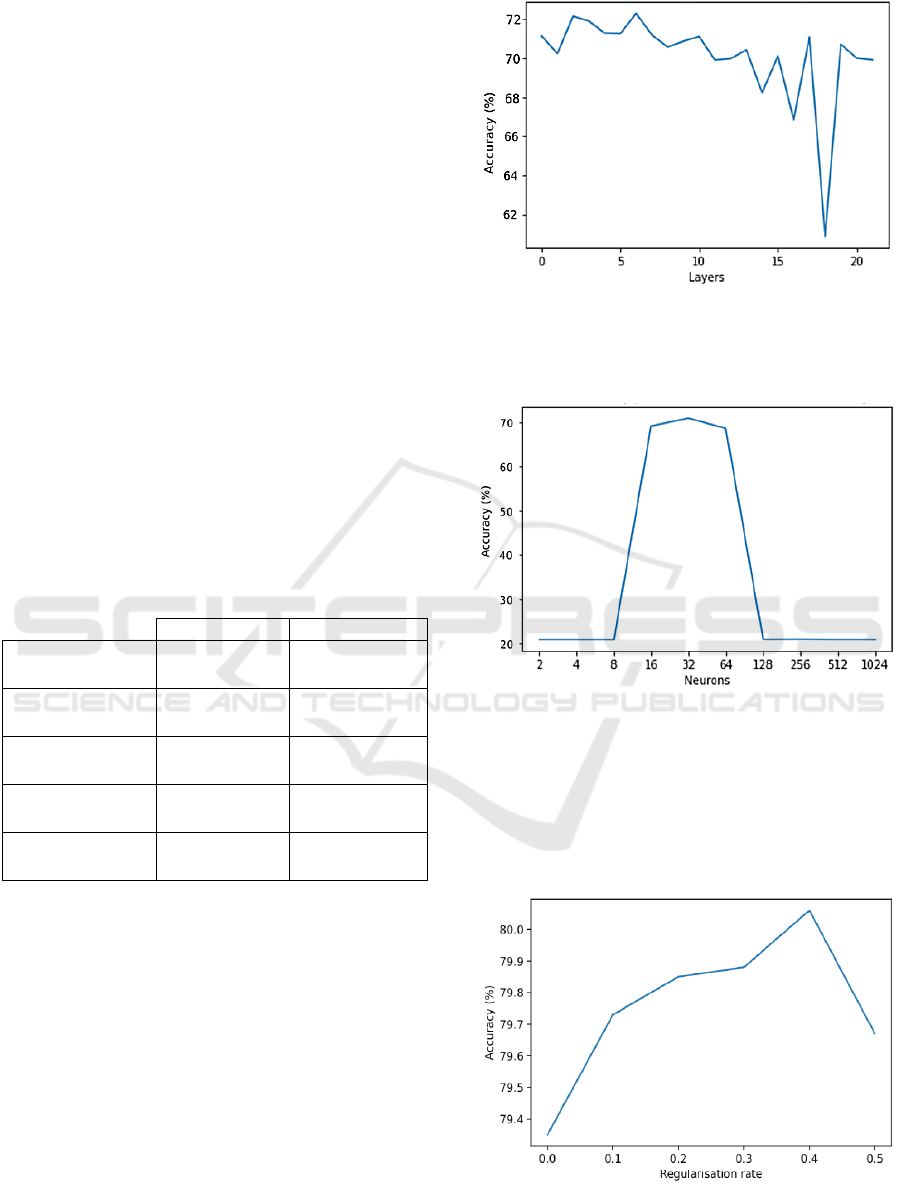
For the neural network models, the first step of
tuning its architecture was selecting the number of
layers and neurons per layer. Accordingly, starting
by the hidden layer number, it was discovered that
models with three layers are optimal (Figure 1).
Figure 1: Model accuracy per number of layers.
Following this, the optimal neuron count per
layer for this 3-layered model was found (Figure 2).
Figure 2: Model accuracy per number of neurons in each
layer.
Finally, to reduce overfitting the influence of
several regularization methods such as L1, L2 and
dropout were tested, with only L2 regularization
having a positive influence in the performance of the
developed models (Figure 3).
Figure 3: Correlation between maximum model accuracy
and L2 regularisation rate.
Prediction of Sleep Stages Based on Wearable Signals Using Machine Learning Techniques
199
In this figure, it is possible to observe that the
best result is achieved when a L2 regularisation rate
of 0.4 is used, with this model presenting an
accuracy of 80.50%, Cohen’s kappa of 0.7563 and
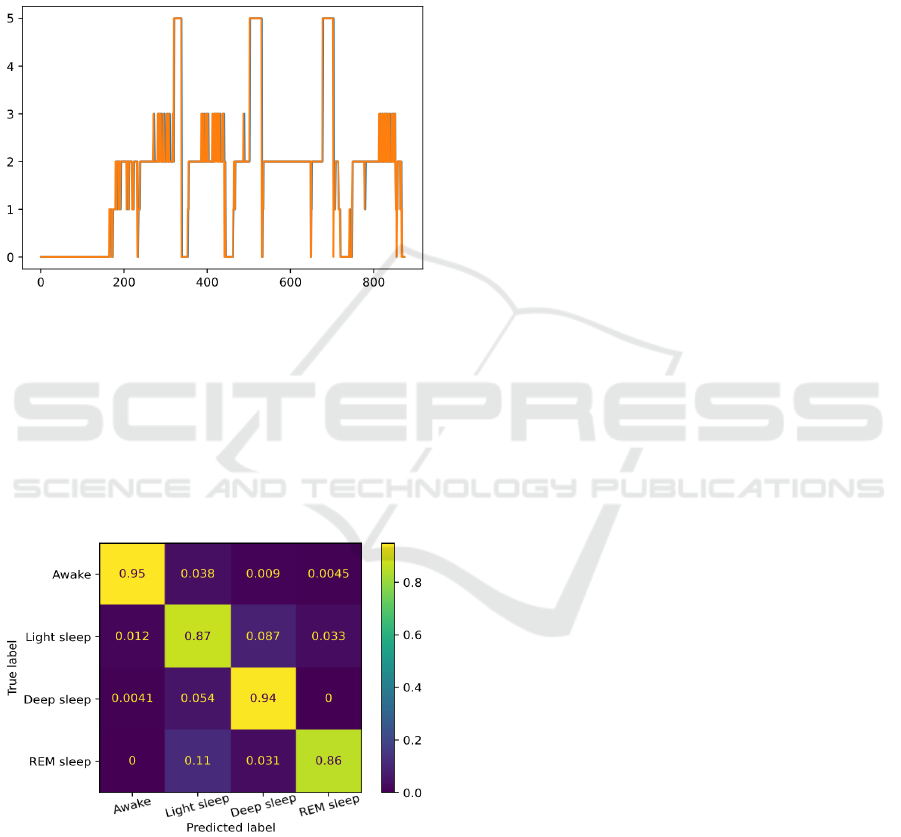
F1 score of 77.38 % (in the unbalanced test set). An
example of the resulting classification can be seen in
figure 4, where the orange lines are the true sleep
stages and the blue lines are the model’s predictions,
with the blue lines disappearing when they match.
Figure 4: Sleep stages for each interval of a randomly
chosen MESA file, classified by the developed algorithm.
Using this final model to classify the sleep night
data that was recorded during this work, an
agreement of 90.96%, Cohen’s kappa of 0.8663, and
macro average F1-score of 90.52% was achieved
when compared to the classifications attributed by
the Android app, with these results being displayed
in figure 5.
Figure 5: Normalized confusion matrix of the results
obtained from the classification of real-world data.
5 DISCUSSION
First it is important to notice that, usually, models
are stochastically trained, meaning that two models
with the matching architecture being trained with
identical data in the same manner, might perform
differently after training, which may further
complicate the study and understanding of the
training process. To solve this issue several identical
models with the same characteristics were
developed, at which point their average performance
was evaluated, and then compared with the average
performance of other models with different
architectures.
As mentioned previously, some commonly used
regularisation methods, such as L1, L2, or dropout,
were tested. In the case of the latter, despite usually
being described as improving model performance
(Baldi and Sadowski, 2014; Srivastava et al., 2014),
it failed to do so in this case, instead leading to a
decrease in performance (even only 5% dropout
lowers average accuracy to 41.84%). This decrease
seems tied to dropout probability, where the higher
the probability, the worse the performance is, until a
plateau is reached at approximately 37.35%
accuracy. The addition of L1 regularisation also
seems to be detrimental to model development, with
the higher the rate, the worse its impact on the
model’s accuracy. On the other hand, L2
regularisation seems to improve the effectiveness of
the models, and, while we found a regularisation rate
of 0.4 to be optimal, there seems to be a wide range
of values (from 0.1 to 2) where the model still
benefits from its addition.
With this said, for the NNs, the best performing
model presented 80.50% accuracy, 0.7563 Cohen’s
kappa on the balanced test set, and a macro average
F1-Score of 77.38% on the complete, unbalanced
test set. After an extensive search for the optimal
configuration of hyperparameters, we found that the
model consistently performed better in a 3 hidden
layer, 32 neurons per layer, structure, with all hidden
layers having a L2 regularisation rate of 0.4. Overall,
we found that performance tends to be highest for
models with 3 or 7 layers, with it dropping sharply
outside these limits. Similarly for neuron count,
accuracy dropped to around 20% for any number of
neurons per layer outside of the interval between 16
and 64, whereas it seems mostly stable at around
80% accuracy and optimal at 32 neurons per layer.
The results obtained are promising as, while
some models are able to achieve higher accuracy
(Tsinalis et al., 2016; Yildirim et al., 2019), they do
so while using more signals (usually EEG, EOG, or
ECG), which significantly restricts their usability for
everyday applications. Conversely, we reached
better performance than many other models,
including recently published studies that make use of
BIOSIGNALS 2023 - 16th International Conference on Bio-inspired Systems and Signal Processing
200

more signals or features (Sun et al., 2020), or
employ the same dataset (Kudo et al., 2022; Sridhar
et al., 2020).
For the classification of the real-world data that
was acquired, a neural network was chosen over the
other Gradient Boosting model, as even though its
performance on the balanced test dataset was
slightly inferior to the best performing non-neural
network model, its performance on stage 2
classification (one of the most common stages for
naturally-occurring unbalanced sleep) is
substantially improved, which leads to this model
being superior for real-world stage classifications
(0.7586 Cohen’s kappa in the complete, unbalanced
test dataset, in contrast to 0.6967) without being as
deleterious to lowest class accuracy (52.95%
compared to 56.32% accuracy). Additionally, the
increase in misclassifications by this model tends to
be between physiologically similar stages (such as
between stage 1 and stage 2, which are both usually
considered light sleep, for example), which lowers
the importance of such errors. This neural network
being the most accurate algorithm developed is in
line with the current state-of-the-art, as the model’s
increased complexity theoretically allows it to more
accurately classify the different sleep stages.
After this selection, the device’s data was scored
by our algorithm, and then compared with the
classifications by the Android application, at which
point a strong level of agreement (McHugh, 2012)
(90.96% accuracy, 0.8663 Cohen’s kappa and a
macro average F1-Score of 90.52%) was observed.
6 CONCLUSION
This work’s main objective was the development of
a ML algorithm that detects and classifies sleep
cycles. For this end, both NN and non-NN models
were developed.
The performance achieved for the final NN
model was higher than many other studies, despite
generally using a lesser amount of features or signals
and the same or similar datasets.
Another goal of this work was to test the
developed model’s performance in a real-world
scenario. To achieve this, we simultaneously
recorded 14 nights of sleep using a biosignalsPlux
device with PPG and accelerometer sensors and a
widely used Android sleep scoring application
paired with a commercially available wearable
device. After comparing the resulting classifications
we obtained a strong level of agreement. This leads
us to believe in the potential of the developed
algorithm to be used in real-world scenarios.
While the main goals of this work were fulfilled,
it still presents some limitations that could be
improved, namely in terms of feature acquisition and
extraction.
Future studies should attempt to integrate these
algorithms into devices. This way, not only is it
possible to increase the similarity between the
devices and algorithms being compared, but it
should also be easier to acquire a larger amount of
data, ideally, from a larger set of individuals as well.
The recording of more data itself would also
likely lead to improvements in the determination of
the real-world performance of the models, besides
the potential use of this data for model training. In
this regard, the recording and comparison of results
with a PSG study would be optimal.
Additionally, during feature extraction, we chose
to reduce the number and quality of the entropies
used as features, due to time and computation
constraints. As, even after this, these were some of
the most relevant features, the extraction and use of
them without averaging the signal beforehand could
lead to some performance improvements.
Finally, throughout this work several models
were created, some of them having similar levels of
accuracy and other selected metrics to the final
model developed. Due to this, a complementary
study that could be done is the creation of another
ensemble model that utilises the output of these
models as inputs, as these types of models tend to
have a better performance than the sum of their parts
(Zhang and Ma, 2012).
REFERENCES
Akkaş, M. A., Sokullu, R., & Ertürk Çetin, H. (2020).
Healthcare and patient monitoring using IoT. Internet
of Things, 11, 100173.
Baldi, P., & Sadowski, P. (2014). The Dropout Learning
Algorithm. Artificial Intelligence, 210(1), 78–122.
Chaudhry, B. M. (2017). Sleeping with an Android.
MHealth, 3, 7–7.
Chen, W., Wang, Z., Xie, H., & Yu, W. (2007).
Characterization of surface EMG signal based on
fuzzy entropy. IEEE Transactions on Neural Systems
and Rehabilitation Engineering, 15(2), 266–272.
Chen, X., Wang, R., Zee, P., Lutsey, P. L., Javaheri, S.,
Alcántara, C., Jackson, C. L., Williams, M. A., &
Redline, S. (2015). Racial/ethnic differences in sleep
disturbances: The Multi-Ethnic Study of
Atherosclerosis (MESA). Sleep, 38(6), 877–888.
Feurer, M., & Hutter, F. (2019). Hyperparameter
Optimization. In: Hutter, F., Kotthoff, L., Vanschoren,
Prediction of Sleep Stages Based on Wearable Signals Using Machine Learning Techniques
201

J. (eds) Automated Machine Learning. The Springer
Series on Challenges in Machine Learning. Springer,
Cham. 3–33.
Fonseca, P., Weysen, T., Goelema, M. S., Møst, E. I. S.,
Radha, M., Lunsingh Scheurleer, C., van den Heuvel,
L., & Aarts, R. M. (2017). Validation of
Photoplethysmography-Based Sleep Staging
Compared With Polysomnography in Healthy Middle-
Aged Adults. Sleep, 40(7).
Golgouneh, A., & Tarvirdizadeh, B. (2020). Fabrication of
a portable device for stress monitoring using wearable
sensors and soft computing algorithms. Neural
Computing and Applications, 32(11), 7515–7537.
K. Pavlova, M., & Latreille, V. (2019). Sleep Disorders.
American Journal of Medicine, 132(3), 292–299.
Kelly, J. M., Strecker, R. E., & Bianchi, M. T. (2012).
Recent Developments in Home Sleep-Monitoring
Devices. ISRN Neurology, 2012, 1–10.
Kudo, S., Chen, Z., Ono, N., Altaf-Ul-Amin, M. D.,
Kanaya, S., & Huang, M. (2022). Deep Learning-
Based Sleep Staging with Acceleration and Heart Rate
Data of a Consumer Wearable Device. LifeTech 2022 -
2022 IEEE 4th Glob. Conf. Life Sci. Tech., 305–307.
Lee, H., Li, B., DeForte, S., Splaingard, M., Huang, Y.,
Chi, Y., & Lin, S. (2021). NCH Sleep DataBank: A
Large Collection of Real-world Pediatric Sleep
Studies.
McCall, C., & McCall, W. V. (2012). Comparison of
actigraphy with polysomnography and sleep logs in
depressed insomniacs. Journal of Sleep Research.,
21(1), 122–127.
McHugh, M. L. (2012). Interrater reliability: the kappa
statistic. Biochemia Medica, 22(3), 276.
Minkel, J. D., Banks, S., Htaik, O., Moreta, M. C., Jones,
C. W., McGlinchey, E. L., Simpson, N. S., & Dinges,
D. F. (2012). Sleep deprivation and stressors:
Evidence for elevated negative affect in response to
mild stressors when sleep deprived. Emotion, 12(5),
1015–1020.
NSRR team, (2022). Administrative - MESA Variables -
Sleep Data - National Sleep Research Resource -
NSRR. (n.d.). Retrieved June 24, 2022, from
https://sleepdata.org/datasets/mesa/variables?folder=A
dministrative
PLUX Biosignals | Professional Kit. (n.d.). Retrieved
August 5, 2022, from https://www.pluxbiosignals.com
/collections/biosignalsplux/products/professional-kit
Quan, S. F., Howard, B. V., Iber, C., Kiley, J. P., Nieto, F.
J., O’Connor, G. T., Rapoport, D. M., Redline, S.,
Robbins, J., Samet, J. M., & Wahl, P. W. (1997). The
Sleep Heart Health Study: Design, rationale, and
methods. Sleep, 20(12), 1077–1085.
Rostaghi, M., & Azami, H. (2016). Dispersion Entropy: A
Measure for Time-Series Analysis. IEEE Signal
Processing Letters, 23(5), 610–614.
Rundo, J. V., & Downey, R. (2019). Polysomnography.
Handbook of Clinical Neurology, 160, 381–392.
Salahuddin, L., Cho, J., Jeong, M. G., & Kim, D. (2007).
Ultra short term analysis of heart rate variability for
monitoring mental stress in mobile settings. Annual
International Conference of the IEEE Engineering in
Medicine and Biology Society. IEEE Engineering in
Medicine and Biology Society. Annual International
Conference, 2007, 4656–4659.
Sridhar, N., Shoeb, A., Stephens, P., Kharbouch, A.,
Shimol, D. Ben, Burkart, J., Ghoreyshi, A., & Myers,
L. (2020). Deep learning for automated sleep staging
using instantaneous heart rate. Npj Digit. Med., 3(1).
Srivastava, N., Hinton, G., Krizhevsky, A., &
Salakhutdinov, R. (2014). Dropout: A Simple Way to
Prevent Neural Networks from Overfitting. Journal of
Machine Learning Research, 15, 1929–1958.
Stucky, B., Clark, I., Azza, Y., Karlen, W., Achermann,
P., Kleim, B., & Landolt, H. P. (2021). Validation of
fitbit charge 2 sleep and heart rate estimates against
polysomnographic measures in shift workers:
naturalistic study. Journal of Medical Internet
Research, 23(10), 1–20.
Sun, H., Ganglberger, W., Panneerselvam, E., Leone, M.
J., Quadri, S. A., Goparaju, B., Tesh, R. A., Akeju, O.,
Thomas, R. J., & Westover, M. B. (2020). Sleep
staging from electrocardiography and respiration with
deep learning. Sleep, 43(7).
Tkachenko, O., & Dinges, D. F. (2018). Interindividual
variability in neurobehavioral response to sleep loss: A
comprehensive review. Neuro. Biobe. Rev., 89, 29–48.
Tsinalis, O., Matthews, P. M., & Guo, Y. (2016).
Automatic Sleep Stage Scoring Using Time-
Frequency Analysis and Stacked Sparse Autoencoders.
Annals of Biomedical Engineering, 44(5), 1587–1597.
Walch, O., Huang, Y., Forger, D., & Goldstein, C. (2019).
Sleep stage prediction with raw acceleration and
photoplethysmography heart rate data derived from a
consumer wearable device. Sleep, 42(12).
Worley, S. L. (2018). The extraordinary importance of
sleep: The detrimental effects of inadequate sleep on
health and public safety drive an explosion of sleep
research. P and T, 43(12), 758–763.
Yildirim, O., Baloglu, U. B., & Acharya, U. R. (2019). A
deep learning model for automated sleep stages
classification using PSG signals. International Journal
of Environmental Research and Public Health, 16(4).
Zhang, C., & Ma, Y. (2012).
Ensemble Machine Learning:
Methods and Applications. Springer Publishing
Company, Incorporated.
Zhang, G. Q., Cui, L., Mueller, R., Tao, S., Kim, M.,
Rueschman, M., Mariani, S., Mobley, D., & Redline,
S. (2018). The National Sleep Research Resource:
Towards a sleep data commons. Journal of the
American Medical Informatics Association, 25(10),
Zhao, X., & Sun, G. (2021). A Multi-Class Automatic
Sleep Staging Method Based on
Photoplethysmography Signals. Entropy, 23(1), 1–12.
BIOSIGNALS 2023 - 16th International Conference on Bio-inspired Systems and Signal Processing
202
