
An Immersive Feedback Framework for Scanning Probe Microscopy
Denis Heitkamp
1
, Jaccomo Lorenz
1
, Maximilian Koall
2
, Philipp Rahe
2
and Philipp Lensing
1
1
IuI, Osnabr
¨
uck University of Applied Sciences, Albrechtstraße, Osnabr
¨
uck, Germany
2
Physik, University Osnabr
¨
uck, Osnabr
¨
uck, Germany
Keywords:
Scanning Probe Microscopy, SPM, Nanoscience, Haptic Feedback, Virtual Reality, VR, Datasets.
Abstract:
In this paper we introduce an application for analyzing datasets obtained by scanning probe microscopy (SPM).
Datasets obtained by such microscopes are typically depicted by two-dimensional images where the measured
quantity (typically forces or electric current) is represented by pixel intensities of a rasterized image. Record-
ing several images of this kind with one parameter being in- or decremented before recording the next image
results in three-dimensional datasets. A conventional two-dimensional representation of such data by visual-
izing an axis-aligned slice cutting through the 3D data seems insufficient, since only a fraction of the available
data can be examined at once. To improve the understanding of the measured data we propose utilizing a
haptic device with four different real-time haptic models (collision, force, vibration and viscosity) in order
to reinterpret nano surfaces in an intuitive way. This intuition is furthermore improved by virtually scaling
the nano data to normal sized surfaces perceived through a Head Mounted Display (HMD). This stereoscopic
visualization is real-time capable while providing different rendering techniques for 3D (volumetric) and 2D
datasets. This combination of appealing real-time rendering in conjunction with a direct haptic feedback cre-
ates an immersive experience, which has the potential to improve efficiency while examining SPM data.
1 INTRODUCTION
Scanning Probe Microscopy (SPM) describes a fam-
ily of techniques that are now well established for the
direct imaging of surface-adsorbed atoms, molecules,
or molecular structures (Bian et al., 2021). The com-
mon characteristic of these techniques is the measure-
ment of a physical quantity in one, two, or three di-
mensions at the nanoscale, gathered by rasterizing a
probing tip along the three spatial coordinates in close
proximity to the surface of study. Historically, the
scanning tunnelling microscope (STM) was the first
invention in the field of SPM: an atomically sharp and
conductive tip is positioned with sub-atomic (picome-
ter) precision above a conductive surface of study
with a tip-surfaces distance typically in the regime
of a few
˚
Angstrom (Binnig et al., 1982). Due to
the close proximity, a tunnelling current between tip
and sample can be measured if a bias voltage is ap-
plied. Systematic measurements of this tunnelling
current with respect to the vertical coordinate Z al-
lows the measurement of physical parameters such as
the work function, while 2D-mapping along the two
lateral positions X, Y delivers images of the electrical
conductivity. A fourth data dimension, given by the
sample bias, delivers most important information on
the electronic and vibrational properties of the sam-
ple of study (Stipe et al., 1998). The second key SPM
technique is the so-called atomic force microscope
(AFM) (Binnig et al., 1986), in particular the non-
contact (NC) variant (Albrecht et al., 1991) that can
deliver submolecular resolution (Gross et al., 2018).
This technique is based on a measurement of interac-
tion forces between tip and sample, thus, it can also
be used for the study of isolator materials. In addi-
tion to the imaging capabilities, AFM can inherently
quantify nanoscale forces at the atomic scale (Heile
et al., 2021).
From a data science perspective, SPM techniques
can deliver data with three and more dimensions:
Spectroscopy (1D), image (2D), or volume data (3D)
are among the most common data types. While 1D
and 2D data can be visualised with conventional non-
stereoscopical projection techniques, the examination
of 3D volume data proves to be particularly unintu-
itive and incomplete. A common method is to inves-
tigate only 2D sections from the 3D dataset, which
are received by clipping the sets along their principal
axes (X,Y , Z). Therefore, it is almost impossible to
understand the dataset in context. Another problem is
Heitkamp, D., Lorenz, J., Koall, M., Rahe, P. and Lensing, P.
An Immersive Feedback Framework for Scanning Probe Microscopy.
DOI: 10.5220/0011653400003417
In Proceedings of the 18th International Joint Conference on Computer Vision, Imaging and Computer Graphics Theory and Applications (VISIGRAPP 2023) - Volume 1: GRAPP, pages
179-187
ISBN: 978-989-758-634-7; ISSN: 2184-4321
Copyright
c
2023 by SCITEPRESS – Science and Technology Publications, Lda. Under CC license (CC BY-NC-ND 4.0)
179
the level of abstraction. Datasets obtained by SPM of-
ten represent a surface of a few nanometers (Giessibl
et al., 2000); yet, there is no natural interaction con-
cept for surfaces of that size for volume data inspec-
tion. Last, it is very important to note that SPM image
(2D) data are commonly represented in colour-coded
form: a user-defined range of the physical measure-
ment values is mapped to a colour gradient and rep-
resented in pixel-wise form, which offers the human
eye an impression of the different physical properties.
Still, further human senses could be involved in the
data inspection in order to increase the data accessi-
bility.
Our system contributes an enhanced visual rep-
resentation and direct haptic evaluation of recorded
datasets to the SPM-domain, while also supporting
Virtual Reality (VR). Thus creating an immersive ex-
perience and a previously unexplored possibility of
intuitive data analysis. To achieve this, the data is vir-
tually scaled to many times its real size. This enables
natural interaction and investigation in the virtual en-
vironment (VE). Our real-time application utilizes the
Unity Engine. As a haptic feedback device we suggest
the 3D Systems Touch X (Touch X). The device offers
a workspace of 160 x 120 x 120 mm and a maximum
exertable force of 7.9 newton (N) (3D Systems, 2022).
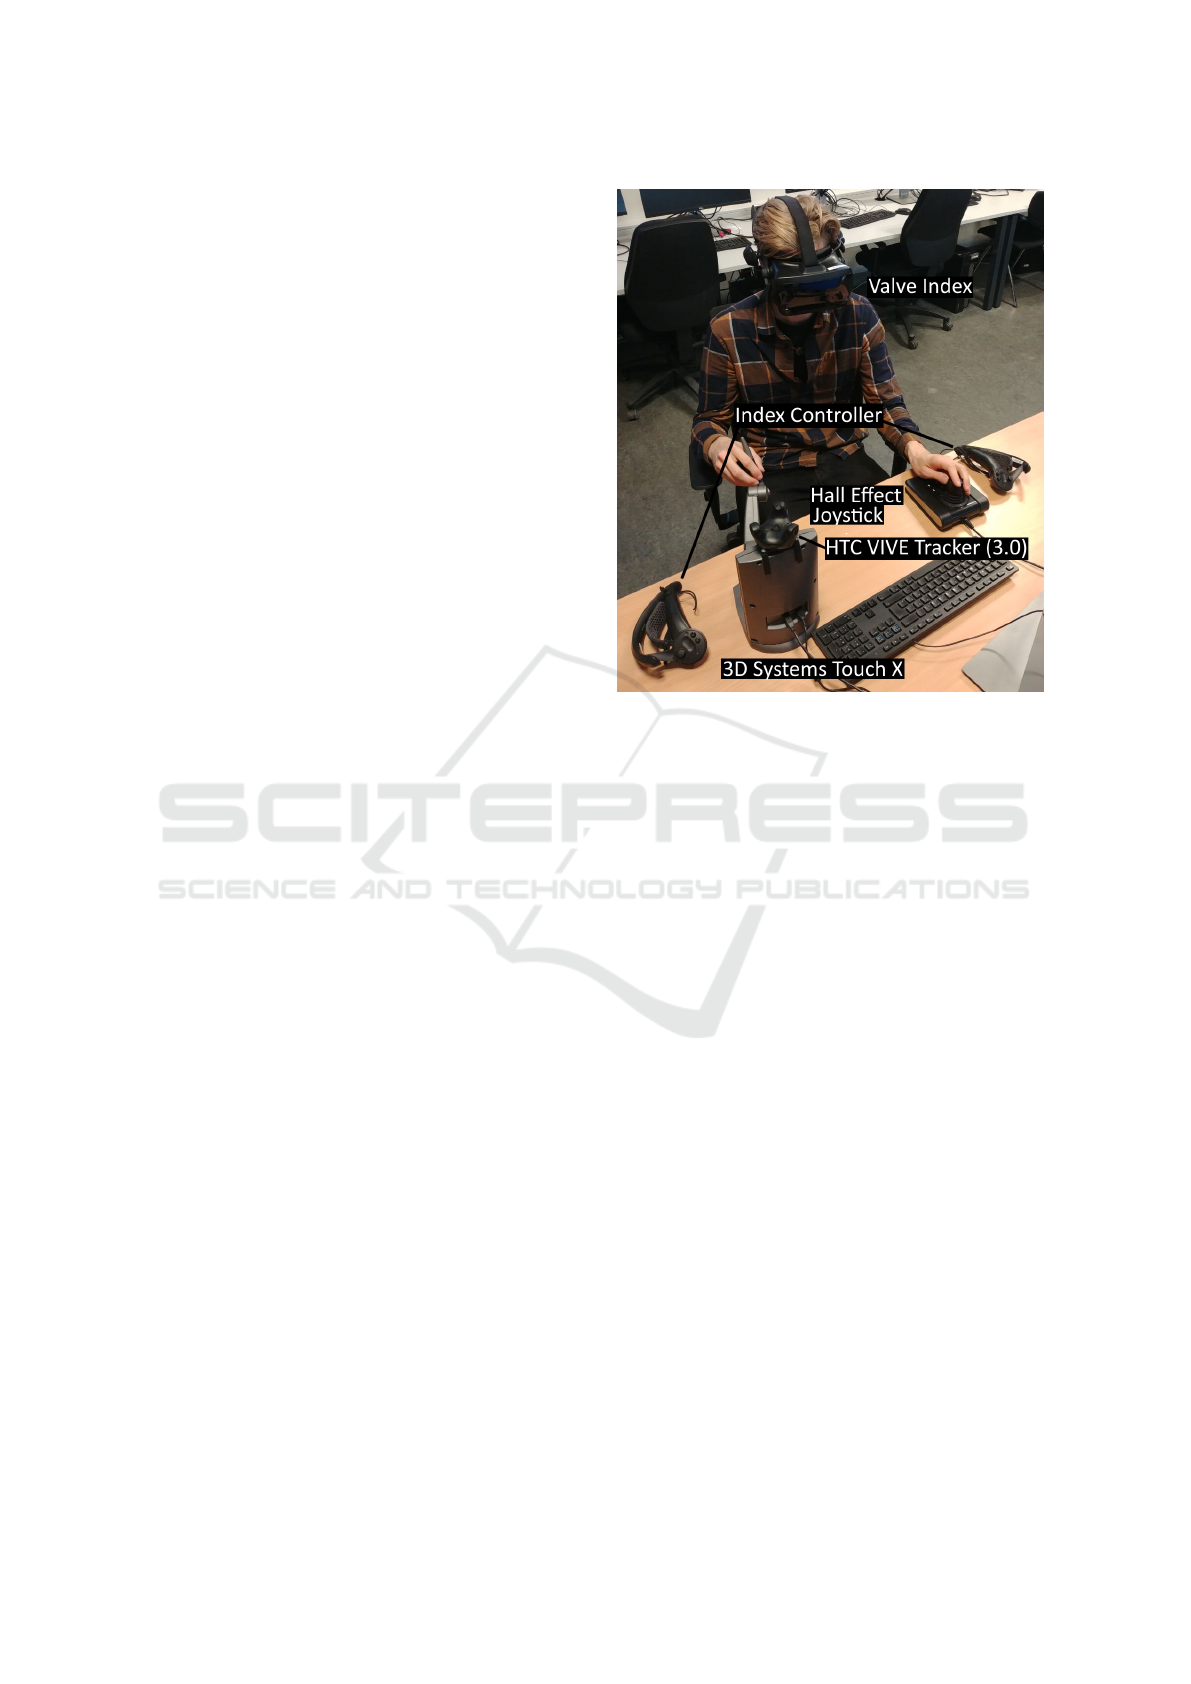
Due to the size of the workspace, our application uses
additional input devices to move and scale the repre-
sentation of the dataset in the VE. Our setup uses a
hall effect joystick and motion controller for this, but
other devices are also possible for these tasks. Fig-
ure 1 shows our experimental setup.
As head-mounted display (HMD) we use a Valve
Index with Index controllers as motion controllers.
The HMD and the motion controllers use the Light-
house tracking system, a marker-based inside-out sys-
tem. The advantage of this tracking over other sys-
tems is that it is an open system and additional devices
can be added via so-called trackers (Taffanel et al.,
2021).
In summary our approach includes the following
contributions:
1. A proposal for a new framework in order to
present SPM data in an interactive immersive
multi-input environment.
2. Four different haptic models for intuitive haptic
feedback of SPM data.
3. A real-time rendering framework for stereoscopic
data visualization for both 2D and volumetric
data.
The paper is organized as follows. After the intro-
duction there is a summary of related work, divided
into work on general haptic feedback and work in the
Figure 1: A photograph of our setup. Showing the Valve
Index, the Index controllers, the hall effect joystick and the
3D Systems Touch X with an HTC VIVE Tracker (3.0).
field of SPM. Section 3 gives an overview of the en-
tire system, including the actual application, the in-
dividual subsystems and components. Followed by
a brief overview of the visualization types supported
by our application. Thereafter in section 5 we focus
on the haptic feedback. The section covers different
feedback models for image and volume data. This is
preceded by a summary of the interaction concepts.
Lastly, we conclude and provide an overview of fu-
ture enhancements of our system in section 7.
2 RELATED WORK
The use of force feedback devices to augment visual
data with tactile feedback is a broad area of research.
Therefore, we divide the related work into approaches
that introduce techniques for haptic reinterpretation of
general datasets and then focus on work in the SPM
domain.
Burdea (Burdea, 1999) studied the possibilities
of haptic feedback for VR in 1999 and Maclean
(Maclean, 2000) investigated the best usage of haptic
feedback in interactive applications. In 2007 Huang
et al. (Huang et al., 2007) explored the utilization
of haptic and visual feedback in a simple object ma-
nipulation task. The authors used a VE and the par-
ticipants performed far better when haptic feedback
was available. The usage of haptic feedback in VR in
GRAPP 2023 - 18th International Conference on Computer Graphics Theory and Applications
180
order to enhance user performance in the domain of
the manufacturing industry was subject of the work of
Abdul Aziz and Mousavi (Abdul Aziz and Mousavi,
2009). An interactive device was introduced by Siu
et al. (Siu et al., 2017). They created a mobile table-
top shape display for tangible and haptic interaction
in 2017. The display is called shapeShift and has a
7 mm resolution. It can show moving objects and
provide both vertical and lateral kinesthetic feedback.
They also introduced a use case to explore volumet-
ric datasets. Steed et al. (Steed et al., 2021) created
a prototype of a mechatronic shape display based on
auxetic materials in 2021. Their implementation uses
nine actuators on a 220 mm square section of mate-
rial. The fabric bends in multiple directions, creating
a surface which feels smooth and rigid to the touch.
In 2003, Rubio-Sierra et al. (Rubio-Sierra et al.,
2003) introduced a haptic feedback interface with a
force feedback joystick for an AFM nanomanipulator.
The joystick controls the position of the AFM probe
with nanometer accuracy and it provides the user with
real-time feedback for the interaction between tip and
sample. Ladjal et al. (Ladjal et al., 2009) developed a
realistic visual and haptic feedback simulator for real-
time cell indentation in 2012. They used the Phantom
Omni (now 3D Systems Touch) as haptic input de-
vice. Another interesting approach with the Touch X
(formerly Geomagic Touch X) was introduced by Al-
abdulmuhsin (Alabdulmuhsin, 2015) in 2015, he pub-
lished a thesis about a force feedback haptic interface
for AFM.
Unlike the aforementioned work, our application
works with previously scanned data instead of di-
rectly controlling the SPM. Furthermore, in addition
to the haptic feedback, the data is displayed using the
common and widely accepted Unity Engine, which
improves the expandability of our approach.
3 SYSTEM OVERVIEW
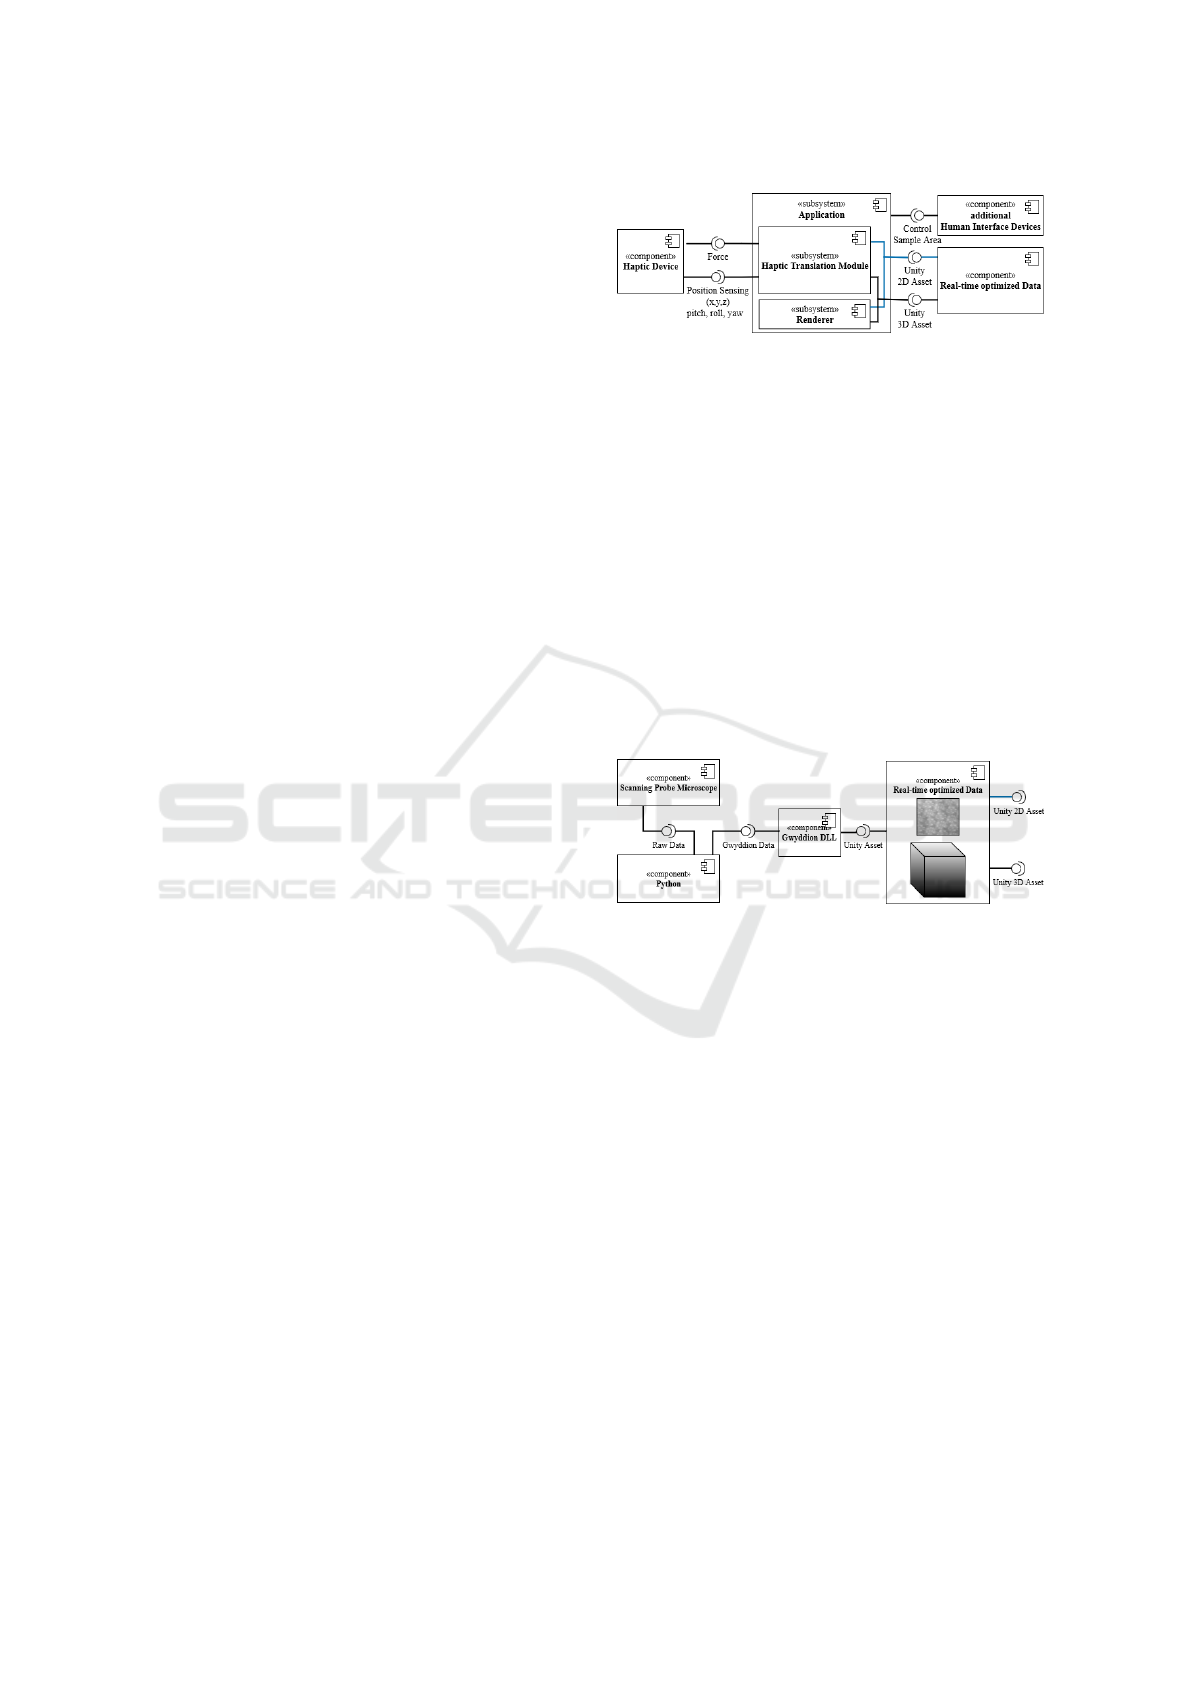
Our system consists of four major parts: (1) the ac-
tual application, (2) the SPM data used, (3) the hap-
tic device and (4) additional human interface devices
(HID). Figure 2 provides an overview of the compo-
nents and the interfaces between them. The applica-
tion processes Unity 2D or 3D Assets, data from the
haptic device, and inputs from other devices. After
processing the current data from the haptic device and
the additional HIDs, the force magnitude and direc-
tion is sent to the haptic device (in our case the Touch
X and addional HID in form of a hall effect joystick
and motion controller).
Figure 2: System component diagram.
3.1 Unity Assets
Using the SPM, a sample is scanned and saved either
as an image or volume dataset. A Python or Matlab
script may be used to transfer the datasets to the so-
called Gwyddion file format. Gwyddion is an open-
source software with its native file format (Ne
ˇ
cas and
Klapetek, 2012). Since the software is very common
among SPM scientists, our application supports the
import of Gwyddion files for visualization and haptic
purposes, while wrapping a C library that is part of
the Gwyddion project. Afterwards, the files are saved
in a native Unity format, so that they can be used in
real-time. Figure 3 shows the entire process from data
obtained by SPM to real-time capable Unity Engine
assets.
Figure 3: Import workflow component diagram.
3.2 Real-Time Application
The application subsystem is illustrated in Figure 4. It
can be devided in two main components, the renderer
and the Haptic Translation Module (HTM). The ren-
derer is responsible for the visualization of the Unity
assets. Our HTM calculates and transmits the force
to the haptic device based on the current inputs, the
selected feedback model, and Unity asset. Thus both
components require a certain Unity asset. In addition
to these components, there are other modules that also
manage e. g. input, sound, and physic, but we stay in
focus on the renderer and the HTM, since these make
the contribution for this paper.
3.3 Haptic Translation Module (HTM)
A component-based overview of our HTM is depicted
in Figure 4. The virtual probe position of the haptic
device is used in relation to the position of the vir-
tual data representation within the application to cal-
An Immersive Feedback Framework for Scanning Probe Microscopy
181
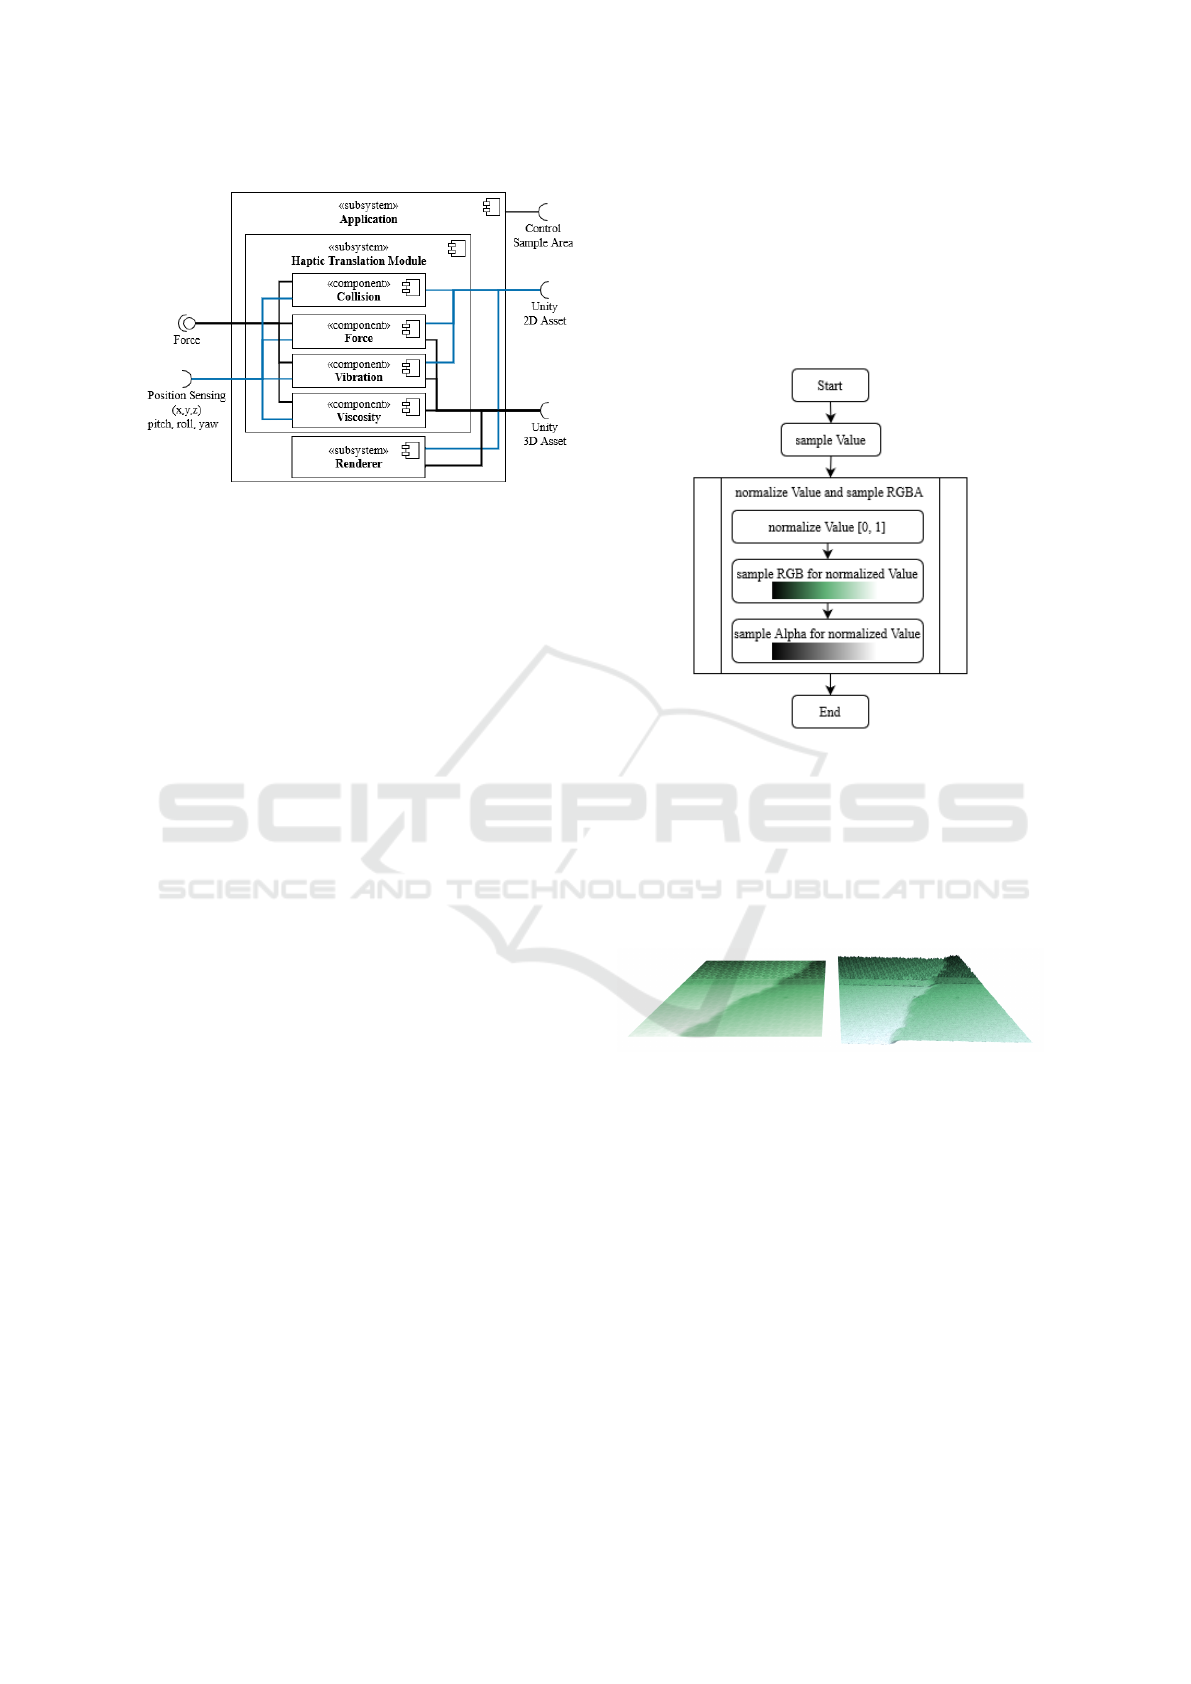
Figure 4: Application component diagram.
culate intensity and other parameters for the respec-
tive feedback model. For this purpose, it is necessary
to obtain the probe position of the haptic device and
to send the parameters to the device. Depending on
whether image or volume data is analyzed, different
haptic models are available, thus the feedback com-
ponents require a corresponding Unity 2D or 3D as-
set. In addition, the components depend on data from
the haptic device. Each feedback component offers
a force magnitude and direction based on the actual
inputs and the loaded Unity asset.
3.4 Renderer
In addition to haptic feedback, the data is also dis-
played in the VE for orientation and visual examina-
tion. The application utilizes Unity’s Built-in Render
Pipeline.
To render something in Unity, it is necessary to
provide information that describe the shape and the
appearance of the surface. Meshes are used to de-
scribe shapes, and materials are used to describe the
appearance. Materials always refer to a shader object.
Shaders perform calculations that determine the color
of pixels on the screen.
Unity does not inherently provide shaders suitable
for displaying SPM datasets. Therefore, we had to
develop our own shaders.
4 VISUALIZATION
We implemented different visualization variants for
image and volume data, which are described in detail
below.
4.1 2 D SPM Data
The usual way to present a 2D SPM dataset in an ap-
plication is as a colored image. The data is normal-
ized and rendered via separate transfer functions for
RGB and alpha (Ljung et al., 2016), The process is
illustrated in Figure 5.
Figure 5: The process to render image datasets.
However, there is an alternative way of visualiza-
tion which utilizes a displacement mapping technique
to visualize the image data as a terrain (Karhu, 2002).
Interpreting the data as a height profile enhances the
analysis of the data in 3D and benefits especially from
the stereoscopic display. Figure 6 presents both visu-
alizations of an image dataset.
Figure 6: Image data comparison between flat (left) and ter-
rain representation (right). With transfer function Olive for
RGB. The used dataset is PTCDA on Ag(111).
4.2 3 D SPM Data
In our application, the volume data is represented as
cuboids (Weiss and Navab, 2021). The aspect ratio of
the cuboid corresponds to the aspect ratio of the actual
data. The visualization uses a ray marching method.
Our adaption of the ray marching technique includes
the comparison of the value with a threshold and is
shown in Figure 7.
This is the common technique for volume ren-
dering (Galin et al., 2020). The method is based
on Hart’s sphere tracing, published in 1995 (Hart,
1995) and Drebin et al.’s Volume Rendering pub-
GRAPP 2023 - 18th International Conference on Computer Graphics Theory and Applications
182
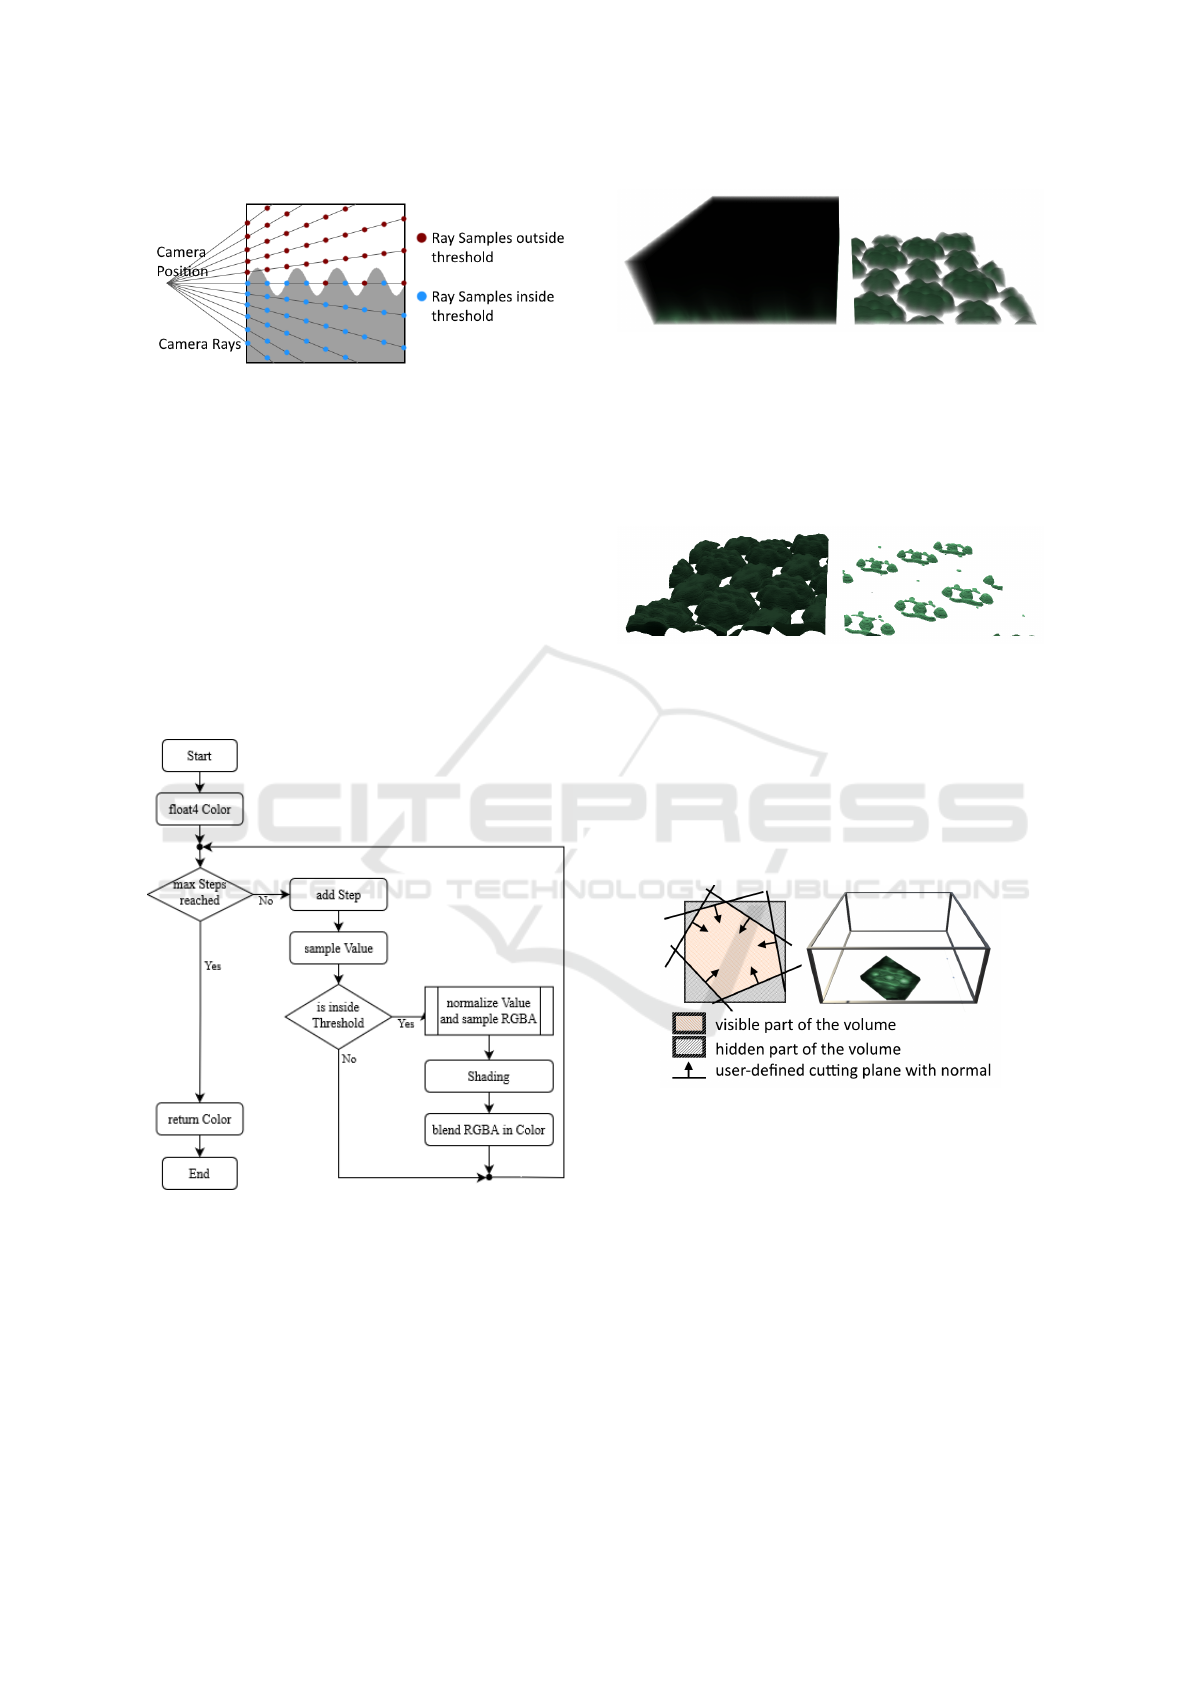
Figure 7: Ray Marching for SPM data with threshold.
lished in 1998 (Drebin et al., 1988). Ray March-
ing demands more computational power than com-
mon rasterization-based rendering techniques, since
its performance is heavily related to the virtual cam-
era resolution. Also it is dependent on the camera po-
sition. In VR, two cameras are used, each rendering
a high-resolution image for the respective eye. This
makes the technique particularly expensive for VR
applications, and correspondingly powerful hardware
is required.
As with image data, the data is then normalized
and rendered using transfer functions. The complete
rendering process is shown in Figure 8.
Figure 8: The process to render volumetric datasets.
Figure 9 presents a rendered volume dataset using
ray marching with and without a threshold value and
applied transfer functions.
In addition to the threshold representation, we
have created further visualizations to analyze the vol-
ume data. One visualization variant is an extension
of the threshold value, where only data representing
a certain value is visualized, resulting in visualization
of an isosurface. The visualization linearly interpo-
Figure 9: Volume data rendered without (left) and with
(right) threshold value (5.282411e-10). With transfer func-
tion Olive for RGB and alpha value 0.1. The used dataset is
PTCDA on Ag(111).
lates between values to find matches. The result of
this rendering technique is visible in Figure 10. The
method also uses a modified ray marching technique.
Figure 10: Exact value (5.282411e-10, 1.648464e-09) visu-
alization of a volume dataset. With transfer function Olive
for RGB. The used dataset is PTCDA on Ag(111).
Another ray marching variant is the convex visu-
alisation, where the user can place up to six planes in
the VE to cut off insignificant parts of the rendered
volume. The method is described in Figure 11. This
visualization offers the possibility to analyze a certain
part of the volume data.
Figure 11: Convex visualization.
The slice visualization described in Figure 12 is
also a valuable visualization variant. The user can
move one or more planes within the VE to visualize
only the overlapping part of the volume. This visual-
ization doesn’t use ray marching and is therefore sig-
nificantly more performant than the other variants and
thus also suitable for weaker hardware.
All these visualizations are real-time capable and
also work in VR.
An Immersive Feedback Framework for Scanning Probe Microscopy
183
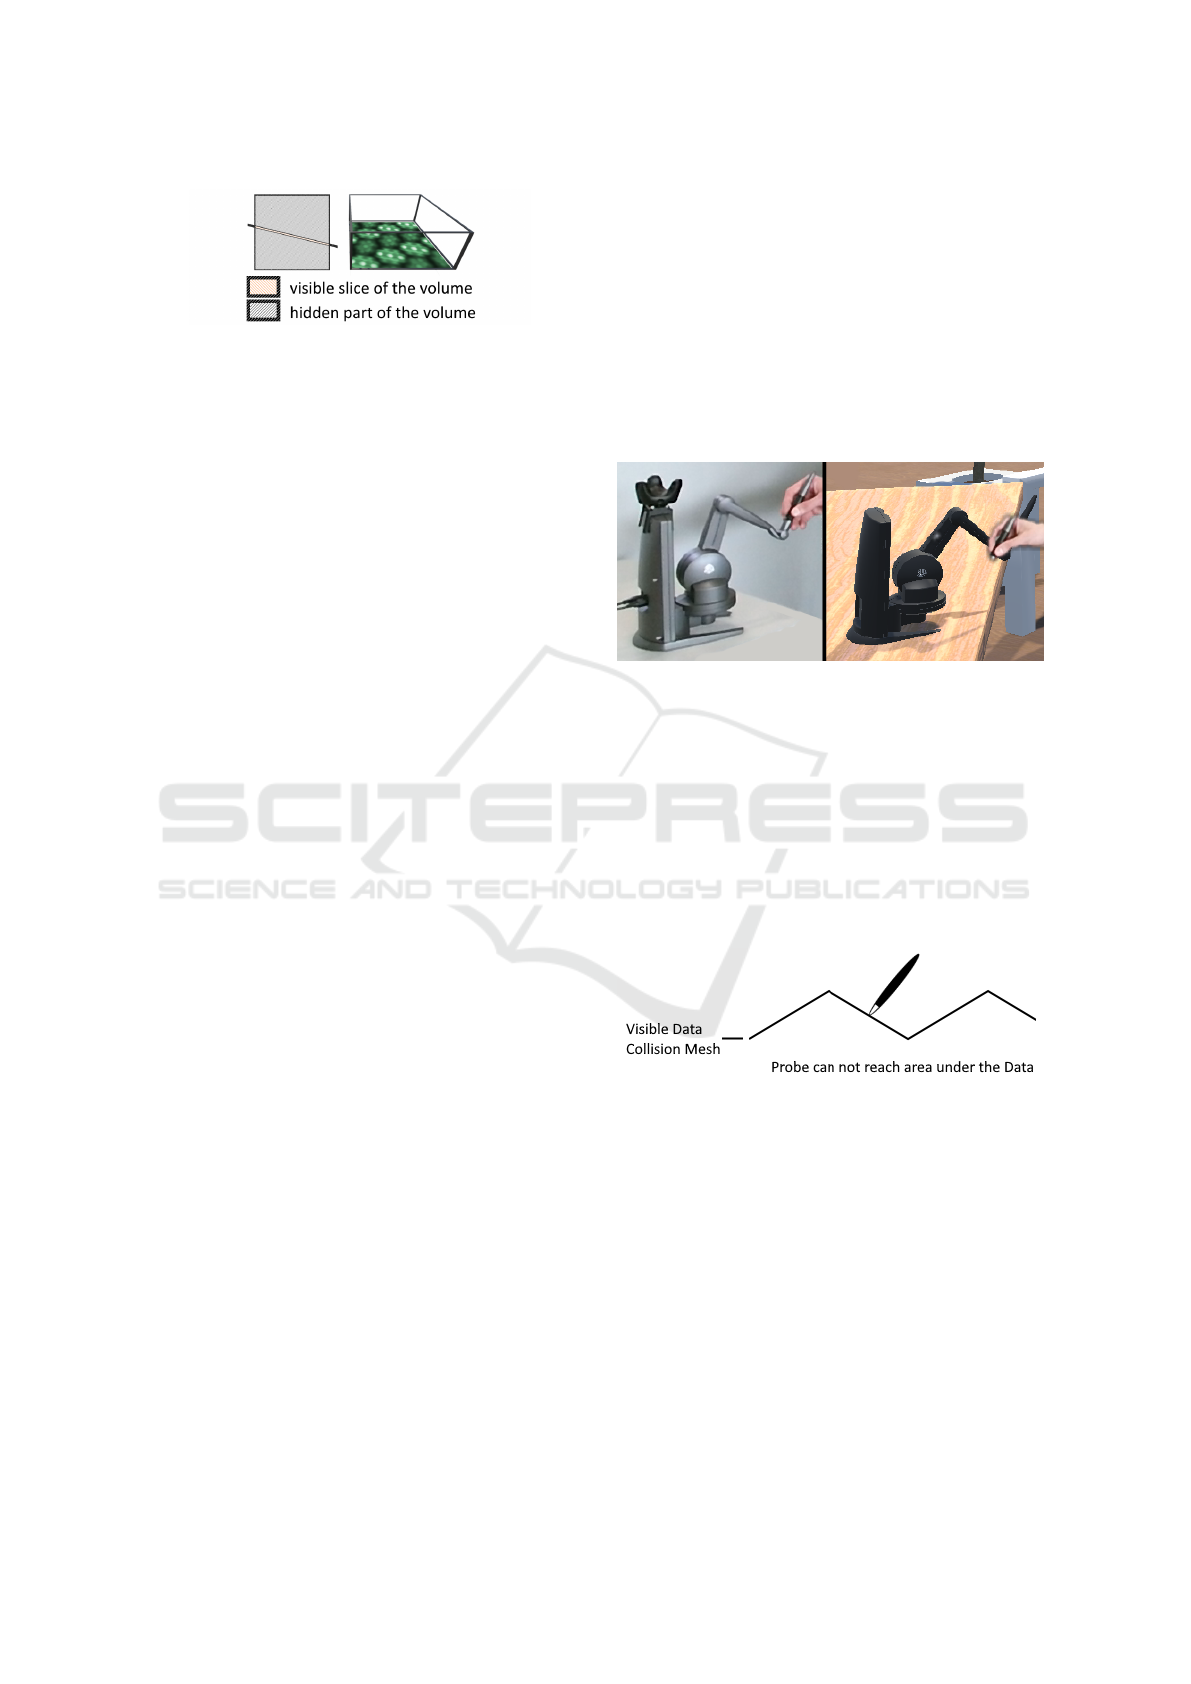
Figure 12: Slice visualization.
4.3 Transfer Function
The transfer functions are seperated for RGB and al-
pha. Due to the popularity of the Gwyddion soft-
ware among SPM scientists, we decided to support
the Gwyddion format for the RGB transfer functions
as well. Thus user can use their usual transfer func-
tions, which simplifies the analysis of the data. Any
grayscale image can be used for the alpha transfer
function.
5 HAPTIC FEEDBACK
The application supports four unique feedback mod-
els: collision, force, vibration and viscosity.
While the collision model prevents the stylus
probe e. g. from a Touch X device from penetrat-
ing a measured surface by a rapid counter force, the
force model will instead apply a smoothly in- or de-
creasing force in correspondence to the distance to a
certain point on the surface. This in- and decreas-
ing intensity field is also used to control the vibration
feedback. The viscosity model emulates a resistance
force that is related to a physical fluid with a certain
viscosity. The different models are further descripted
in depth in the following sections.
5.1 Haptic Device
To achieve the different feedback models, the soft-
ware uses the Haptics Direct plugin from 3D Systems
for Unity. It supports the 3D Systems Touch (formerly
Geomagic Touch / Phantom Omni), the 3D Systems
Touch X (formerly Geomagic Touch X / Phantom
Desktop), and Phantom Premium models. Our test
setup uses the Touch X, but the other mentioned hard-
ware should also be supported.
The device has a maximum exertable force of 7.9
N and a continuous exertable force of over 1.75 N.
It should be mentioned that although the device can
apply a force of 7.9 N, this is only for a fairly short
time. In practical tests, the 1.75 N therefore proved
to be more reliable and sufficient for a long-lasting
force. In addition, the workspace is not large enough
(160 x 120 x 120 mm) to accurately examine a data
set at high resolution (3D Systems, 2022). To solve
this problem, additional input devices (joystick, mo-
tion controller) are used to change the position and
scale of the dataset in the virtual environment. The
Touch X is based on a device developed by Massie
and Salisbury in 1994 (Massie and Salisbury, 1994).
To determine the position of the haptic device at
runtime within the VE, it is necessary to connect the
Touch X to a compatible tracker. These are available
from different manufacturers, in our case it is an HTC
VIVE Tracker (3.0), Figure 13.
Figure 13: Left: The 3D Systems Touch X with an HTC
VIVE Tracker (3.0). Right: The virtual device tracked in
the VE.
5.2 Collision
The collision feedback can only be applied to image
data and should only be used in conjunction with ter-
rain visualization. The functioning of the collision
feedback can be seen in Figure 14. The haptic de-
vice tries within its capabilities to prevent the virtual
device from penetrating the dataset.
Figure 14: Collision feedback for image datasets.
The collisions are generated by the Haptics Direct
plugin and Unity’s physics engine. Contact points are
generated based on the collision mesh and the plu-
gin evaluates the reachable area based on them. The
applied force is in tangent space in surface normal di-
rection.
5.3 Force and Vibration
The force and vibration models can be used with im-
age and volumetric data. For the image data, the in-
tensity of the force and vibration feedback is calcu-
lated based on the distance from the displayed sur-
face. The principle is illustrated in Figure 15. The
GRAPP 2023 - 18th International Conference on Computer Graphics Theory and Applications
184
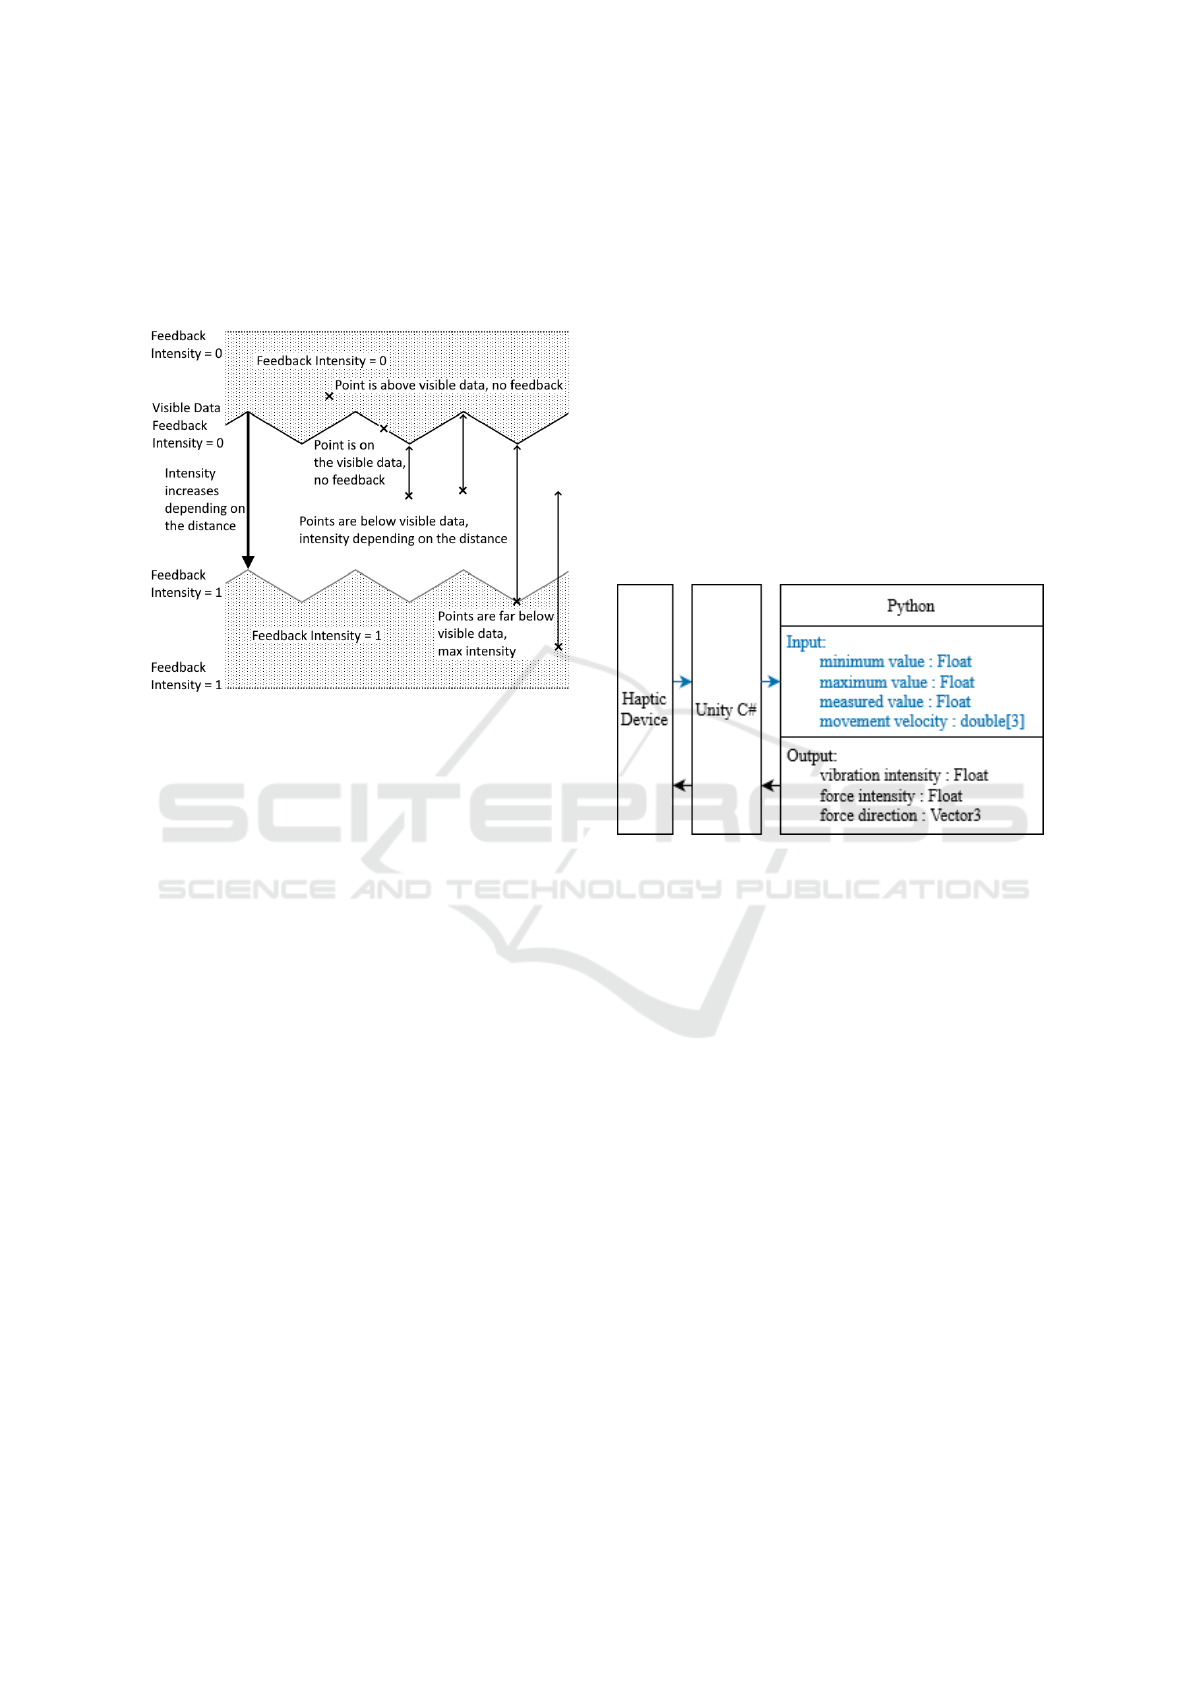
further the virtual device is below the dataset, the
stronger the feedback becomes. After a certain point,
the limitations of the device make it impossible to in-
crease the intensity any further. The force is always
directed upwards.
Figure 15: The determination of feedback intensity by force
and vibration for image datasets.
For the volume datasets, the intensity for the force
and vibration feedback is calculated via the deviation
of the value at the sensing position from the target
value. Several transfer functions have been developed
for the determination of the intensity. The First Ap-
proach increases the intensity when the current value
is lower than the intended value. Another transfer
function increases the intensity at higher deviation
from the target value. The last approach increases the
intensity at lower deviation from the searched value.
The direction of the force is always upwards. For the
second variant, this pushes the haptic device to the
threshold value. In the third variant, the haptic device
is pushed away from the desired value.
5.4 Viscosity
Viscosity feedback is only available for volumes. The
effect is achieved by setting a force that acts against
the user in any direction. The applied force is calcu-
lated with a transfer function and the value at the par-
ticular position inside the volume. Formula 1 displays
the calculation of the force.
⃗
F = c(−⃗v)x (1)
The value c ∈ [0, 1] can be set by the user at run-
time to adjust the maximum force and ⃗v is calculated
by the Haptics Direct plugin based on previous move-
ments. The last step is to multiply with x ∈ [0, 1],
that is the normalized sampled value at the actual
probe position, thus creating a stronger counterforce
at higher values.
5.5 Python Interface
In addition to the already available haptic models it
is possible for the researchers to create new effects at
runtime. For this reason, a Python interface for the
application was developed. The application includes
IronPython, which supports Python 3.4 and includes
libraries and default Python scripts to calculate the
intensity. It is also possible to install additional li-
braries, with some restrictions. The Python interface
is shown in Figure 16. The input and output of the
interface are predefined and given by the application.
Figure 16: Overview of the Python interface.
In addition to the actual value, the minimum and
maximum values are also provided to the researchers.
These are necessary, for example, to interpolate the
value within the limits. The velocity can be used to
create interesting effects like the viscosity.
Such a haptic model can be easily created by the
researcher in order to meet certain requirements, that
were not yet foreseeable during development of the
application. All changes to the Python script are ap-
plied directly to the runtime environment without the
need to rebuild the application nor further program-
ming knowledge.
Another benefit of the Python interface are
changeable transfer functions, which are used by the
haptic models to determine the intensity of the feed-
back. Instead of creating new haptic models the re-
searcher can change and manipulate the used trans-
fer function for the predefined haptic models (force,
vibration and viscosity) at runtime with the same
Python interface.
An Immersive Feedback Framework for Scanning Probe Microscopy
185
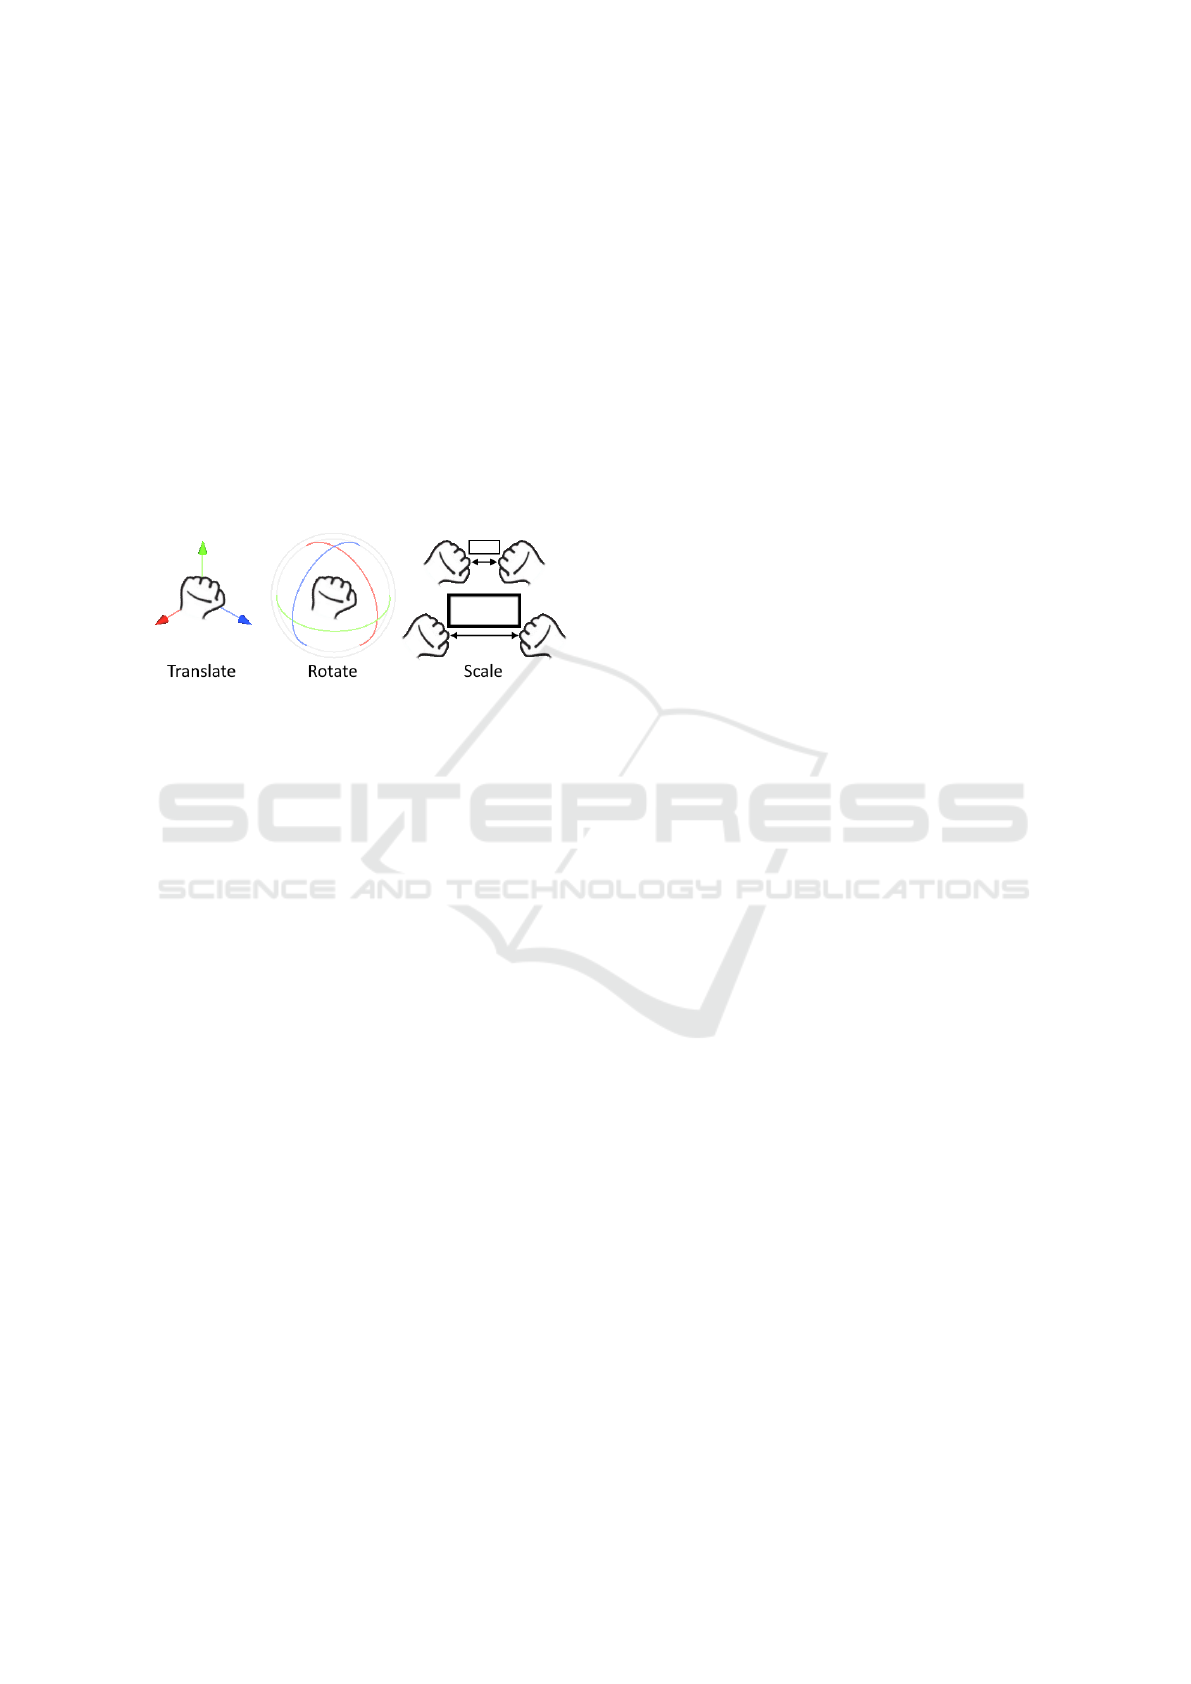
6 INTERACTION
The user can manipulate the datasets at runtime in
VR. The application supports motion controller to
move, rotate and scale the virtual representation of
the dataset in VR in an intuitive way as shown in
Figure 17. Translation and rotation can be achieved
by one hand grabbing the dataset, then the user can
move or rotate the dataset, afterwards the dataset can
be released to stop the manipulation. Scaling requires
two motion controller. The researcher must grip the
dataset with both hands. Then it is possible to move
the hands towards or away from each other to scale
the dataset down or up.
Figure 17: Hand interactions.
It is also possible to manipulate the dataset with
a hall effect 3DoF joystick. This type of interaction
is less intuitive, but could be more precise than the
direct interaction with ”floating” motion controllers.
Buttons are used to switch between translate, rotate
and scale modes, after which the virtual dataset can
be changed separately on the axes using the joystick.
One clear advantage of the joystick interaction is
that it can also be used without VR. This means that
researchers do not have to learn different operating
concepts for VR and for running the application on
an ordinary monitor.
Another way of interaction is to change the render
parameters at runtime. As mentioned in the previous
sections, the data is normalized during visualization,
as default values the application uses the minimum
and maximum value of the dataset for normalization.
These can also be adjusted at runtime to use the full
resolution of the RGBA transfer functions for a subset
of the data. Other values that can be changed by the
researcher at runtime are the threshold value and the
searched value for the exact value visualization.
7 CONCLUSION
While the application is still work in progress, we al-
ready observed positive impacts on interacting with
SPM datasets. The application allows image and vol-
ume datasets to be analyzed haptically and stereo-
scopically and has added value compared to a purely
2D visual examination. As common in SPM data
analysis.
The feedback for the visualizations was positive.
In the case of 2D datasets, the visualization as ter-
rain has been particularly well received. For the 3D
datasets the result is not so clear, in the tests so far
each visualization was popular and it seems like it de-
pends more on the specific dataset which visualization
is more suitable.
The haptic feedback was found to be helpful. For
image data, the force model was the most convinc-
ing, because this seems to be most realistic for the
users. The vibration was also perceived as positive,
but was less popular. The collision model was found
to be interesting, but was less relevant for practical
tasks. However, this model becomes increasingly in-
teresting when considering the context of teaching,
where students can actually sense the nanostructured
surfaces. This could lead to better and more sustain-
able nanoscience education.
The feedback for the volume data was also posi-
tive. However, there is no clear favorite here. What
was surprising here was that vibration was also rated
as useful for certain applications. This is particularly
interesting since this can already be implemented with
inexpensive devices. For the calculation of the inten-
sity, the approach with increasing intensity at higher
deviation is more popular than the other approaches.
Despite the positive feedback, there are still ideas
for improvements. An enhancement would be a min-
imap that the user can use to navigate themselves
within the data. In addition, it is planned to be able to
control the SPM directly and remotely in the future.
Further potential for improvement exists in the cre-
ation of digital twins for the HIDs. While the Touch X
is already visually represented in the virtual environ-
ment, this feature is missing on other HIDs, that a re-
searcher might use. To solve this problem, we are cur-
rently experimenting with visualizing the real work-
place as a point cloud in the virtual environment. An-
other approach is the spatial registration of the HIDs
through optical tracking techniques. Regardless of the
potential for improvement, the application has already
proven useful in initial practical tests.
ACKNOWLEDGEMENTS
The authors acknowledge the financial support of the
BMBF, Grant No. 16SV8549.
GRAPP 2023 - 18th International Conference on Computer Graphics Theory and Applications
186

REFERENCES
3D Systems, I. (2022). Specifications — 3D Sys-
tems. http://3dsystems.com/haptics-devices/touch-x/
specifications. [Online; accessed 10-June-2022].
Abdul Aziz, F. and Mousavi, M. (2009). A review of haptic
feedback in virtual reality for manufacturing industry.
Journal of Mechanical Engineering, 40:68.
Alabdulmuhsin, A. (2015). A force feedback haptic in-
terface for atomic force microscopy. Master’s thesis,
Missouri University of Science and Technology.
Albrecht, T. R., Gr
¨
utter, P., Horne, D., and Rugar, D.
(1991). Frequency modulation detection using high-q
cantilevers for enhanced force microscope sensitivity.
Journal of Applied Physics, 69(2):668–673.
Bian, K., Gerber, C., Heinrich, A. J., M
¨
uller, D. J., Scheur-
ing, S., and Jiang, Y. (2021). Scanning probe mi-
croscopy. Nature Reviews Methods Primers, 1.
Binnig, G., Quate, C. F., and Gerber, C. (1986). Atomic
force microscope. Phys. Rev. Lett., 56:930–933.
Binnig, G., Rohrer, H., Gerber, C., and Weibel, E. (1982).
Surface studies by scanning tunneling microscopy.
Phys. Rev. Lett., 49:57–61.
Burdea, G. (1999). Haptic feedback for virtual reality. Pro-
ceedings of International Workshop on Virtual Proto-
typing, pages 17–29.
Drebin, R. A., Carpenter, L., and Hanrahan, P. (1988).
Volume rendering. SIGGRAPH Comput. Graph.,
22(4):65–74.
Galin, E., Gu
´
erin, E., Paris, A., and Peytavie, A. (2020).
Segment Tracing Using Local Lipschitz Bounds.
Computer Graphics Forum.
Giessibl, F. J., Hembacher, S., Bielefeldt, H., and Mannhart,
J. (2000). Subatomic features on the silicon (111)-
(7×7) surface observed by atomic force mi-
croscopy. Science, 289(5478):422–425.
Gross, L., Schuler, B., Pavli
ˇ
cek, N., Fatayer, S., Ma-
jzik, Z., Moll, N., Pe
˜
na, D., and Meyer, G. (2018).
Atomic force microscopy for molecular structure elu-
cidation. Angewandte Chemie International Edition,
57(15):3888–3908.
Hart, J. (1995). Sphere tracing: A geometric method for the
antialiased ray tracing of implicit surfaces. The Visual
Computer, 12.
Heile, D., Olbrich, R., Reichling, M., and Rahe, P.
(2021). Alignment method for the accurate and pre-
cise quantification of tip-surface forces. Phys. Rev. B,
103:075409.
Huang, F., Gillespie, B., and Kuo, A. (2007). Visual and
haptic feedback contribute to tuning and online con-
trol during object manipulation. Journal of motor be-
havior, 39:179–93.
Karhu, K. (2002). Displacement mapping. In: Helsinki
University of Techonology, Tik-111.500 Seminar on
computer graphics.
Ladjal, H., Hanus, J.-L., Pillarisetti, A., Keefer, C., Fer-
reira, A., and Desai, J. (2009). Realistic visual and
haptic feedback simulator for real-time cell indenta-
tion. In IEEE/RSJ International Conference on Intel-
ligent Robots and Systems, pages 3993 – 3998, Taipei,
China.
Ljung, P., Kr
¨
uger, J., Groller, E., Hadwiger, M., Hansen,
C. D., and Ynnerman, A. (2016). State of the art in
transfer functions for direct volume rendering. Com-
put. Graph. Forum, 35(3):669–691.
Maclean, K. (2000). Designing with haptic feedback. Pro-
ceedings - IEEE International Conference on Robotics
and Automation, 1:783–788.
Massie, T. and Salisbury, J. (1994). The phantom haptic
interface: A device for probing virtual objects. Pro-
ceedings of the ASME Winter Annual Meeting, Sym-
posium on Haptic Interfaces for Virtual Environment
and Teleoperator Systems, pages 295–300.
Ne
ˇ
cas, D. and Klapetek, P. (2012). Gwyddion: an open-
source software for spm data analysis. Open Physics,
10(1):181–188.
Rubio-Sierra, F., Stark, R., Thalhammer, S., and Heckl, W.
(2003). Force-feedback joystick as a low-cost haptic
interface for an atomic-force-microscopy nanomanip-
ulator. Applied Physics A, 76.
Siu, A. F., Gonzalez, E. J., Yuan, S., Ginsberg, J., Zhao, A.,
and Follmer, S. (2017). Shapeshift: A mobile table-
top shape display for tangible and haptic interaction.
In Adjunct Publication of the 30th Annual ACM Sym-
posium on User Interface Software and Technology,
UIST ’17, page 77–79, New York, NY, USA. Associ-
ation for Computing Machinery.
Steed, A., Ofek, E., Sinclair, M., and Gonzalez Franco, M.
(2021). A mechatronic shape display based on auxetic
materials. Nature Communications, 12(4758 (2021)).
Stipe, B. C., Rezaei, M. A., and Ho, W. (1998). Single-
molecule vibrational spectroscopy and microscopy.
Science, 280(5370):1732–1735.
Taffanel, A., Rousselot, B., Danielsson, J., McGuire, K.,
Richardsson, K., Eliasson, M., Antonsson, T., and
H
¨
onig, W. (2021). Lighthouse positioning system:
Dataset, accuracy, and precision for UAV research.
CoRR, abs/2104.11523.
Weiss, J. and Navab, N. (2021). Deep direct volume ren-
dering: Learning visual feature mappings from exem-
plary images. CoRR, abs/2106.05429.
An Immersive Feedback Framework for Scanning Probe Microscopy
187
