
Estimating Distances Between People Using a Single Overhead Fisheye
Camera with Application to Social-Distancing Oversight
∗
Zhangchi Lu
a
, Mertcan Cokbas
b
, Prakash Ishwar
c
and Janusz Konrad
d
Department of Electrical and Computer Engineering, Boston University, 8 Saint Mary’s Street, Boston, MA 02215, U.S.A.
Keywords:
Distance Estimation, Fisheye, MLP, Deep Learning.
Abstract:
Unobtrusive monitoring of distances between people indoors is a useful tool in the fight against pandemics.
A natural resource to accomplish this are surveillance cameras. Unlike previous distance estimation methods,
we use a single, overhead, fisheye camera with wide area coverage and propose two approaches. One method
leverages a geometric model of the fisheye lens, whereas the other method uses a neural network to predict the
3D-world distance from people-locations in a fisheye image. For evaluation, we collected a first-of-its-kind
dataset, Distance Estimation between People from Overhead Fisheye cameras (DEPOF), using a single fisheye
camera, that comprises a wide range of distances between people (1–58ft) and is publicly available. The
algorithms achieve 20-inch average distance error and 95% accuracy in detecting social-distance violations.
1 INTRODUCTION
The general problem of depth/distance estimation in
3D world has been studied in computer vision from its
beginnings. However, the narrower problem of esti-
mating the distance between people has gained atten-
tion only recently. In particular, the COVID pandemic
has sparked interest in inconspicuous monitoring of
social-distance violations (e.g., less than 6 ft) (Gad
et al., 2020; Gupta et al., 2020; Tellis et al., 2021;
Yeshasvi et al., 2021; Hou et al., 2020; Aghaei et al.,
2021; Seker et al., 2021). A natural, cost-effective re-
source that can be leveraged to accomplish this goal
are the surveillance cameras widely deployed in com-
mercial, office and academic buildings.
Recent methods developed for the estimation of
3D distance have typically used 2 cameras (stereo)
equipped with either rectilinear (Dandil and Cevik,
2019; Huu et al., 2019) or fisheye (Ohashi et al., 2016;
Yamano et al., 2018) lenses. Stereo-based methods,
however, require careful camera calibration (both in-
trinsic and extrinsic parameters) and are very sensi-
tive to misalignments between cameras (translation
and rotation) after calibration. Although methods
a
https://orcid.org/0000-0002-0239-589X
b
https://orcid.org/0000-0002-6531-7653
c
https://orcid.org/0000-0002-2621-1549
d
https://orcid.org/0000-0001-9283-5416
∗
This work was supported by ARPA-E (agreement DE-
AR0000944) and by Boston University Undergraduate Re-
search Opportunities Program.
have been proposed using single rectilinear-lens cam-
era (Gupta et al., 2020; Tellis et al., 2021; Hou et al.,
2020; Seker et al., 2021; Aghaei et al., 2021), that
do not suffer from the above shortcomings, usually
one such camera can cover only a fragment of a large
space. While multiple cameras can be deployed, this
increases the cost and complexity of the system.
In this paper, we focus on estimating the dis-
tance between people indoors using a single over-
head fisheye camera with 360
◦
×180
◦
field of view.
Such a camera can effectively cover a room up to
2,000ft
2
greatly reducing deployment costs compared
to multiple rectilinear-lens cameras. However, fish-
eye cameras introduce geometric distortions so meth-
ods developed for rectilinear-lens cameras are not di-
rectly applicable; the geometric distortions must be
accounted for when estimating distances in 3D space.
We propose two methods to estimate the distance
between people using a single fisheye camera. The
first method leverages a fisheye-camera model and
its calibration methodology developed by Bone et
al. (Bone et al., 2021) to inverse-project location
of a person from fisheye image to 3D world. This
inverse projection suffers from scale (depth) ambi-
guity that we address by using a human-height con-
straint. Knowing the 3D-world coordinates of two
people we can easily compute the distance between
them. Unlike the first method based on camera ge-
ometry, the second method uses the Multi-Layer Per-
ceptron (MLP) and is data-driven. In order to train
the MLP, we collected training data using a large
528
Lu, Z., Cokbas, M., Ishwar, P. and Konrad, J.
Estimating Distances Between People Using a Single Overhead Fisheye Camera with Application to Social-Distancing Oversight.
DOI: 10.5220/0011653100003417
In Proceedings of the 18th International Joint Conference on Computer Vision, Imaging and Computer Graphics Theory and Applications (VISIGRAPP 2023) - Volume 5: VISAPP, pages
528-535
ISBN: 978-989-758-634-7; ISSN: 2184-4321
Copyright
c
2023 by SCITEPRESS – Science and Technology Publications, Lda. Under CC license (CC BY-NC-ND 4.0)

chess mat. For testing both methods, we collected
another dataset with people placed in various loca-
tions of a 72×28-foot room. The dataset includes over
300 pairs of people with over 70 different distances
between them. Unlike other inter-people distance-
estimation datasets, our dataset comprises a wide
range of distances between people (from 1ft to 58ft).
We call this dataset Distance Estimation between Peo-
ple from Overhead Fisheye cameras (DEPOF).
The main contributions of this work are:
• We propose two approaches for distance esti-
mation between people using a single overhead
fisheye camera. To the best of our knowledge no
such approach has been developed to date.
• We created a fisheye-camera dataset for the
evaluation of inter-people distance-estimation
methods. This is the first dataset of its kind that
is publicly available at vip.bu.edu/depof
2 RELATED WORK
In the last two years, spurred by the COVID pan-
demic, many methods have been developed to esti-
mate distances between people. Such methods com-
prise 2 key steps: detection of people in an image, and
estimation of the 3D-world distance between people.
In order to detect people/objects, some methods
(Yeshasvi et al., 2021; Pan et al., 2021) rely on
YOLO, other methods (Tellis et al., 2021; Gupta et al.,
2020) use Faster R-CNN and still other methods (Gad
et al., 2020) use GMM-based foreground detection.
However, this is not the focus of our paper; we assume
that bounding boxes around people are available.
To estimate the distance between detected people,
a number of approaches have emerged that use a sin-
gle camera with rectilinear lens. Some approaches
rely on typical dimensions of various body parts, e.g.,
shoulder width, (Aghaei et al., 2021; Seker et al.,
2021), while others perform a careful camera cali-
bration (Gupta et al., 2020; Hou et al., 2020; Tellis
et al., 2021) to infer inter-person distances. Also,
stereo-based methods (two cameras) have been re-
cently proposed to estimate the distance to a per-
son/object (Dandil and Cevik, 2019; Huu et al., 2019),
but they require very precise camera calibration and
are sensitive to post-calibration misalignments.
Very recently, a single overhead fisheye camera
was proposed to detect social distance violations in
buses (which is a coarser goal than distance esti-
mation), but no quantitative results were published
(Tsiktsiris et al., 2022). Fisheye-stereo is often used
in front-facing configuration for distance estimation
in autonomous navigation (Ohashi et al., 2016; Ya-
mano et al., 2018), but recently it was proposed in
overhead configuration for person re-identification in-
doors based on location rather than appearance (Bone
et al., 2021). To accomplish this, the authors devel-
oped a novel calibration method to determine both in-
trinsic and extrinsic fisheye-camera parameters. We
leverage this study to calibrate our single fisheye cam-
era and we use a geometric model developed therein.
In terms of benchmark datasets for estimat-
ing distances between people, Epfl-Mpv-VSD, Epfl-
Wildtrack-VSD, OxTown-VSD (Aghaei et al., 2021)
and KORTE (Seker et al., 2021) are prime examples.
Out of them only Epfl-Mpv-VSD and KORTE include
some indoor scenes. More importantly, however, all
of them have been collected with rectilinear-lens cam-
eras, and are not useful for our study. Our dataset,
DEPOF, has been specifically designed for the estima-
tion of distances between people using single fisheye
camera indoors under various occlusion scenarios.
3 METHODOLOGY
We focus on large indoor spaces monitored by a sin-
gle, overhead, fisheye camera. An example of an
image captured in this scenario is shown in Fig. 1.
We propose two approaches to measure the distance
between two people visible in such an image. One
method uses a geometric model of a previously cali-
brated camera while the other makes no assumptions
about the camera and is data-driven. Although these
methods are well-known, we apply them in a unique
way to address the distance estimation problem using
a single fisheye camera.
In this work, we are not concerned with the detec-
tion of people; this can be accomplished by any re-
cent method developed for overhead fisheye cameras
such as (Duan et al., 2020; Li et al., 2019; Tamura
et al., 2019). Therefore, we assume that tight bound-
ing boxes around people are given. Furthermore, we
assume that the center of a bounding box defines the
location of the detected person.
Let x
x
x
A
,x
x
x
B
∈ Z
2
be the pixel coordinates of
bounding-box centers for person A and person B, re-
spectively. Given a pair (x
x
x
A
,x
x
x
B
), the task is to esti-
mate the 3D-world distance between people captured
by the respective bounding boxes. Below, we describe
two methods to accomplish this.
3.1 Geometry-Based Method
In this approach, to estimate the 3D-world distance
between two people we adopt the unified spheri-
cal model (USM) proposed in (Geyer and Danilidis,
Estimating Distances Between People Using a Single Overhead Fisheye Camera with Application to Social-Distancing Oversight
529
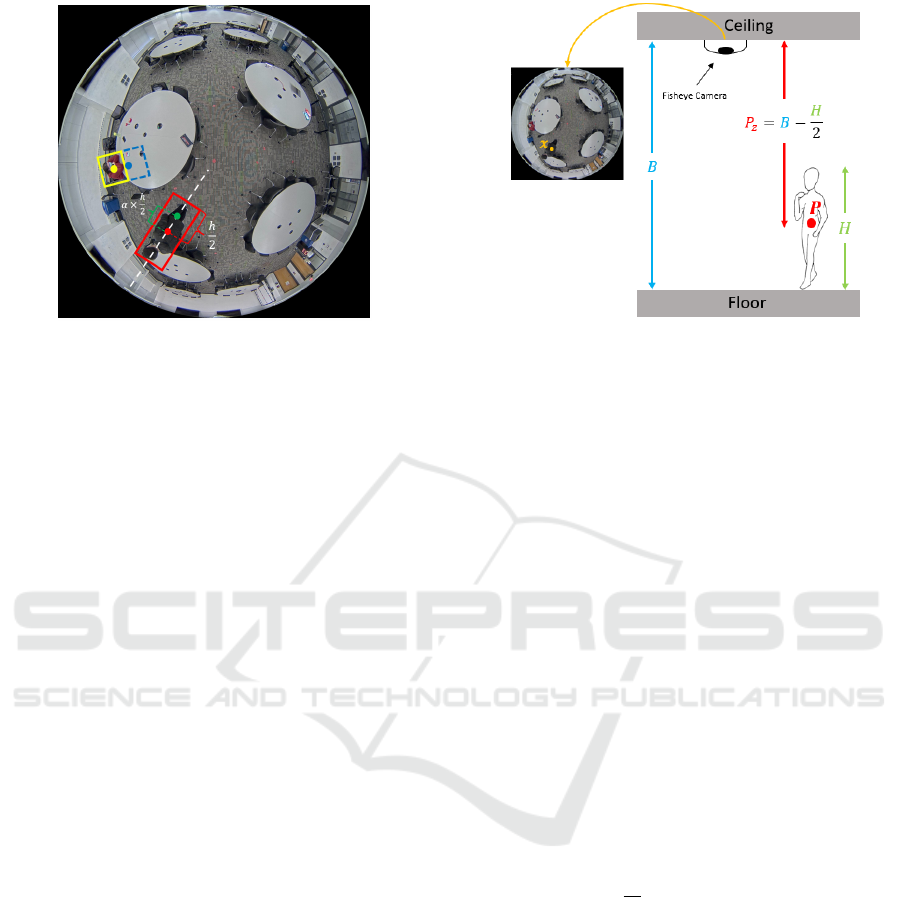
Figure 1: Field of view from an Axis M3057-PLVE camera
mounted on the ceiling of a 72×28 ft
2
classroom and illus-
tration of height adjustment (see Section 3.3 for details).
2001) for fisheye cameras and a calibration method-
ology to find this model’s parameters developed by
(Bone et al., 2021). This model enables the computa-
tion of an inverse mapping from image coordinates to
3D space as described next.
Consider the scenario in Fig. 2 where the center
of the 3D-world coordinate system is at the optical
center of a fisheye camera mounted overhead at height
B above the floor and a person of height H stands on
the floor. Let a 3D-world point P
P
P = [P
x
,P
y
,P
z
]
T
∈ R
3
be located on this person’s body at half-height and let
P
P
P appear at 2D coordinates x
x
x in the fisheye image.
Bone et al. (Bone et al., 2021) showed that the 3D-
world coordinates P
P
P can be recovered from x
x
x with the
knowledge of P
z
and a 5-vector of USM parameters ω
ω
ω
via a non-linear function G:
P
P
P = G(x
x
x,P
z
;ω
ω
ω), (1)
In order to estimate ω
ω
ω, an automatic calibration
method using a moving LED light was developed in
(Bone et al., 2021). In addition to ω
ω
ω, the value of P
z
is
needed since this is a 2D-to-3D mapping. However,
based on Fig. 2 we see that P
z
= B − H/2.
In practice, we can only get a pixel-quantized es-
timate
b
x
x
x of x
x
x from which we can compute an esti-
mate
b
P
P
P of P
P
P using (1). Let
b
P
P
P
A
and
b
P
P
P
B
denote the es-
timated 3D-world coordinates of person A and person
B, respectively, based on the centers of their bounding
boxes
b
x
x
x
A
and
b
x
x
x
B
. Then, we can estimate the 3D-world
Euclidean distance
b
d
AB
between them via:
b
d
AB
= ||
b
P
P
P
A
−
b
P
P
P
B
||
2
. (2)
3.2 Neural-Network Approach
In this approach, we train a neural network to estimate
the distance between person A and person B. Since the
distance between two points in a fisheye image is in-
Figure 2: Illustration of the relationship between P
z
and H.
variant to rotation, we pre-process locations x
x
x
A
and x
x
x
B
before feeding them into the network. First, we con-
vert x
x
x
A
and x
x
x
B
to polar coordinates: x
x
x
A
→ (r
A
,θ
A
) and
x
x
x
B
→ (r
B
,θ
B
), where r
·
denotes radius and θ
·
denotes
angle. Then, we compute the angle between normal-
ized locations as follows:
θ := (θ
A
− θ
B
) mod π. (3)
Note that by its definition, 0 ≤ θ ≤ π. We form a fea-
ture vector associated with locations x
x
x
A
and x
x
x
B
as fol-
lows: V
V
V = [r
A
,r
B
,θ]
T
. We chose a regression Multi-
Layer Perceptron (MLP) to estimate the 3D-world
distance between people (in lieu of a CNN) since the
input vector is a 3-vector with no required ordering
of coordinates for which convolution would be ben-
eficial. We collected a training set of images, where
for each vector V
V
V we know the ground-truth distance
d
AB
, and trained the MLP, F : R
3
7→ R, as a regression
model that performs the following mapping:
b
d
AB
= F(V
V
V ). (4)
We used the mean squared-error (MSE) loss:
L =
1
M
M
∑
i=1
||
b
d
AB
i
− d
AB
i
||
2
(5)
for training, where M is the batch size.
3.3 Person’s Height Adjustment
While the geometry-based approach can be tuned for
specific height of a person through P
z
(1), the neural-
network approach would require
a training dataset with annotated examples at mul-
tiple heights. Since this would be labor intensive,
we train the MLP at a single height of 32.5in (de-
tails in Section 4.1) which corresponds to one-half of
H = 65in, an average person’s height. Clearly, for a
standing, fully-visible 65-inch person the bounding-
box center should match the 32.5-inch training height
VISAPP 2023 - 18th International Conference on Computer Vision Theory and Applications
530

well. However, there would be a mismatch for peo-
ple of other heights or when a person is partially
occluded, for example by a table (shorter bounding
box). To compensate for this height mismatch be-
tween the training and testing data, we propose a test-
time adjustment in the MLP approach.
This height adjustment can be thought of as mov-
ing the center-point of a person in pixel coordinates
and is illustrated in Fig. 1 where the red point rep-
resents the center of the red bounding box and h its
height. In the process of height adjustment during
test time, we move the actual center (red point) of
the bounding box along the box’s axis pointing to the
center of the image (white-dashed line) to produce an
adjusted center (green point). This shift is defined as
α×
h
2
for a range of α values (see Fig. 5). α > 0 moves
the bounding-box center towards the image center,
i.e., we reduce the height of a detected person.
4 DATASETS
We introduce a unique dataset, Distance Estimation
between People from Overhead Fisheye cameras (DE-
POF)
1
which was collected with Axis M3057-PLVE
cameras at 2,048×2,048-pixel resolution.
4.1 Training Dataset
In order to train the MLP, we need ground-truth dis-
tance data. We placed a single 9ft × 9ft chessboard
mat on classroom tables of equal height (32.5in)
in locations #1-8 and #9-16 (Fig. 3) as if 16 mats
were placed abutting each other. We carefully mea-
sured the distance between these two sets of locations
(121.5in). To capture ground-truth data in the cen-
ter of camera’s field of view, we also placed the mat
directly under each camera (locations #17, #18, #19)
without precise alignment to mats at other locations.
The black/white corners of chessboard images
were annotated, resulting in numerous (x
x
x
A
,x
x
x
B
) pairs.
Since the neighboring chessboards are abutting and
each square has a 12.5-inch side, we could accu-
rately compute the 3D distances between physical-
mat points corresponding to x
x
x
A
and x
x
x
B
. The overall
process can be thought of as creating a virtual grid
with 12.5-inch spacing placed 32.5in above the floor.
4.2 Testing Datasets
For testing, we collected a dataset with people in a
72ft × 28ft classroom. First, we marked locations on
1
vip.bu.edu/depof
the floor where individuals would stand (Fig. 4). We
measured distances between all locations marked by
a letter (green disk) that gives us
10
2
= 45 distances
which are distinct. For locations marked by a number
(yellow squares), we measured the distances along the
dashed lines (20 distinct distances). Using this spatial
layout, we collected and annotated two sets of data:
• Fixed-Height Dataset: One person of height H =
70.08 in moves from one marked location to an-
other and an image is captured at each location.
This allows us to evaluate our algorithms on peo-
ple of the same known height.
• Varying-Height Dataset: Several people of dif-
ferent heights stand at different locations in var-
ious permutations to capture multiple heights at
each location. We use this dataset to evaluate
sensitivity of our algorithms to a person’s height
changes.
In addition to the 65 distances (45 + 20), we
performed 8 additional measurements for the fixed-
height dataset and 2 additional measurements for the
varying-height dataset.
Depending on their location with respect to the
camera, a person may be fully visible or partially oc-
cluded (e.g., by a table or chair). In order to under-
stand the impact of occlusions on distance estimation,
we grouped all the pairs in the testing datasets into
4 categories as follows: Visible-Visible (V-V) where
both people are fully visible; Visible-Occluded (V-
O) where one person is visible while the other is par-
tially occluded; Occluded-Occluded (O-O) where
both people are partially occluded; All with all pairs.
Table 1 shows various statistics for both datasets:
the number of pairs in each category, the number and
range of distances measured, and the number of pairs
with distance in ranges: 0ft–6ft, 6ft–12ft and >12ft.
To find locations of people in fisheye images,
we used a state-of-the-art people detection algorithm
(Duan et al., 2020) and manually corrected missed
and false bounding boxes. To measure the real-world
Table 1: Statistics of the testing datasets.
Fixed- Varying-
height height
Number of V-V pairs 35 100
Number of V-O pairs 32 126
Number of O-O pairs 6 30
Number of All pairs 73 256
Number of distances 73 67
Smallest distance (G to 11) 11.63in
Largest distance (A to J) 701.96in
Number of pairs: 0ft to 6ft 25 45
Number of pairs: 6ft to 12ft 15 73
Number of pairs: above 12ft 33 138
Estimating Distances Between People Using a Single Overhead Fisheye Camera with Application to Social-Distancing Oversight
531
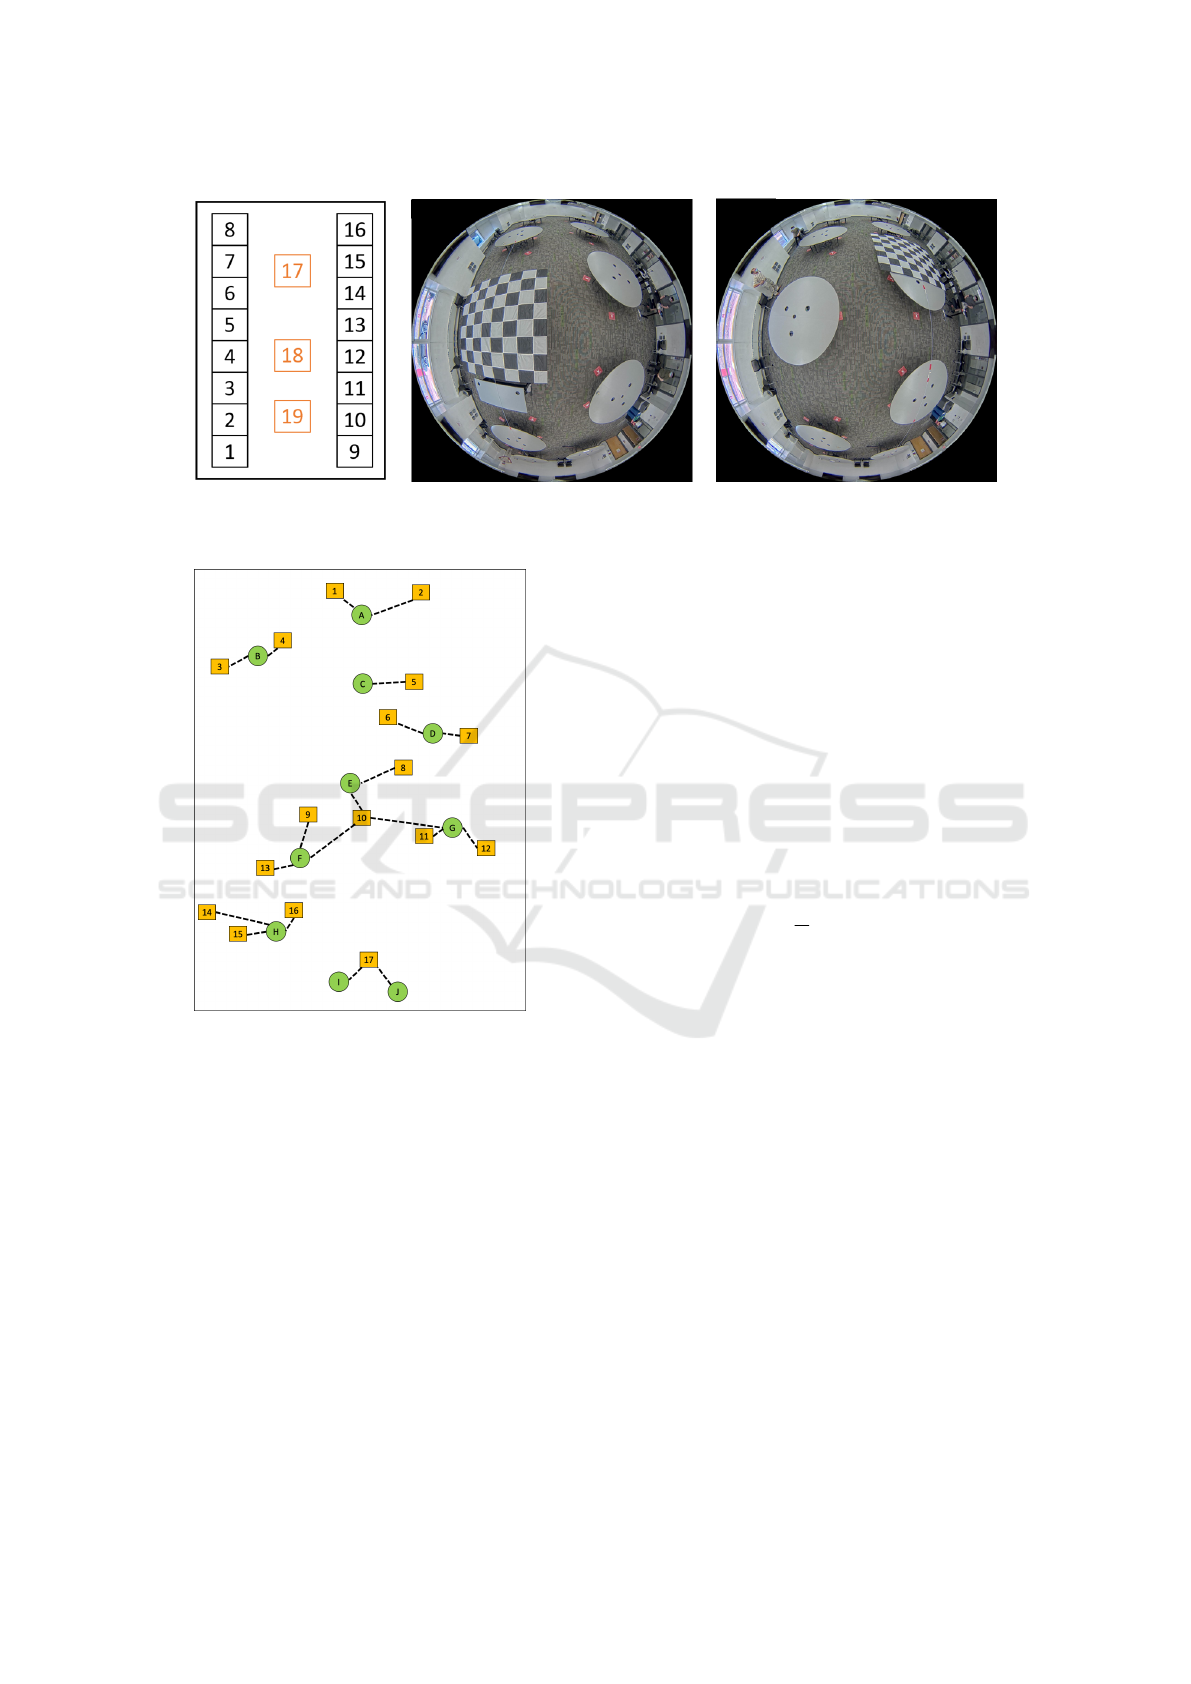
(a) Layout of chessboard mats (b) Chessboard mat at position #4 (c) Chessboard mat at position #13
Figure 3: Illustration of chessboard-mat layout used for training the MLP model.
Figure 4: Spatial layout of locations in testing datasets. .
distances between people, we used a laser tape mea-
sure.
5 EXPERIMENTAL RESULTS
5.1 Experimental Setup
In the geometry-based approach, to learn parameters
ω
ω
ω of the inverse mapping G (1) we used the method
developed by (Bone et al., 2021). This method re-
quires the use of 2 fisheye cameras, but is largely au-
tomatic and has to be applied only once for a given
camera type (model and manufacturer). In the exper-
iments, we used one camera at a time (3 cameras are
installed at locations #17-#19 in Fig. 3) and report the
results only for the center camera due to space con-
straints. Results for other cameras are similar.
In the neural-network approach, we used an MLP
with 4 hidden layers, 100 nodes per layer and ReLU
as the activation function. In training, we used MSE
loss (5) and Adam optimizer with 0.001 learning rate.
5.2 Distance Estimation Evaluation
In Tables 2 and 3, we compare the performance of
both methods on the fixed-height and varying-height
datasets. We report the mean absolute error (MAE)
between the estimated and ground-truth distances:
MAE =
1
N
N
∑
i=1
|
b
d
AB
i
− d
AB
i
| (6)
where N is the number of pairs in a dataset while
b
d
AB
i
and d
AB
i
are the estimated and ground-truth distances
for the i-th pair AB, respectively. We chose MAE over
MSE, to avoid bias (MLP minimizes MSE loss).
It is clear from Table 2 that the geometry-based
approach using H/2 = 35.04in (to compute P
z
) con-
sistently outperforms the same approach using H/2 =
32.5in, which, in turn, significantly outperforms the
MLP approach trained on chess mats placed at the
height of 32.5in. While it is not surprising that know-
ing a test-person’s height of H = 70.08in improves
geometry-based method’s accuracy, it is interesting
that even assuming H/2 = 32.5in the geometry-based
approach significantly outperforms the MLP opti-
mized for this height during training.
Similar performance trends can be observed in Ta-
ble 3 for the varying-height dataset but with larger
distance-error values than in Table 2. This is due to
the fact that in the varying-height dataset people are
of different heights, so a selected parameter H in the
geometry-based algorithm or a training height in the
VISAPP 2023 - 18th International Conference on Computer Vision Theory and Applications
532

neural-network algorithm cannot match all people’s
heights at the same time.
Note that for two fully-visible people of the same
and known height (Table 2), the geometry-based algo-
rithm has an average distance error of less than 10in.
This error grows to about 21in for all pairs (visible
and occluded). For people of different and unknown
heights (Table 3), the average error for pairs of fully-
visible individuals (for H/2 = 35.04in) is slightly
above 12 in and for all pairs it is less than 33in. While
these might seem to be fairly large distance errors,
one has to note that the distances between people are
as large as 58.5ft (702in).
In terms of the computational complexity, on an
Intel(R) Xeon(R) CPU E5-2680 v4@2.40GHz both
algorithms can easily support real time operation al-
though the geometry-based algorithm is significantly
faster. For example, suppose 3D-world distances are
to be computed between all pairs of 100 image loca-
tions. The geometry-based algorithm can first map
all pixel coordinates to 3D world coordinates (1) and
then compute the Euclidean distance for all
100
2
=
4,950 pairs. This, on average, takes 4 µs. The neural-
network algorithm has to apply the MLP to all 4,950
pairs separately, taking on average 949 µs.
5.3 Impact of Height Adjustment
As we discussed in Section 3.3, the centers of the de-
tected bounding boxes may not reflect the true height
of a person due to occlusions. In this context, we pro-
posed a method to adjust a bounding-box center loca-
tion during testing to compensate for occlusions.
Table 2: Mean-absolute distance error between two people
for the fixed-height dataset.
MAE [in]
V-V V-O O-O All
Geometry-based 9.85 31.69 32.30 21.27
(H/2 = 35.04in)
Geometry-based 12.20 39.90 42.64 26.84
(H/2 = 32.5in)
Neural network 17.72 48.84 56.58 34.56
(trained on 32.5in)
Table 3: Mean-absolute distance error between two people
for the varying-height dataset.
MAE [in]
V-V V-O O-O All
Geometry-based 14.70 41.37 55.55 32.62
(H/2 = 35.04in)
Geometry-based 20.18 51.14 67.61 40.98
(H/2 = 32.5in)
Neural network 24.64 55.88 70.87 45.43
(trained on 32.5in)
Here, we evaluate the impact of this height ad-
justment on each method’s performance. For a fair
comparison, we use H/2 = 32.5in (table height) in
the geometry-based method. Recall that the MLP ap-
proach was trained on chess mats placed at this height.
The value of MAE as a function of height-
adjustment parameter α is shown in Figs. 5(a) and
5(b) for the fixed-height dataset. When the true
bounding-box centers are used (α = 0), the MAE for
the neural-network approach and V-V pairs (blue line)
is close to 20in. However, when the centers are low-
ered by about 10% (α ≈ 0.10), the MAE for V-V pairs
drops by about half.
Similar trends can be observed in Figs. 5(c) and
5(d) for the varying-height dataset. If the true
bounding-box centers are used, the MAE for V-V
pairs is above 20in for the neural-network approach.
However, when the centers are lowered by about 15%
(α ≈ 0.15), the MAE for V-V pairs drops to around
12in. Analogous trends can be seen for other types
of pairs and for all pairs, as well as for the geometry-
based approach.
In Tables 4 and 5, we show the lowest MAE values
for each pair type along with the corresponding value
of α. The two methods perform quite similarly (ex-
cept for O-O pairs in the fixed-height dataset on which
the geometry-based method performs better). For ex-
ample, for the fixed-height dataset in Table 4 MAE for
the best α for V-V pairs drops to about 9in for both al-
gorithms compared to 12-18in seen in Table 2. Over-
all, in both datasets, with the right choice of α, the
MAE is well below 24in, which can be argued to be
a reasonable result considering that the inter-people
distances in our dataset are up to 702in.
Looking at Fig. 5 and Tables 4-5, one notes that
MAE is minimized for much smaller values of α for
V-V pairs (α = 0.08-0.17) than for O-O pairs (α =
0.32-0.51). This is due to the majority of occlusions
happening in the lower half of people’s bodies in the
testing dataset. When a person is blocked in the bot-
tom half, the bounding-box center radially shifts away
from the image center. An example of this can be
seen in Fig. 1, where the person delineated by the yel-
low bounding box would have been delineated by the
blue bounding box had there been no occlusion. Due
to the occlusion, however, the bounding-box center
shifts from the blue point to the yellow point. There-
fore, the O-O pairs need to be compensated more than
the V-V pairs, i.e., a higher value of α is needed.
In results reported thus far, the same value of α
was used for both people in every pair. In the V-O and
‘All’ categories, however, it could be advantageous
to use different values of α for the visible and oc-
cluded person. To verify this hypothesis, we applied
Estimating Distances Between People Using a Single Overhead Fisheye Camera with Application to Social-Distancing Oversight
533
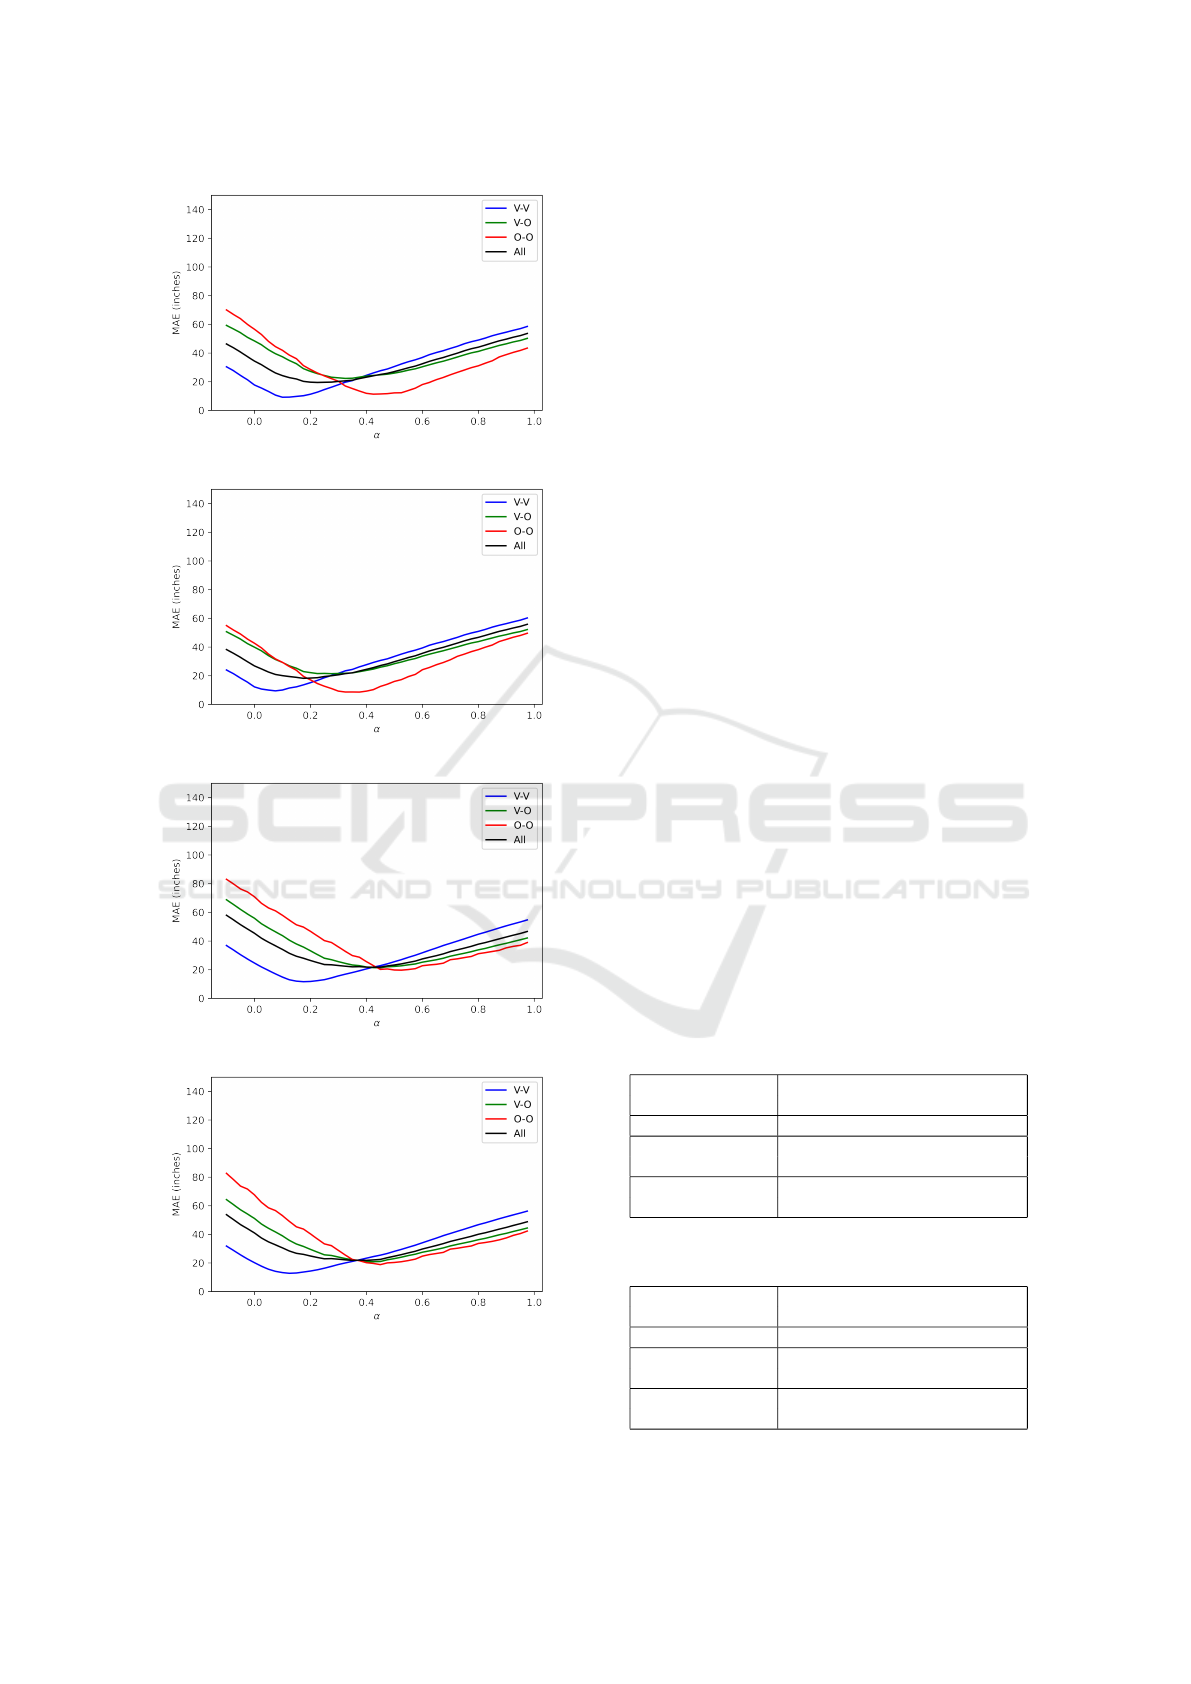
(a) Neural-network algorithm, fixed-height dataset.
(b) Geometry-based algorithm, fixed-height dataset.
(c) Neural-network algorithm, varying-height dataset.
(d) Geometry-based algorithm, varying-height dataset.
Figure 5: MAE for height adjustments: −0.1 ≤ α < 1.0.
α = 0.1 to all visible bounding boxes and α = 0.5
to all occluded bounding boxes in the fixed-height
dataset. This α adjustment per person gave an MAE
of 12.80in (down from 18.10in) for the geometry-
based algorithm and 11.06in (down from 19.27in)
for the neural-network approach. The correspond-
ing MAE values for the varying-height dataset were:
13.97in (down from 21.48in) and 13.14in (down from
21.47in). Clearly, an automatic detection of body
occlusions and a suitable adjustment of parameter α
can further improve the distance estimation accuracy.
This could be a fruitful direction for future work.
5.4 Social-Distance Violation Detection
One very practical application of the proposed meth-
ods is to detect situations when social-distancing rec-
ommendations (typically 6ft) are being violated. This
problem can be cast as binary classification: two peo-
ple closer to each other than 6ft are considered to
be a “positive” case (violation takes place) whereas
two people more than 6ft apart are considered to be
a “negative” case (no violation). To measure perfor-
mance, we use Correct Classification Rate (CCR) and
F1-score. Table 6 shows their values for both algo-
rithms applied to “All” pairs. We report results for
α = 0.5 which gives the lowest MAE for pairs with
occlusions on the varying-height dataset (Table 5).
On the fixed-height dataset, the neural-network
approach slightly outperforms the geometry-based al-
gorithm: by 1.37% points in terms of CCR and
by 0.63% points in terms of F1-score. The meth-
ods perform identically on the varying-height dataset,
achieving CCR value close to 95% and F1-score close
to 80%. These results suggest that despite the pres-
Table 4: Lowest MAE value in plots from Figs. 5(a-b) for
the fixed-height dataset and the corresponding α values.
MAE [in]
(α)
V-V V-O O-O All
Geometry-based 9.36 21.07 8.31 18.10
(H/2 = 32.5in) (0.08) (0.28) (0.32) (0.18)
Neural network 8.79 22.20 11.24 19.27
(Trained on 32.5in) (0.12) (0.33) (0.42) (0.26)
Table 5: Lowest MAE value in plots from Figs. 5(c-d) for
the varying-height dataset and the corresponding α values.
MAE [in]
(α)
V-V V-O O-O All
Geometry-based 12.76 20.49 18.66 21.48
(H/2 = 32.5in) (0.12) (0.41) (0.48) (0.38)
Neural network 11.62 21.30 18.60 21.47
(Trained on 32.5in) (0.17) (0.45) (0.51) (0.41)
VISAPP 2023 - 18th International Conference on Computer Vision Theory and Applications
534

Table 6: Social-distance violation detection results (α=0.5).
Fixed-height Varying-height
CCR F1 CCR F1
[%] [%] [%] [%]
Geometry-based 94.52 91.14 94.53 79.69
(H/2=32.5in)
Neural network 95.89 91.77 94.53 79.69
(Trained on 32.5in)
ence of people of different heights both approaches
achieve high enough CCR and F1-score values to
be potentially useful in practice for the detection of
social-distance violations in the wild.
6 CONCLUDING REMARKS
We developed two methods (the first of their kind)
for estimating the distance between people in indoor
scenarios based on a single image from a single over-
head fisheye camera. Demonstrating the ability to ac-
curately measure the distance between people from a
single overhead fisheye camera (with its wide FOV)
has practical utility since it can decrease the num-
ber of cameras (and cost) needed to monitor a given
area. A novel methodological contribution of our
work is the use of a height-adjustment test-time pre-
processing operation which makes the distance esti-
mates resilient to height variation of individuals as
well as body occlusions. We demonstrated that both
methods can achieve errors on the order of 10-20in for
suitable choices of height-adjustment tuning parame-
ters. We also showed that both of our methods can
predict social distance violation with a high F1-score
and accuracy.
REFERENCES
Aghaei, M., Bustreo, M., Wang, Y., Bailo, G., Morerio, P.,
and Bue, A. D. (2021). Single image human prox-
emics estimation for visual social distancing. 2021
IEEE Winter Conference on Applications of Com-
puter Vision (WACV), pages 2784–2794.
Bone, J., Cokbas, M., Tezcan, O., Konrad, J., and Ishwar,
P. (2021). Geometry-based person re-identification in
fisheye stereo. In 2021 17th IEEE Int. Conf. on Ad-
vanced Video and Signal Based Surveillance (AVSS),
pages 1–10.
Dandil, E. and Cevik, K. K. (2019). Computer vision
based distance measurement system using stereo cam-
era view. In 2019 3rd International Symposium on
Multidisciplinary Studies and Innovative Technolo-
gies (ISMSIT), pages 1–4.
Duan, Z., Ozan T., M., Nakamura, H., Ishwar, P., and Kon-
rad, J. (2020). Rapid: Rotation-aware people detec-
tion in overhead fisheye images. In 2020 IEEE/CVF
Conference on Computer Vision and Pattern Recogni-
tion Workshops (CVPRW).
Gad, A., ElBary, G., Alkhedher, M., and Ghazal, M. (2020).
Vision-based approach for automated social distance
violators detection. In 2020 Int. Conf. on Innova-
tion and Intelligence for Informatics, Computing and
Technologies (3ICT), pages 1–5.
Geyer, C. and Danilidis, K. (2001). Catadioptric projective
geometry. Int. J. Computer Vision, 45:223–243.
Gupta, S., Kapil, R., Kanahasabai, G., Joshi, S., and Joshi,
A. (2020). Sd-measure: A social distancing detector.
In 2020 Int. Conf. on Computational Intelligence and
Communication Networks (CICN), pages 306–311.
Hou, Y. C., Baharuddin, M. Z., Yussof, S., and Dzulkifly, S.
(2020). Social distancing detection with deep learning
model. In 2020 8th Int. Conf. on Information Technol-
ogy and Multimedia (ICIMU).
Huu, P. N., Tran Van, T., and Thi, N. G. (2019). Propos-
ing distortion compensation algorithm for determin-
ing distance using two cameras. In 2019 NAFOSTED
Conf. on Information and Computer Science (NICS).
Li, S., Tezcan, M. O., Ishwar, P., and Konrad, J. (2019).
Supervised people counting using an overhead fisheye
camera. In 2019 16th IEEE Int. Conf. on Advanced
Video and Signal Based Surveillance (AVSS).
Ohashi, A., Tanaka, Y., Masuyama, G., Umeda, K., Fukuda,
D., Ogata, T., Narita, T., Kaneko, S., Uchida, Y., and
Irie, K. (2016). Fisheye stereo camera using equirect-
angular images. In 2016 11th France-Japan and 9th
Europe-Asia Cong. on Mechatronics / 17th Int. Conf.
on Research and Education in Mechatronics (REM).
Pan, X., Yi, Z., and Tao, J. (2021). The research on so-
cial distance detection on the complex environment of
multi-pedestrians. In 2021 33rd Chinese Control and
Decision Conference (CCDC), pages 763–768.
Seker, M., M
¨
annist
¨
o, A., Iosifidis, A., and Raitoharju, J.
(2021). Automatic social distance estimation from im-
ages: Performance evaluation, test benchmark, and al-
gorithm. CoRR, abs/2103.06759.
Tamura, M., Horiguchi, S., and Murakami, T. (2019). Om-
nidirectional pedestrian detection by rotation invariant
training. In 2019 IEEE Winter Conference on Appli-
cations of Computer Vision (WACV).
Tellis, J. M., Jaiswal, S., Kabra, R., and Mehta, P. (2021).
Monitor social distance using convolutional neural
network and image transformation. In 2021 IEEE
Bombay Section Signature Conf. (IBSSC).
Tsiktsiris, D., Lalas, A., Dasygenis, M., Votis, K., and Tzo-
varas, D. (2022). An efficient method for addressing
covid-19 proximity related issues in autonomous shut-
tles public transportation. In Maglogiannis, I., Iliadis,
L., Macintyre, J., and Cortez, P., editors, Artificial In-
telligence Applications and Innovations, pages 170–
179. Springer International Publishing.
Yamano, F., Iida, H., Umeda, K., Ohashi, A., Fukuda, D.,
Kaneko, S., Murayama, J., and Uchida, Y. (2018). Im-
proving the accuracy of a fisheye stereo camera with
a disparity offset map. In 2018 12th France-Japan and
10th Europe-Asia Congress on Mechatronics.
Yeshasvi, M., Bind, V., and T, S. (2021). Social distance
capturing and alerting tool. In 2021 3rd Int. Conf. on
Signal Processing and Communication (ICPSC).
Estimating Distances Between People Using a Single Overhead Fisheye Camera with Application to Social-Distancing Oversight
535
