
In Vitro Flow Study in an Intracranial Aneurysm Biomodel
Manufactured by Additive Manufacturing
Andrews Souza
1,2,3 a
, Diana Rodrigues
1
, Maria Sabrina Souza
4b
, Conrado Ferrera
5c
,
João Ribeiro
3,4 d
, Rui A. Lima
1,2 e
and Ana Moita
6,7 f
1
University of Minho, Campus de Azurém, 4800-058 Guimarães, Portugal
2
Mechanical Engineering and Resource Sustainability Center (MEtRICs), UMinho, Guimarães, Portugal
3
Centro de Investigação de Montanha (CIMO), Instituto Politécnico de Bragança (IPB),
Campus de Santa Apolónia, 5300-253 Bragança, Portugal
4
Instituto Politécnico de Bragança, 5300-253, Bragança, Portugal
5
Depto. de Ingeniería Mecánica, Energética y de los Materiales and Instituto de Computación Científica Avanzada,
Universidad de Extremadura, Badajoz, Spain
6
IN+, Center for Innovation, Technology and Policy Research, Instituto Superior Técnico,
Universidade de Lisboa, Av. Rovisco Pais, 1049-001 Lisboa, Portugal
7
CINAMIL, Department of Exact Sciences and Engineering, Portuguese Military Academy,
R. Gomes Freire 203, 1169-203 Lisboa, Portugal
jribeiro@ipb.pt, rl@dem.uminho.pt, anamoita@tecnico.ulisboa.pt
Keywords: Aneurysm Intracranial Biomodels, in Vitro Tests, Additive Manufacturing, Polysmooth.
Abstract: The hemodynamics of Intracranial Aneurysm (IA) involves complex phenomena that influence its growth
and rupture. The progress of additive manufacturing techniques has allowed the development of biomodels
suitable to perform in vitro flow experiments. Hence, this work presents the manufacturing process to fabricate
flow biomodels by using the additive manufacturing technique known as Fused Deposition Modeling (FDM).
The biomodels obtained through the proposed technique has proved to be suitable for in vitro flow
experiments using imaging techniques and for validation of numerical studies.
1 INTRODUCTION
Intracranial Aneurysm (IA) is a disease associated
with weakening of the arterial wall, which causes
local dilation (Rodriguez-Régent et al., 2014). This
pathology has a high mortality rate of around 60%
after rupture (Amenta et al., 2012). Studies have
shown that changes in flow induce endothelial cell
responses, thus causing disease (Chiu & Chien,
2011), but the cause of development and disruption of
IAs are still not well understood (Tromp et al., 2014).
Therefore, to better understand IAs, it is important to
analyze the local hemodynamic, and how it affects the
vessel wall (Saqr et al., 2019).
Although there are non-invasive in vivo studies
capable of performing flow measurements using
a
https://orcid.org/0000-0003-2414-073X
b
https://orcid.org/0000-0002-4415-7267
c
https://orcid.org/0000-0002-2274-1374
imaging techniques such as Phase Contrast Magnetic
Resonance Imaging (PC-MRI), Magnetic Resonance
Angiography (MRA), these have difficulty in
visualizing the flow due to lack of resolution in small
vessels only underestimate wall shear values, have
low reproducibility and are expensive (Szajer & Ho-
Shon, 2018)(Roloff et al., 2018).
As an alternative to in vivo studies, in vitro tests
with transparent flow phantoms (biomodels) make it
possible to visualize the flow through the monitoring
of suspended tracer particles. It is possible to employ
different techniques for measurement, such as
Particle Image Velocimetry (PIV) (Yamaguchi et al.,
2022), Particle Tracking Velocimetry (PTV) and
image microscopy (Souza et al., 2020). Another
advantage of in vitro studies is the possibility of
d
https://orcid.org/0000-0001-6300-148X
e
https://orcid.org/0000-0003-3428-637X
f
https://orcid.org/0000-0001-9801-7617
Souza, A., Rodrigues, D., Souza, M., Ferrera, C., Ribeiro, J., Lima, R. and Moita, A.
In Vitro Flow Study in an Intracranial Aneurysm Biomodel Manufactured by Additive Manufacturing.
DOI: 10.5220/0011652100003414
In Proceedings of the 16th International Joint Conference on Biomedical Engineering Systems and Technologies (BIOSTEC 2023) - Volume 1: BIODEVICES, pages 121-125
ISBN: 978-989-758-631-6; ISSN: 2184-4305
Copyright
c
2023 by SCITEPRESS – Science and Technology Publications, Lda. Under CC license (CC BY-NC-ND 4.0)
121

validating numerical simulations. The disadvantage
of this type of study is the difficulty of manufacturing
biomodels suitable for tests, as these flow phantoms
must be transparent, they must reproduce the
anatomical geometry, and the lost core material must
not interact with the biomodel material. In recent
years, the aid of Additive Manufacturing (AM)
techniques has enabled the proper fabrication of IA
biomodels. Souza et al (Souza et al., 2020) combined
AM processes and lost core casting with glycerin-
based soap, and Doutel et al (Doutel et al., 2015) used
caramel (melted sugar) as the lost core material.
Although these processes have been shown to be
adequate, they have many steps in their manufacture.
In this work, a biomodel manufacturing process is
presented, which uses AM techniques to directly print
the model of the lost core (vessel lumen), which is
coated with a transparent, biocompatible silicone,
which is Polydimethylsiloxane (PDMS). One of the
advantages of this silicone is its ease of manufacture,
when compared to models made of glass (Yu &
Durgesh, 2022). The biomodels were tested for their
transparency and high-speed video microscopy tests
were performed for qualitative analysis of flow
behavior and quantitative analysis of flow velocity.
2 BIOMODEL
MANUFACTURING PROCESS
The geometry used was previously created in the
SolidWorks 3D CAD Software, using the average
dimensions of real intracranial aneurysms (Parlea et
al., 1999). The geometry was saved in STL format
and then converted to G-code, a format used in 3D
printers. The spherical geometry was chosen, because
according to the study by (Philip et al., 2022) that
compares through numerical studies the idealized and
patient-specific geometries that the physics of the
flow inside the aneurysm sac is better predicted in this
type of geometry.
The Biomodels were manufactured using an
additive manufacturing technique, Fused Deposition
Modeling (FDM). The geometry was printed in
PolySmooth (chosen material) in the Ultimarker 3 3D
printer. After obtaining the model, it was positioned
in the Polysher machine for a surface treatment with
isopropyl alcohol, this treatment took place for a
period of 20 minutes, way that the lines of the
outermost layers of geometry are smoothed. With the
surface treatment completed, the mold was placed in
an acetate box and then the PDMS was poured by
gravity. PDMS was prepared in a ratio of 10:1 and its
curing process took place in 48 hours. After the
PDMS had completely cured, the lost core material
was removed with isopropyl alcohol. The process
steps are illustrated in Figure 1.
Figure 1: (a) PolySmooth geometry, (b) biomodel with lost
core material and (c) final biomodel.
3 EVALUATION OF THE
OPTICAL TRANSPARENCY OF
THE BIOMODEL
To evaluate the issue of optical distortion caused by
solid-liquid interaction, two fluids with different
physical properties were tested. At first, a fluid with
a refractive index similar to that of PDMS and was
used, a mixture of 61% glycerol and 39% distilled
water (w/w) and 0.06% suspended particles of
Polymethylmethacrylate (PMMA) with 60 μm (in
diameter). The second fluid considered was just
water. It is important to mention that the application
of this technique, to evaluate the optical transparency
of the biomodel under study, was based on the work
carried out by Hopkins et al (Hopkins et al., 2000).
The physical properties of the materials used in the
present study are shown in Table 1 (Souza et al.,
2020).
Table 1: Physical properties of materials used in the
evaluation of the optical transparency of biomodels.
Material Refractive
index
Viscosity
(
Pa.s
)
Density
(
k
g
/m
3
)
Wate
r
1.333 0.920 × 10
-3
997
Glycerin
mixture
1.412 1.290 × 10
-2
1153
PDMS 1.412 - -
In the tests, a sheet with a rectangular structure
was used in which each rectangle has dimensions of
2.4 ×3.9 mm and under which the biomodel was
placed with the different fluids. Figure 2 shows the
images of the transparency tests, with image (a)
referring to the biomodel in which the injected fluid
was water and image (b) corresponding to the
situation in which the glycerin-based solution was
injected.
BIODEVICES 2023 - 16th International Conference on Biomedical Electronics and Devices
122
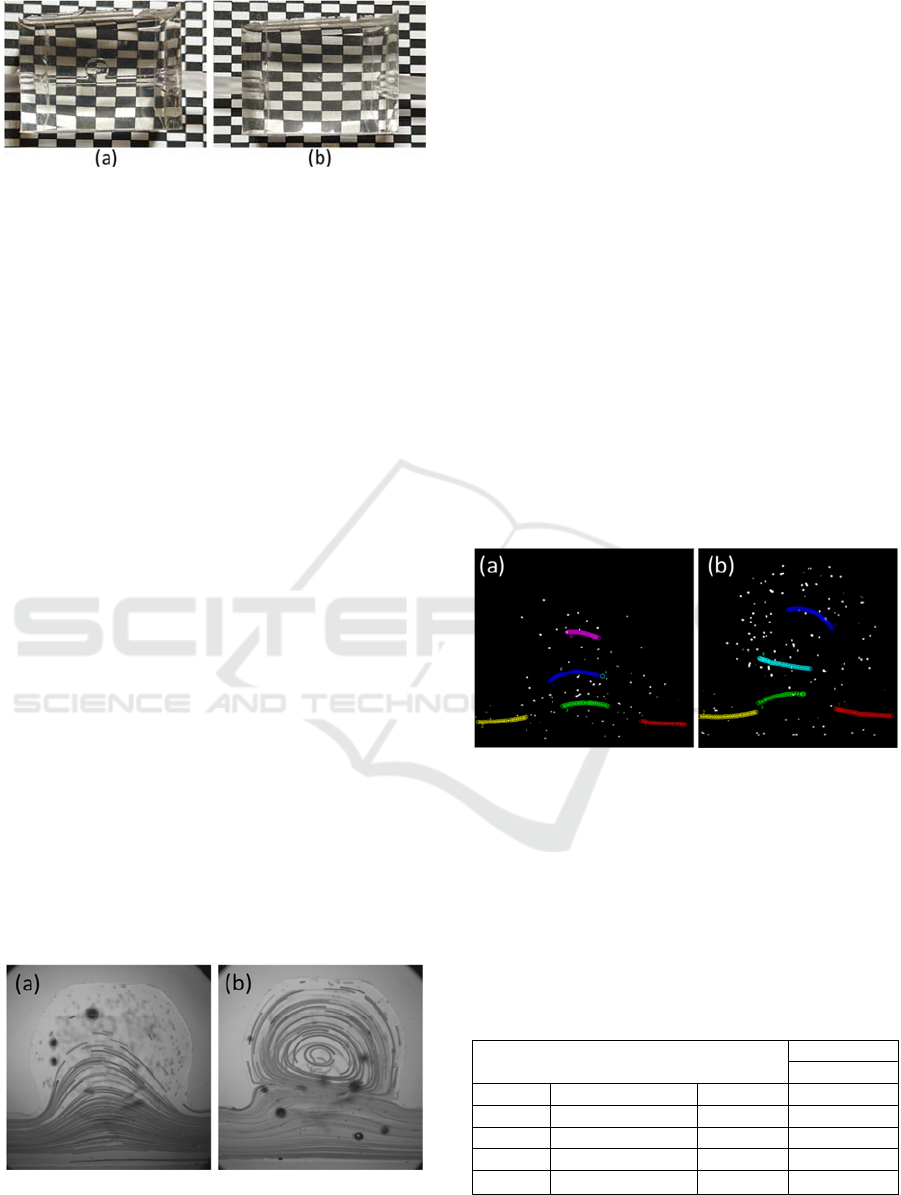
Figure 2: Evaluation of the optical transparency of the
biomodel with the fluid: (a) water and (b) glycerin-based
solution.
4 EXPERIMENTAL TEST OF
FLOW VISUALIZATION
The main objectives of this test were: to evaluate the
appearance of the fluid recirculation phenomenon as
a function of the flow rates used, through the
observation of the particle trajectories and; evaluate
the velocities in different zones of the biomodel.
For this, an experimental setup was used,
consisting of a set of equipment, namely: an ultra-
high-speed camera (Photron FASTCAM SA3),
coupled to an inverted microscope (IX71, Olympus,
Japan) and an objective (N-Achroplan 2.5x/0.07). At
first, the PDMS biomodel was fixed to the
microscope and a syringe pump was used to pump the
working fluid at a constant flow rate. Two different
flow rates were used: 5 ml/min and 20 ml/min.
4.1 Qualitative Analysis of Flow
Behavior
The recorded images, using the Photron FASTCAM
visualization software, were later processed in the
ImageJ software, where the particle trajectories and
velocities were obtained using the Z Project plugin
and the MTrackJ plugin, respectively. The image
processing of the two flows studied are shown in
Figure 3.
Figure 3: Trajectories of the PMMA particles for a flow rate
of: (a) 5 ml/min and (b) 20 ml/min.
Observing the previous figure, it can be concluded
that, for a flow rate of 5 mL/min, the phenomenon of
fluid recirculation still does not occur. However, it is
possible to verify that for the flow of 20 mL/min, the
phenomenon of fluid recirculation occurs. Although
the flow rates used are lower than those found in
cerebral arteries, the technique demonstrates the
potential of observing the different phenomena that
occur within IAs with an increase in the flow rate.
Thus, characterizing and visualizing the vortex zones,
which is a characteristic related to IAs growth and
rupture (Saqr et al., 2019).
4.2 Quantitative Analysis of Flow
Velocity
To study the velocities, the images were processed
with the ImageJ software with the MTrackJ plugin.
Velocity was evaluated in 5 zones: at the inlet, at the
outlet and at three locations in the center of the
biomodel, for both flows. Figure 4 shows the
trajectories where the velocities for the different flow
rates were obtained.
Figure 4: Trajectory of the marked particles, for the flow
rate of (a) 5ml/min and (b) 20 ml/min.
With the trajectories traced, it was then possible
to calculate the velocities in each of the marked areas.
Therefore, the results obtained for the velocity in the
study with flow rate of 5 ml/min are found in Table 2
and Table 3 shows the results for the flow rate of 20
ml/min.
Table 2: Velocities obtained considering a flow rate of 5
ml/min.
Track
Velocit
y
m/s
1Re
d
Inlet 0.0120
2 Yellow Outlet 0.0156
3Li
g
ht
g
reen Cente
r
0.0061
4 Dark blue Cente
r
0.0040
5 Pink Center 0.0008
In Vitro Flow Study in an Intracranial Aneurysm Biomodel Manufactured by Additive Manufacturing
123

Table 3: Velocities obtained considering a flow rate of 20
ml/min.
Track
Velocit
y
m/s
1 Re
d
Inlet 0.0595
2 Yellow Outlet 0.0659
3 Li
g
ht
g
reen Cente
r
0.0327
4 Li
g
ht blue Cente
r
0.0137
5 Dark blue Center 0.0039
With the velocity profiles traced, we observed that
the velocities of the fluid inside the aneurysm sac for
both studied flow rates are lower than the inlet and
outlet flows. At the flow rate of 20 ml/min where
recirculation occurs, the flow velocity decreases even
more as it approaches the upper part of the aneurysm
head. Although the flow rates used in our tests are
lower than the real values, the behavior of the
velocities found corresponds to previous studies
(Philip et al., 2022)(Cebral et al., 2011), where the
velocity decreases in the vortex zones.
5 CONCLUSIONS
Intracranial aneurysms are severe diseases that
require deeper understanding for a better diagnosis
and treatment of this kind of pathology. In vitro
hemodynamic studies are a promising way to improve
our understanding about the beginning, development,
and rupture of intracranial aneurysms. The obtained
experimental flow results have shown that the
polysmooth material that was used by FDM printing
technique was proved to be suitable for the
manufacture of biomodels, with good dimensional
accuracy, high quality flow visualizations and ease to
remove the material from the lumen. Through the
visualization tests, it was possible to identify the
recirculation regions at the highest flow. In addition,
it was possible to observe that at the central region of
the aneurysm, where the recirculation occurs, the
velocities are much lower when compared to the inlet
and outlet velocities.
For future work, it is intended to use fluids with
rheological properties closer to blood (blood
analogues), but with the same refractive index as
PDMS. In addition to using flow rates obtained from
medical examinations for a more realistic approach.
ACKNOWLEDGEMENTS
The authors acknowledge the financial support
provided by Fundação para a Ciência e a Tecnologia
(FCT), through the projects EXPL/EME-
EME/0732/2021, PTDC/EEI-EEE/2846/2021,
funded by NORTE 2020, PORTUGAL2020, and
FEDER. This work was also supported by Fundação
para a Ciência e a Tecnologia (FCT) under the
strategic grants UIDB/04077/2020, UIDB/00690/
2020, UIDB/04436/2020 and UIDB/00532/2020.
Andrews Souza acknowledges the PhD scholarship
2021.07961.BD attributed by FCT. Partial support
from the Junta de Extremadura through Grants No.
GR21091 and IB20105 (partially financed by FEDER
funds) is gratefully acknowledged.
REFERENCES
Amenta, P. S., Yadla, S., Campbell, P. G., Maltenfort, M.
G., Dey, S., Ghosh, S., Ali, M. S., Jallo, J. I.,
Tjoumakaris, S. I., Gonzalez, L. F., Dumont, A. S.,
Rosenwasser, R. H., & Jabbour, P. M. (2012). Analysis
of Nonmodifiable Risk Factors for Intracranial
Aneurysm Rupture in a Large, Retrospective Cohort.
Neurosurgery, 70(3), 693–701. https://doi.org/10.1227/
neu.0b013e3182354d68
Cebral, J. R., Mut, F., Weir, J., & Putman, C. M. (2011).
Association of hemodynamic characteristics and
cerebral aneurysm rupture. American Journal of
Neuroradiology, 32(2), 264–270. https://doi.org/
10.3174/ajnr.A2274
Chiu, J. J., & Chien, S. (2011). Effects of disturbed flow on
vascular endothelium: Pathophysiological basis and
clinical perspectives. Physiological Reviews, 91(1),
327–387. https://doi.org/10.1152/physrev.00047.2009
Doutel, E., Carneiro, J., Oliveira, M. S. N., Campos, J. B.
L. M., & Miranda, J. M. (2015). Fabrication of 3d mili-
scale channels for hemodynamic studies. Journal of
Mechanics in Medicine and Biology, 15(1), 1–21.
https://doi.org/10.1142/S0219519415500049
Hopkins, L. M., Kelly, J. T., Wexler, A. S., & Prasad, A. K.
(2000). Particle image velocimetry measurements in
complex geometries. Experiments in Fluids, 29(1), 91–
95. https://doi.org/10.1007/s003480050430
Parlea, L., Fahrig, R., Holdsworth, D. W., & Lownie, S. P.
(1999). An Analysis of the Geometry of Saccular
Intracranial Aneurysms. AJNR Am J Neuroradiol,
1079–1089.
Philip, N. T., Bolem, S., Sudhir, B. J., & Patnaik, B. S. V.
(2022). Hemodynamics and bio-mechanics of
morphologically distinct saccular intracranial
aneurysms at bifurcations: Idealised vs Patient-specific
geometries. Computer Methods and Programs in
Biomedicine, 227, 107237. https://doi.org/10.1016/j.
cmpb.2022.107237
Rodriguez-Régent, C., Edjlali-Goujon, M., Trystram, D.,
Boulouis, G., Ben Hassen, W., Godon-Hardy, S., Nataf,
F., MacHet, A., Legrand, L., Ladoux, A., Mellerio, C.,
Souillard-Scemama, R., Oppenheim, C., Meder, J. F.,
& Naggara, O. (2014). Non-invasive diagnosis of
BIODEVICES 2023 - 16th International Conference on Biomedical Electronics and Devices
124

intracranial aneurysms. Diagnostic and Interventional
Imaging, 95(12), 1163–1174. https://doi.org/10.1016/
j.diii.2014.10.005
Roloff, C., Stucht, D., Beuing, O., & Berg, P. (2018).
Comparison of intracranial aneurysm flow
quantification techniques : standard PIV vs
stereoscopic PIV vs tomographic PIV vs phase-
contrast MRI vs CFD. 1–8. https://doi.org/10.1136/
neurintsurg-2018-013921
Saqr, K. M., Rashad, S., Tupin, S., Niizuma, K., Hassan, T.,
Tominaga, T., & Ohta, M. (2019). What does
computational fluid dynamics tell us about intracranial
aneurysms? A meta-analysis and critical review.
Journal of Cerebral Blood Flow and Metabolism.
https://doi.org/10.1177/0271678X19854640
Souza, A., Souza, M. S., Pinho, D., Agujetas, R., Ferrera,
C., Lima, R., Puga, H., & Ribeiro, J. (2020). 3D
manufacturing of intracranial aneurysm biomodels for
flow visualizations: Low cost fabrication processes.
Mechanics Research Communications, 107, 103535.
https://doi.org/10.1016/j.mechrescom.2020.103535
Szajer, J., & Ho-Shon, K. (2018). A comparison of 4D flow
MRI-derived wall shear stress with computational fluid
dynamics methods for intracranial aneurysms and
carotid bifurcations — A review. Magnetic Resonance
Imaging, 48, 62–69. https://doi.org/10.1016/j.mri.
2017.12.005
Tromp, G., Weinsheimer, S., Ronkainen, A., &
Kuivaniemi, H. (2014). Molecular basis and genetic
predisposition to intracranial aneurysm. Annals of
Medicine, 46(8), 597–606. https://doi.org/10.3109/
07853890.2014.949299
Yamaguchi, R., Tanaka, G., Shafii, N. S., Osman, K.,
Shimizu, Y., Saqr, K. M., & Ohta, M. (2022).
Characteristic effect of wall elasticity on flow
instability and wall shear stress of a full-scale, patient-
specific aneurysm model in the middle cerebral artery:
An experimental approach. Journal of Applied Physics,
131(18). https://doi.org/10.1063/5.0085417
Yu, P., & Durgesh, V. (2022). Experimental study of flow
structure impact on the fluid parameters in saccular
aneurysm models. Experimental Thermal and Fluid
Science, 138(July 2021), 110675. https://doi.org/
10.1016/j.expthermflusci.2022.110675
In Vitro Flow Study in an Intracranial Aneurysm Biomodel Manufactured by Additive Manufacturing
125
