
Ensemble Learning for Cough-Based Subject-Independent
COVID-19 Detection
Vincenzo Conversano and Stavros Ntalampiras
a
Department of Computer Science, University of Milan, Via Celoria 18, Milan, Italy
Keywords:
Medical Acoustics, Audio Pattern Recognition, Machine Learning, COVID-19 Detection.
Abstract:
This paper belongs to the medical acoustics field and presents a solution for COVID-19 detection based on the
cough sound events. Unfortunately, the use of RT-PCR Molecular Swab tests for the diagnosis of COVID-19
is associated with considerable cost, is based on availability of suitable equipment, requires a specific time
period to produce the result, let alone the potential errors in the execution of the tests. Interestingly, in addition
to Swab tests, cough sound events could facilitate the detection of COVID-19. Currently, there is a great
deal of research in this direction, which has led to the development of publicly available datasets which have
been processed, segmented, and labeled by medical experts. This work proposes an ensemble composed of
a variety of classifiers suitably adapted to the present problem. Such classifiers are based on a standardized
feature extraction front-end representing the involved audio signals limiting the necessity to design handcrafted
features. In addition, we elaborate on a prearranged publicly available dataset and introduce an experimental
protocol taking into account model bias originating from subject dependency. After thorough experiments,
the proposed model was able to outperform the state of the art both in patient-dependent and -independent
settings.
1 INTRODUCTION
The coronavirus disease, widely known as COVID-
19, is a severe acute respiratory syndrome (SARS-
CoV2) which first appeared in Wuhan, China, and
quickly spread to the entire world
1
. COVID-19,
which has been declared a pandemic by the World
Health Organization, causes severe infections to the
respiratory human system and is associated with very
high mortality rates as it has led to approximately 5.7
million deaths. A fundamental step towards facing
and potentially containing this pandemic consists in
having available knowledge regarding contamination,
i.e. reliable testing tools (Lippi et al., 2020). This
posed a significant challenge since testing tools might
be time-consuming and/or of limited quantities to sat-
isfy the ever-growing demand. Unfortunately, the
COVID-19 pandemic demonstrated the lack of suit-
able testing capacity across the globe
2
. The world is
facing an unprecedented loss of human lives, not to
mention the huge consequences across the entire eco-
a
https://orcid.org/0000-0003-3482-9215
1
https://www.who.int/emergencies/diseases/novel-
coronavirus-2019
2
https://www.aacc.org/science-and-research/covid-19-
resources/aacc-covid-19-testing-survey
nomic sector, where there are large inequalities be-
tween developed and developing countries (Nessiem
et al., 2021). Such inequalities are particularly evi-
dent in testing equipment and materials in develop-
ing countries resulting to poor assessment in the dif-
fusion of the virus in the community and ineffective
decision making regarding lockdown measures with
severe consequences on the society. Such a challenge
could be lightened by the availability of pre-screening
tools which are inexpensive and can be easily ac-
cessed by interested subjects. This work is based on
the premises that the analysis of cough sound events
could comprise such a pre-screening tool.
Motivated by the specific problem, during the last
couple of years there has been a great deal of research
in the field of medical acoustics (Poir
`
e et al., 2022;
Cozzatti et al., 2022) focusing on the use of signal
processing and pattern recognition algorithms for the
diagnosis and prognosis of COVID-19 suspected pa-
tients. There are several works in the field of image
processing which employ lung radiographs (X-rays)
or lung computed tomography (CT) scans. However,
these methods are certainly invasive and imply a con-
siderable cost (Casiraghi et al., 2020; Ning et al.,
2020). Indeed, the usage of audio signal processing
and pattern recognition tools has been shown to fa-
798
Conversano, V. and Ntalampiras, S.
Ensemble Learning for Cough-Based Subject-Independent COVID-19 Detection.
DOI: 10.5220/0011651700003411
In Proceedings of the 12th International Conference on Pattern Recognition Applications and Methods (ICPRAM 2023), pages 798-805
ISBN: 978-989-758-626-2; ISSN: 2184-4313
Copyright
c
2023 by SCITEPRESS – Science and Technology Publications, Lda. Under CC license (CC BY-NC-ND 4.0)
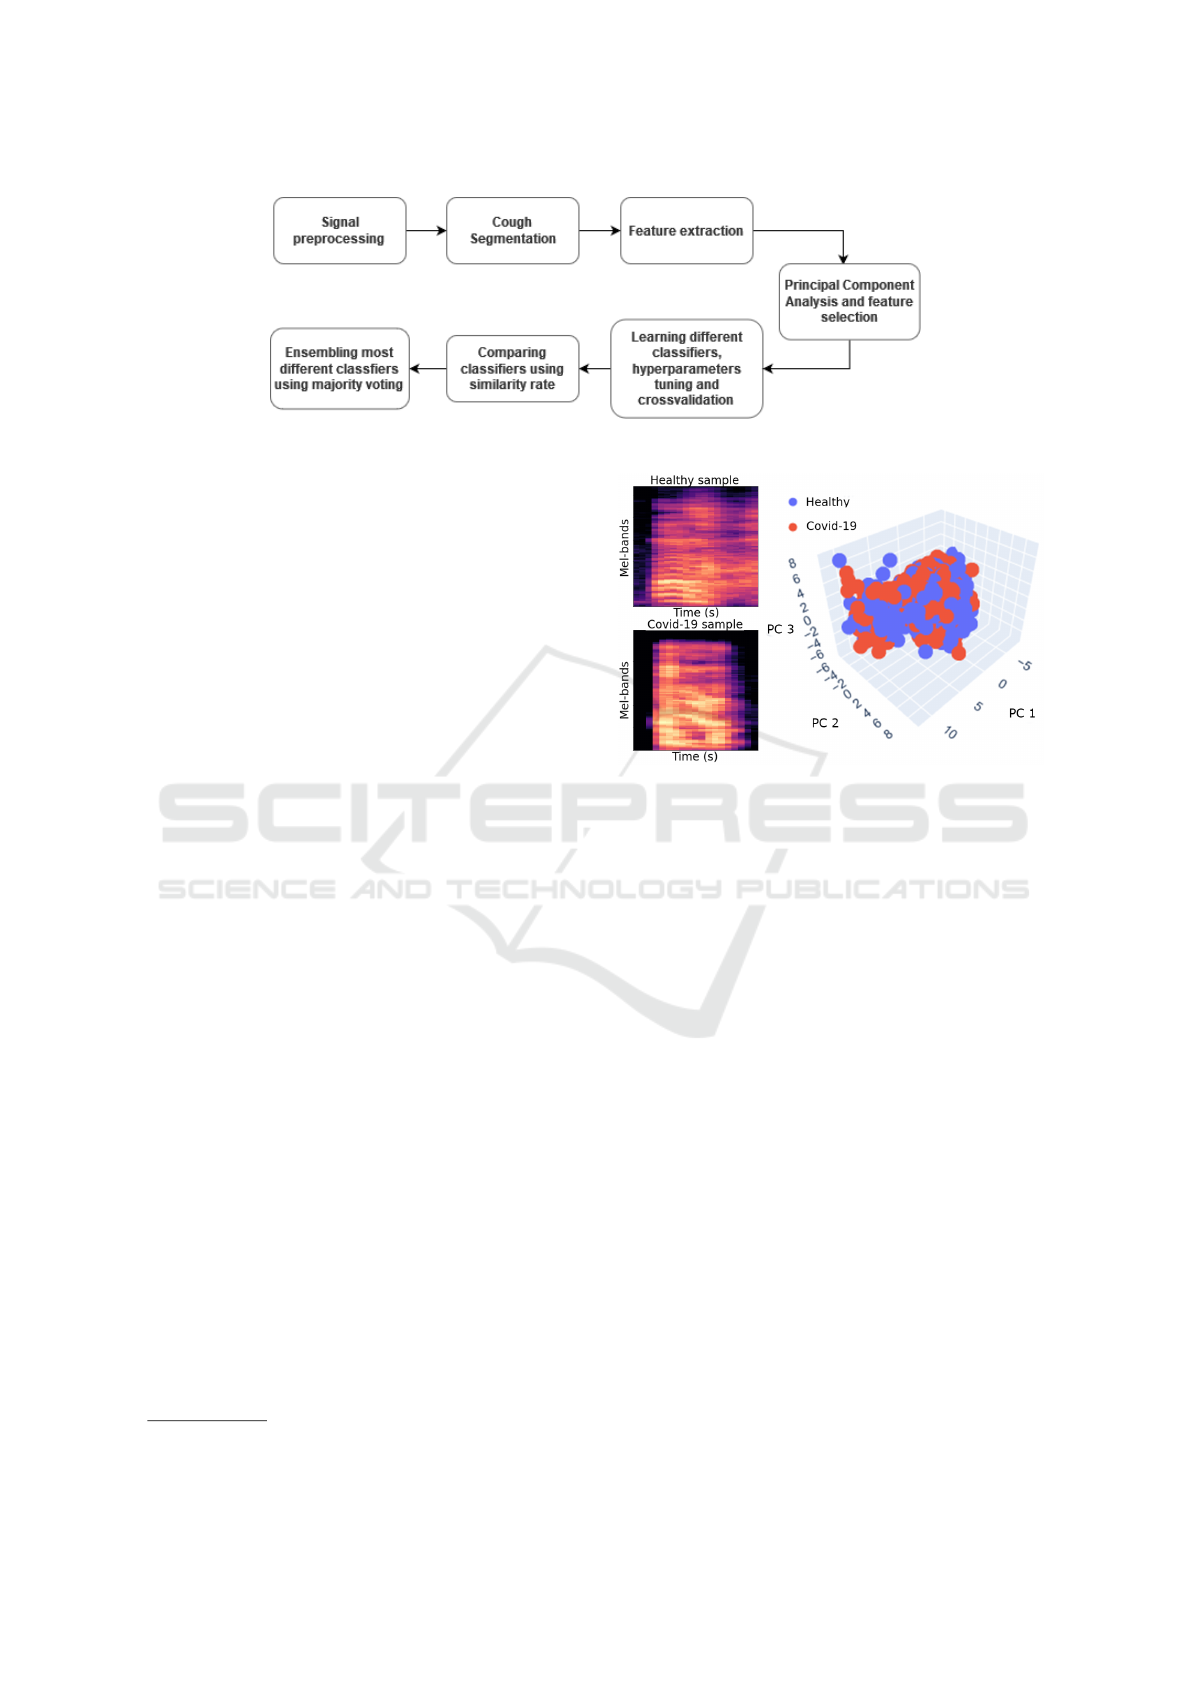
Figure 1: The block-diagram of the proposed method for diagnosing COVID-19 in cough sound events.
cilitate the diagnosis of respiratory diseases (Ntalam-
piras and Potamitis, 2019). Interestingly, during the
last couple of years, several researchers have followed
such a line of thought and approached the COVID-
19 detection problem based on the associated cough
sound events. The literature includes several audio
processing methodologies (both handcrafted features
and automatically discovered) combined with various
classification mechanisms, where the efficacy of both
traditional and deep learning methods has been in-
vestigated. Some representative papers are described
next. Tena et al. (Tena et al., 2022) designed an
automated front-end combined with Random Forest
classifier while they employed a combination of pro-
prietary and publicly available datasets. Imran et al.
(Imran et al., 2020) developed a smartphone applica-
tion which is based on Mel-spectrograms and a Con-
volutional Neural Network using a proprietary dataset
recorded using a smartphone. Last but not least, Er-
dogan and Narin (Erdo
˘
gan and Narin, 2021) report
a framework exploiting both traditional and deep-
learned features modeled by means of Support Vector
Machines using data captured by a mobile applica-
tion
3
.
A common challenge in existing works is the
availability of reliable data along with a standardized
experimental protocol. For example, most studies
report results based on cross validation experiments
without mentioning whether a subject independent di-
vision was followed which might introduce a bias in
the analysis. Moreover, when using multiple datasets
it is essential that data balancing and a consistent an-
notation protocol are followed.
Unfortunately, to the best of our knowledge such
aspects have not been considered so far in the re-
lated literature. The only work which scratches the
surface of these issues is reported in (Xia et al.,
2021) where a systematic comparison of available
datasets is included. It comes out that the only dataset
which has been processed and labeled by medical ex-
perts is COUGHVID (Orlandic et al., 2021). Im-
3
https://virufy.org/
Figure 2: Representative Mel-scaled spectrograms of a
COVID-19 and a healthy sample along with the PCA-based
visualization of the feature space.
portantly, it encompasses more that 2,800 record-
ings which have been annotated by four experienced
physicians to diagnose medical abnormalities present
in the coughs. Cough sound events labeled as symp-
tomatic and COVID-19 originate from countries with
high infection rates. As such, it is reliable, e.g. not
based solely on crowd-sourced data; nonetheless it is
of limited quantity and not adequate to train very deep
models. On top of that, it is publicly available, i.e.
every interested researcher can access it, thus provid-
ing the opportunity of adopting a standardized experi-
mental protocol facilitating the comparison of diverse
frameworks.
Motivated by the above, this work a) considers
a subject-independent experimental protocol, b) is
based exclusively on reliable and publicly available
data ensuring reproducibility, c) optimizes a series
of classifiers to the specific problem, the learning
of which does not require enormous data quantities,
d) proposes a systematic cooperative framework com-
bining the benefits of heterogeneous classifiers, and
e) addresses the need of prediction interpretability
since the operations carried out by the considered
classifiers can be easily backtracked to the input fea-
tures which are free from domain expertise.
Ensemble Learning for Cough-Based Subject-Independent COVID-19 Detection
799

2 THE PROPOSED COVID-19
DETECTION FRAMEWORK
This section describes the two main modules of the
proposed framework, i.e. feature extraction and clas-
sification.
2.1 Feature Extraction and PCA-Based
Visualization
Aiming at a standardized front-end, i.e. not necessi-
tating domain expertise, we employed the following
audio features, which are considered informative for
generalized sound recognition:
• Mel-Frequency Cepstral Coefficients (40 fea-
tures): They comprise a summarization of the
spectrum, appropriately converted in the Mel
scale and spaced using the log operator (Ntalam-
piras, 2020b).
• MFCCs derivative (40 features): they are useful
to understand the direction of the evolving power
spectrum over time.
• Spectral Contrast (7 features): it monitors the dif-
ference between peak and valley energy across the
frequency content.
Fig. 2 demonstrates Mel-scaled spectrograms, i.e.
before the application of DCT, extracted out of repre-
sentative healthy and COVID-19 cough sound events.
In order to compare the subsets of the features and
identify the optimal combination, we computed the
PCA plots and F1-score for every combination. As
we see in Table 1, the best-performing subset con-
sists in MFCCs and Contrast. A PCA-based visual-
ization of the obtained feature space is illustrated in
Fig. 2, where we see a great overlap between healthy
and COVID-19 recordings.
2.2 Classification Models
This section describes briefly the considered classi-
fication models including information regarding the
hyper-parameters optimization process. Classifiers of
heterogeneous characteristics were included aiming
at an ensemble able to benefit from the advantages
of each individual classifier. Each one was cross-
validated and tuned to optimize the F1-score in each
fold, while data division was kept constant during ev-
ery experimental phase. For each fold, we stored pre-
dictions of the test samples with respect to each opti-
mized classifier. These predictions allowed us to com-
pute global performance metrics and, importantly, a
similarity score between classifiers which was con-
sidered when populating the ensemble.
2.3 k-Nearest Neighbors
k-NN classifier is a lazy learner that does not cre-
ate explicit models but rather exploits the k-nearest
neighbors’ classes to categorize new data points. The
parameters we tuned for this classifier are:
• N: is represents the number of neighbors con-
sidered when making a prediction (search space
{1,3,5,7,9,11,13,15}).
• Weighting scheme: it describes the way neighbor-
hood points are weighted (uniform or distance-
based)
• Metric: it is the distance metric used to evalu-
ate neighbors; it was optimized among Euclidean,
and Manhattan.
• Algorithm: it defines the type of algorithm used
for searching the nearest neighbors; it was opti-
mized among auto, ball-tree, kd-tree, and brute.
• Leaf size: it is used in the case
of ball-tree or kd-tree (search space
{10,20,30,40,50,60,70,80,90}).
2.4 Random Forest
The specific classifier creates multiple weak-learners
(that demonstrate high variance but low bias) and
combine them in order to robustify the achieved pre-
dictions (Ho, 1998). The Random Forest algorithm
fits a plethora of Decision Trees (DT), typically on
different bootstrap samples, while each tree elabo-
rates on a random subset of features. Here, the fol-
lowing parameters were tuned:
• N-estimators: the number of DT (search space:
from 10 to 200 with step 10).
• Max depth: the maximum depth of each DT. It
should be noted that growing very deep trees can
lead to overfitting (search space {2,8,16,32,50}).
• Min samples split: it represents the minimum
number of samples required to split a node (search
space {2,4,6}).
• Min samples leaf: it represents the minimum
number of samples required for a node to be con-
sidered a leaf (search space {1,2}).
• Max features: the maximum number of features to
consider when searching for the best split (search
space {
√
# f eatures,log
2
(# f eatures)}.
• Bootstrap: considering the entire dataset or boot-
strap samples for growing each tree.
ICPRAM 2023 - 12th International Conference on Pattern Recognition Applications and Methods
800

Table 1: Performance comparison between subsets of features (the highest F1 score is emboldened).
Features subset F1 score
MFCCs, MFCCs-delta, Contrast 0.7153
MFCCs, MFCCs-delta 0.7144
MFCCs, Contrast 0.7385
MFCCs-delta, Contrast 0.6983
MFCCs-delta 0.7056
Contrast 0.6352
MFCCs 0.7303
2.5 Extra Trees
Even though the Extra Trees classifier follows a simi-
lar line of thought as RF, there is a relevant difference
when choosing the thresholds to use for each split.
In fact, these are drawn randomly for each candidate
feature and the optimal point is chosen as the splitting
rule. Such randomness may provide a diverse type of
information to the ensemble, while reducing the com-
putational complexity (Geurts et al., 2006). Finally,
the parameters which need tuning are the same with
the RF classifier.
2.6 Support Vector Machine
Support Vector Machines map the initial feature space
X to a higher dimensional one φ(X) and aim at dis-
covering a hyperplane that separates the training in-
stances into two classes. As such, they are based
on the assumption that in higher dimensional spaces,
there is a hyperplane dividing the data representing
different classes (Cortes and Vapnik, 1995).
Here, the parameters that need tuning are:
• C: a regularization parameter that in the context of
soft-margin SVMs regulates the trade-off between
maximizing the margin and minimizing the train-
ing error. The larger C the more emphasis will be
placed on minimizing the training error. Usually,
it is preferable to achieve a reasonable training er-
ror at a larger margin to avoid model overfitting
(search space {0.1,1,10,100,1000}).
• Kernel function: computations in the high dimen-
sional space involve the dot product φ(x
1
)·φ(x
j
),
which has been defined as the Kernel function; in-
terestingly, it is expressed in the original feature
space and it avoids the necessity of defining the
mapping function. The following functions have
been explored: Radial Basis Function, Polyno-
mial, and Linear.
• Degree: it is used in case of Polynomial kernel
function (search space: {1, 2, 3, 4, 5, 6, 7, 8, 9}).
• Gamma: it represents the allowable curva-
ture of the decision boundary (search space:
{1/# f eatures ×var(X ), 1/# f eatures}).
2.7 Light Gradient Boosting Machine
This classifier sequentially fits a group of DTs, where
each training iteration focuses on previously misclas-
sified samples as revealed by Residual Errors. We em-
ployed the gradient boosting framework LightGBM
(Ke et al., 2017) which can operate efficienlty in dis-
tributed settings.
LightGBM is formed by the following parameters:
• N-estimators: the number of trees to grow (search
space: from 10 to 200 with step 10).
• Max depth: the maximum depth of each tree
(search space: {2,8,16,32,50}).
• Min child samples: it denotes the minimum num-
ber of samples required for a node to be consid-
ered as a leaf (search space {1,2}).
• Learning rate: it is the boosting learning rate
(search space {0.01,0.1,0.2,0.3}).
2.8 Multilayer Perceptron
A Multilayer Perceptron network employs multiple
perceptrons distributed in a multi-layered scheme
where the techniques of Gradient Descent and Back-
propagation are applied to update the included
weights and learn the characteristics of the training
set (Rumelhart et al., 1986).
The parameters we tuned for this classifier are:
• Number of layers (search space {1,3,5}).
• Number of units: it is the number of perceptrons
for a layer (search space: from 32 to 128).
• Dropout rate: it discards information in order to
avoid overfitting (search space: from 0.1 to 0.9
with step 0.1).
• Learning rate: it represents the rate with which
each weight is updated (search space: from
0.00001 to 0.1).
Ensemble Learning for Cough-Based Subject-Independent COVID-19 Detection
801
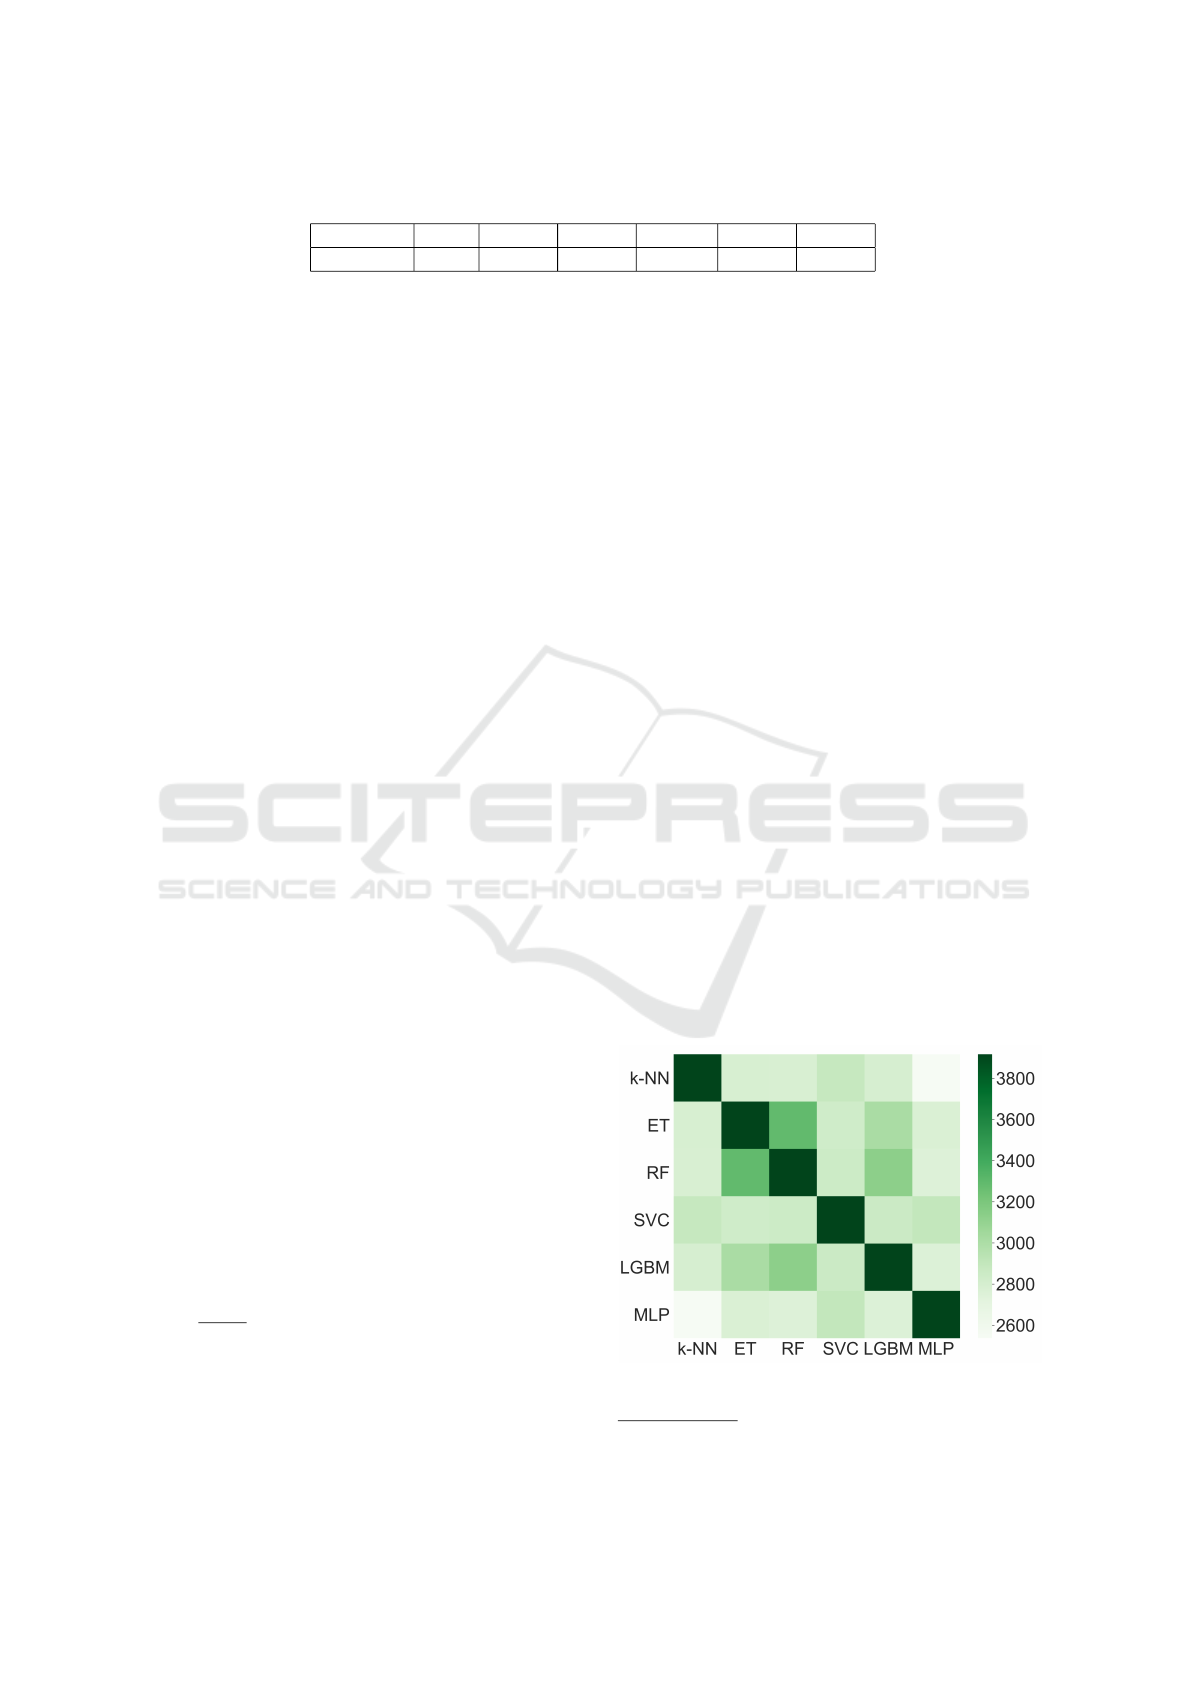
Table 2: Similarity-based ranking of the considered classifiers (in ascending order).
Classifier MLP k-NN SVM LGBM ET RF
Θ
i
0.7 0.7037 0.7304 0.7423 0.7497 0.7552
• Decay: it modifies the learning rate over time
(search space: from 0.000001 to 0.01).
• Batch size: it represents the quantity of data points
considered in each training iteration (search
space: from 8 to 512 with step 8).
It should be noted that the number of units along with
the dropout rate are not fixed and may change over the
layers.
3 SOFT MAJORITY VOTING
SCHEME
Combining predictions obtained from various classi-
fiers of heterogeneous properties may lead to perfor-
mance improvements (Ntalampiras, 2020a). To this
end, we create a collaborative meta-classifier that uses
a Majority Voting scheme to perform the final clas-
sification based on the predictions of the individual
classifiers.
More specifically, we employed a soft voting
scheme where every classifier can predict the prob-
ability for a sample to belong to a class and the final
prediction is the class maximizing the sum of proba-
bilities, i.e.
prediction = argmax
y∈Y
|C|
∑
i=1
P(C
i
(x) = y),
where x is the extracted feature vector, C the set of
classifiers of the ensemble, P(C
i
(x) = y) the probabil-
ity of a correct prediction given classifier C
i
, and |•|
denotes the cardinality operator.
In order to maximize the efficiency the ensemble,
it is preferable to encompass diverse methodologies;
as such, we performed a pair-wise comparison be-
tween the available classifiers (Dietterich, 2000). To
this end, for each pair of classifiers (i, j), we com-
puted their similarity λ
i j
as the number of equally
classified samples. The result is demonstrated in Fig.
3. Subsequently, we used these similarity scores to
compute for each classifier a global similarity score
Θ
i
=
1
6×3917
×
∑
j∈C
λ
i j
, where 6 is the number of
considered classifiers and 3917 the number of testing
samples. The obtained ranking is shown in Table 2.
After early experimentations, we decided to heuristi-
cally populate the ensemble with the top four classi-
fiers, i.e. the most dissimilar four.
4 EXPERIMENTAL SETUP AND
RESULTS
This section describes a) the data preprocessing, seg-
mentation and filtering processes, b) the parameter-
ization of the included features and classifiers, and
c) the experimental results including a comparison
with the state of the art.
4.1 Data Preprocessing and Cough
Segmentation
Keeping in mind the reproducibility of the experi-
ments, this work is based on the publicly-available
COUGHVID dataset
4
, which the largest COVID-19
audio dataset. As shown in Table 3, the dataset
is highly unbalanced across the considered classes,
i.e. healthy, unknown, symptomatic, and confirmed
COVID-19 cases. As such, we analyzed the distribu-
tion of the cough detected attribute provided in the
metadata, reporting the probability of cough sound
events in a given audio sample (Orlandic et al., 2021).
This attribute was computed using a XGB classifier,
trained and validated on 68 audio features (MFCCs,
EEPD, ZCR, etc.) of 215 randomly selected audio
samples. Since a threshold of 0.8 resulted in an aver-
age precision of 95.4%, it was used during the filter-
ing phase. Thus, we discarded audio samples a) with
cough detection score less than 0.8, b) labeled as un-
known or symptomatic, c) of poor quality based on
Figure 3: Similarity heatmap representing scores λ
i j
’s for
every pair of considered classifiers.
4
https://zenodo.org/record/4498364#.YcbxwVnSJPY
ICPRAM 2023 - 12th International Conference on Pattern Recognition Applications and Methods
802

Table 3: Composition of the COUGHVID dataset (Orlandic
et al., 2021).
Class #audio samples Avg. duration (s)
Healthy 12479 7.58
Unknown 11326 7.27
Symptomatic 2590 7.57
COVID-19 1155 7.65
the associated label, and d) that were not analyzed
by medical experts. It should be noted that symp-
tomatic label denotes audio samples that come from
people who present COVID-19 symptoms but have
not received a diagnosis, i.e. they are not confirmed
cases. Interestingly, such a cough segmentation pro-
cess resulted in 509 healthy audio samples encom-
passing 2088 cough sound events, and 454 confirmed
COVID-19 audio samples with 1829 cough sound
events.
It should be mentioned that all audio signals were
sampled at 22050Hz, while cough segmentation is
based on the hysteresis comparator of the signal’s en-
ergy (Orlandic et al., 2021). As such, the updated
dataset containing only cough segments exhibits a sat-
isfactory balance across the healthy and COVID-19
classes.
4.2 Framework Parameterization
This section describes the parameterization process of
the feature extraction and classification phases. As
regards to the feature extraction process:
• MFCCs: 40 DCT coefficients were used along
with hamming-windowed frames of size 25 ms
overlapped by 50%. The FFT size is 512.
• Spectral Contrast: 7 dimensions were employed
to characterize it.
It should be mentioned that z-score normalization was
used (x
norm
=
x−¯x
s
) while the features were averaged
across each segmented cough.
For each of the considered classifiers, we carried
out ten fold cross-validation, while during each iter-
ation, hyperparameters were tuned to maximize F1-
score on a subsplit, i.e. 30%, of the training set. The
best-performing parameters with respect to each clas-
sification model, i.e. the ones that achieved the high-
est F1-score on are tabulated in Table 4.
4.3 Experimental Results
In this section, we report the experimental results and
compare the performance of the proposed COVID-19
detection framework to existing works addressing the
same task. Aiming at a reliable comparison, we relied
on figures of merit which are well-established in the
related literature, i.e. F1-score, Sensitivity, and Speci-
ficity along with the ten-fold cross validation data di-
vision scheme. The achieved results are tabulated in
Table 5.
First, we observe that there is a significant dif-
ference when subject dependency is considered dur-
ing the data division process. The experiments con-
firm that cough sound events are not statistically inde-
pendent since training and testing on samples coming
from the same subject heavily influences the models’
performance. More precisely, we see that all figures
of merit improve with the F1 score increasing from
0.6 to 0.82, sensitivity from 0.6 to 0.8 and specificity
from 0.64 to 0.84 when the proposed framework is
used. As such, the bias introduced by including sam-
ples of the same subject in both train and test sets is
confirmed and this point should be considered when
conducting future research. Moreover, it is not rea-
sonable to assume a-priori availability of COVID-19
samples of a subject existing in the testing set, mean-
ing that it would have to be a least the second time
that the specific subject is infected.
Second, we observe that the performance reached
by the proposed framework is encouraging, especially
when considering that samples of different classes are
acoustically similar (see also Fig. 2) to the extent that
a non-expert human listener can assess. This high-
lights the great necessity of reliable data annotated by
medical experts. In fact, the obtained figures of merit
are well above chance, while the F1-score is 0.6. In-
terestingly, true positive and negative rates are 0.6 and
0.64 which demonstrates that the framework is almost
equally effective in identifying healthy and infected
cough sound events. This feature is particularly im-
portant given that our aim at a pre-screening tool, so
that not only potential COVID-19 cases are correctly
identified but, at the same time, unnecessary use of
medical services is limited. The overall performance
of the ensemble is severely boosted when a subject
dependent protocol is followed as explained earlier.
Third, we carried out a comparison with ap-
proaches using the same experimental protocol and
dataset. In Table 5, we see that the ensemble signif-
icantly outperforms (Rao et al., 2021) and (Agbley
et al., 2020) which achieve F1 score of 0.4 and 0.62
in a subject dependent setting. At the same time, it
offers a balanced sensitivity and specificity figures of
merit.
The results confirm that a summarized Mel-scaled
spectrum modeled by a set of diverse classification al-
gorithms may provide efficient COVID-19 detection
in cough sound events. An important characteristic of
the proposed solution is the ability of the ensemble
Ensemble Learning for Cough-Based Subject-Independent COVID-19 Detection
803

Table 4: Classifiers’ parameters after optimization.
Classifier Parameters
k-Nearest Neighbors N-neighbors: 1, Weights: uniform
Metric: Euclidean, Leaf size: 10
Random Forest N-estimators: 190, max depth: 16
Min samples split: 6, Min samples leaf: 2
Max features: log2, Bootstrap: false
Extra Trees N-estimators: 190, max depth: 50
Min samples split: 4 , Min samples leaf: 1
Max features: auto, Bootstrap: false
Support Vector Machine C: 10, kernel function: poly
Degree: 5, Gamma: auto
Light Gradient N-estimators: 160, Max depth: 50
Boosting Machine Min child samples: 2, Learning rate: 0.3
Multilayer Perceptron Number of layers: 5
Number of units: 128, 32, 32, 128, 32
Dropout rate: 0, 0, 0, 0.9, 0
Learning rate: 0.1, Decay: 0.01, Batch: 512
Table 5: The figures of merit achieved by the proposed and contrasted approaches (SI: subject independent, SD: subject
dependent). The highest one w.r.t each protocol is emboldened.
Work (protocol) F1-score Sensitivity Specificity
Ensemble (SI) 0.59±0.04 0.59±0.05 0.64±0.05
Ensemble (SD) 0.81±0.01 0.82±0.03 0.83±0.01
k-NN (SD) 0.69 ±0.03 0.64 ±0.02 0.74 ±0.03
RF (SD) 0.66 ±0.03 0.71 ±0.04 0.70 ±0.02
ET (SD) 0.63 ±0.04 0.72 ±0.04 0.68 ±0.02
SVM (SD) 0.71 ±0.03 0.71 ±0.03 0.74 ±0.03
LGBM (SD) 0.66 ±0.03 0.67 ±0.02 0.70 ±0.03
MLP (SD) 0.59 ±0.18 0.70 ±0.05 0.68 ±0.06
VGG-13 (SD) (Rao et al., 2021) 0.40 0.26 0.96
Wavelets (SD) (Agbley et al., 2020) 0.62 0.54 0.74
model to combine the advantages of each individual
model. In fact, as shown in Table 5, the ensemble
was able to provide: 1. improved performance with
respect to all individual models in subject dependent
experimental protocols; 2. satisfying performance in
subject independent experimental protocol.
Lastly, in case multimodal approaches are consid-
ered, where several clinical variables are fed to the
model, the work by Ahmed et al. (Fakhry et al., 2021)
comprises the state of art with F1 score 0.91, sensi-
tivity 0.85 and specificity 0.99, while considering a
subject independent protocol.
5 CONCLUSIONS
This article described a COVID-19 detection frame-
work based on an ensemble model combining the ad-
vantages of individual classifiers. After extensive ex-
periments considering the statistical dependency of
the available cough sound events, it was shown that
such a synergistic framework surpasses the state of
the art, and closes the gap existing between audio-
based and multimodal detection approaches. Impor-
tantly, the present experimental set-up is based on a
publicly available dataset, while the results are fully
reproducible and available at https://github.com/vin
cenzoconv99/.
We believe that the dataset-related considerations
expressed in this work are important to continue con-
ducting research on a problem of such critical im-
portance. In the future, as more data become avail-
able, we are going to experiment with deep learn-
ing based methods including automated feature learn-
ing and embedded prediction interpretability, which is
rapidly becoming a standard requirement in modern
AI-based tools and methodologies (European Com-
mission, 2020).
ICPRAM 2023 - 12th International Conference on Pattern Recognition Applications and Methods
804

REFERENCES
Agbley, B. L. Y., Li, J., Haq, A. U., Cobbinah, B.,
Kulevome, D. K. B., Agbefu, P. A., and Eleeza, B.
(2020). Wavelet-based cough signal decomposition
for multimodal classification. 2020 ICCWAMTIP,
pages 5–9.
Casiraghi, E., Malchiodi, D., Trucco, G., Frasca, M., Cap-
pelletti, L., Fontana, T., Esposito, A. A., Avola, E.,
Jachetti, A., Reese, J., Rizzi, A., Robinson, P. N.,
and Valentini, G. (2020). Explainable machine learn-
ing for early assessment of covid-19 risk prediction
in emergency departments. IEEE Access, 8:196299–
196325.
Cortes, C. and Vapnik, V. (1995). Support-vector networks.
Machine Learning, 20(3):273–297.
Cozzatti, M., Simonetta, F., and Ntalampiras, S. (2022).
Variational autoencoders for anomaly detection in res-
piratory sounds. In Lecture Notes in Computer Sci-
ence, pages 333–345. Springer Nature Switzerland.
Dietterich, T. G. (2000). Ensemble methods in machine
learning. In Multiple Classifier Systems, LBCS-1857,
pages 1–15. Springer.
Erdo
˘
gan, Y. E. and Narin, A. (2021). COVID-19 de-
tection with traditional and deep features on cough
acoustic signals. Computers in Biology and Medicine,
136:104765.
European Commission (2020). White paper on artificial
intelligence: a european approach to excellence and
trust. Technical report, Brussels.
Fakhry, A., Jiang, X., Xiao, J., Chaudhari, G., Han, A., and
Khanzada, A. (2021). Virufy: A multi-branch deep
learning network for automated detection of COVID-
19. CoRR, abs/2103.01806.
Geurts, P., Ernst, D., and Wehenkel, L. (2006). Extremely
randomized trees. Machine Learning, 63(1):3–42.
Ho, T. K. (1998). The random subspace method for con-
structing decision forests. IEEE Transactions on
PAMI, 20(8):832–844.
Imran, A., Posokhova, I., Qureshi, H. N., Masood, U., Riaz,
M. S., Ali, K., John, C. N., Hussain, M. I., and Nabeel,
M. (2020). AI4covid-19: AI enabled preliminary di-
agnosis for COVID-19 from cough samples via an
app. Informatics in Medicine Unlocked, 20:100378.
Ke, G., Meng, Q., Finley, T., Wang, T., Chen, W., Ma, W.,
Ye, Q., and Liu, T.-Y. (2017). Lightgbm: A highly ef-
ficient gradient boosting decision tree. NIPS’17, page
3149–3157, Red Hook, NY, USA. Curran Associates
Inc.
Lippi, G., Mattiuzzi, C., Bovo, C., and Plebani, M. (2020).
Current laboratory diagnostics of coronavirus disease
2019 (covid-19). Acta Bio Medica Atenei Parmensis,
91(2):137–145.
Nessiem, M. A., Mohamed, M. M., Coppock, H., Gaskell,
A., and Schuller, B. W. (2021). Detecting covid-19
from breathing and coughing sounds using deep neu-
ral networks. In 2021 IEEE CBMS, pages 183–188.
Ning, W., Lei, S., Yang, J., Cao, Y., Jiang, P., Yang, Q.,
Zhang, J., Wang, X., Chen, F., Geng, Z., Xiong, L.,
Zhou, H., Guo, Y., Zeng, Y., Shi, H., Wang, L., Xue,
Y., and Wang, Z. (2020). Open resource of clinical
data from patients with pneumonia for the prediction
of COVID-19 outcomes via deep learning. Nature
Biomedical Engineering, 4(12):1197–1207.
Ntalampiras, S. (2020a). Collaborative framework for auto-
matic classification of respiratory sounds. IET Signal
Processing, 14(4):223–228.
Ntalampiras, S. (2020b). Identification of anomalous
phonocardiograms based on universal probabilistic
modeling. IEEE Letters of the Computer Society,
3(2):50–53.
Ntalampiras, S. and Potamitis, I. (2019). Classification of
sounds indicative of respiratory diseases. In Engineer-
ing Applications of Neural Networks, pages 93–103.
Springer International Publishing.
Orlandic, L., Teijeiro, T., and Atienza, D. (2021). The
COUGHVID crowdsourcing dataset, a corpus for the
study of large-scale cough analysis algorithms. Scien-
tific Data, 8(1):3–2.
Poir
`
e, A. M., Simonetta, F., and Ntalampiras, S. (2022).
Deep feature learning for medical acoustics. In
Lecture Notes in Computer Science, pages 39–50.
Springer Nature Switzerland.
Rao, S., Narayanaswamy, V., Esposito, M., Thiagarajan, J.,
and Spanias, A. (2021). Deep learning with hyper-
parameter tuning for covid-19 cough detection. In
2021 IISA, pages 1–5.
Rumelhart, D. E., Hinton, G. E., and Williams, R. J. (1986).
Learning Representations by Back-propagating Er-
rors. Nature, 323(6088):533–536.
Tena, A., Clari
`
a, F., and Solsona, F. (2022). Automated de-
tection of COVID-19 cough. Biomedical Signal Pro-
cessing and Control, 71:103175.
Xia, T., Spathis, D., Brown, C., Ch, J., Grammenos, A.,
Han, J., Hasthanasombat, A., Bondareva, E., Dang, T.,
Floto, A., Cicuta, P., and Mascolo, C. (2021). COVID-
19 sounds: A large-scale audio dataset for digital
COVID-19 detection. In Thirty-fifth Conference on
Neural Information Processing Systems Datasets and
Benchmarks Track (Round 2).
Ensemble Learning for Cough-Based Subject-Independent COVID-19 Detection
805
