
A Basic Tool for Improving Bad Illuminated Archaeological Pictures
Michela Lecca
a
Fondazione Bruno Kessler, Digital Industry Center, Technologies of Vision, via Sommarive 18, Trento 38122, Italy
Keywords:
Image and Contrast Enhancement, R et inex Theory, von Kries Model, Archeological Images.
Abstract:
Gathering visual documentation of archaeological sites and monuments helps monitor their status and pre-
serve and transmit the memory of the cultural heritage. Good lighting is essential to provide pictures with
clear visibility of details and content, but it is a challenging task. Indeed, illuminating a site may require
complex infrastructures, while uncontrolled lights may damage the artifacts. In this framework, computer
vision techniques may greatly help archeology by relighting and/or improving the images of archaeological
objects that cannot be acquired under a good li ght. This work presents MEEK, a basic tool to improve low-
light, back-light and spot-light images, increasing the visibility of their details and content, while mitigating
undesired effects due to illumination. MEEK embeds three algorithms: the Retinex inspired image enhancer
SuPeR, the backlight and spotlight image relighting method REK, and the popular contrast enhancer CLAHE.
One or more of these algorithms can be applied to the input image, depending on the light conditions of the
acquired environments as well as on the final task for which the image is used. Here, MEEK is tested on many
archaeological color pictures with bad light showing good performance. The code of MEEK is freely available
at https://github.com/MichelaLecca/MEEK.
1 INTRODUCTION
Archeology enables us to le arn about the past an d
build the future based on the experience of our an-
cestors. Preserving and monitoring the condition
of ancient artworks, like archaeological sites, paint-
ings, mosaics, monuments, is the key to passing on
a wide cross-section of hum a n knowledge to future
generations. In this context, computer vision tech-
niques can be of great help in collecting visual d oc-
uments of imp ortant past artifacts, classifying them
accordin g to their visual features, monitoring sites
from satellites, as well as planning non-intr usive ac-
tions for the ir con servation and renovation (van der
Maaten et al., 2006), (Brutto and Meli, 2012), (Trav-
iglia et al., 2016), (Engel et al., 2019), (Resler et al.,
2021), (Monna et al., 2 021). For all these tasks, good
light conditions are essential to obtain pictures wher e
the content and the details of the objects of interest
are clearly visible. Nevertheless, in general, such a
requirement is hard to be satisfied and may need for
complex, expensive infrastructures. This is th e case
with objects positioned in hard-to-reac h places and
paintings th at can be da maged by uncontrolled lights.
In this context, image enhancement technique s pro-
vide non-invasive so lutions to recover better, global
a
https://orcid.org/0000-0001-7961-0212
and local visibility of the content a nd details of the
acquired scene.
This work presents a basic too l for enhancing pic-
tures captured under low-light, backlight and spot-
light. Low-light is weak illumination that produces
dark pictures, while back light and spotlight are highly
non-uniform lights that gene rate images with both
dark and bright region s. All these illuminations are
common in archaeological environments. For in-
stance, low-light is typical of excavations and crypts;
backlight is usual in churches and castles, where win-
dows/celling roses and small slits or crevices let in
an intense but not diffused light; spotlight is present
in places with works in progress or near break-
able, delicate stuff, where an artificial source high-
lights specific objects while obscuring the rest of
the scene. The presented tool, called MEEK from
the key-expression iMage EnhancEment Kit, emb eds
three general purpose image enhancers that can be
used individually or combined togethe r to improve
the quality of the input image. These enhancers are
the Retinex in spired method SuPeR (Lecca and Mes-
selodi, 20 19), the ba c klight image enhancer REK
(Lecca, 2022b), and the well known contrast enhancer
CLAHE (Zuiderveld, 1 994). These algorithms have
been chosen among many others because o f their low
complexity and low numbe r of parameters (one per
204
Lecca, M.
A Basic Tool for Improving Bad Illuminated Archaeological Pictures.
DOI: 10.5220/0011648800003417
In Proceedings of the 18th International Joint Conference on Computer Vision, Imaging and Computer Graphics Theory and Applications (VISIGRAPP 2023) - Volume 4: VISAPP, pages
204-211
ISBN: 978-989-758-634-7; ISSN: 2184-4321
Copyright
c
2023 by SCITEPRESS – Science and Technology Publications, Lda. Under CC license (CC BY-NC-ND 4.0)

algorithm ), as well as their p erformance. In partic-
ular, both SuPeR and REK enhance the input image
by a pixel-wise, non linear rescaling of the intensity
values of the image channels. Precisely, SuPeR sam-
ples a set of high intensity pixels over each channel
and uses the m to process the colors of the other image
pixels increa sin g the brightness and contrast of th e in-
put image, while mitigating possible chromatic dom-
inants of the ligh t. REK is a fusion-based enhancer
specifically d esigned for backlight and spotlight im-
ages. It combines th e input image with an over-
enhanced version of it through a weighted sum so that
the dark regions are improved while the bright ones
are preserved. D ifferently from SuPeR, REK does
not change the image chro maticity, i.e. the light color
is neither removed nor attenuated. Finally, CLAHE
stretches the d istribution of the image brightness (or
of the image channels, dep ending on the implemen-
tation) to incre ase the image c ontrast while limiting
the amplification of possible noise. As already men-
tioned above, these algorithms can be used individ-
ually o r applied sequentially upon the input image.
For instance, a backlight image can be processed first
by REK to improve the dark a reas, then by SuPeR
to smooth possible chromatic casts of the light, and
finally by CLAHE to further enhance the contra st.
Here, the algorithms o f MEEK and some combina-
tions of them have been tested on many real-world ar-
chaeological images and discussed on some relevant
examples. The code of MEEK is released for free on-
line (Lecca, 2022a).
2 MEEK
This Section describes the three algorithms included
in MEEK and the MEE K interface and usage.
2.1 SuPeR
SuPeR (Lecca and Messelodi, 2019) is an image en-
hancer inspired by the Retinex theory (Land et al.,
1971). As Retinex, SuPeR takes as input a color im-
age J, processes pixel-wise its color channels inde-
pendently, and re turns a new image, in which bright-
ness and contrast are increased, the color distribution
is more unifo rm and possible dominants of the light
are mitigated or even removed.
Specifically, SuPeR partitions J from a regular
grid with n tiles T
1
, . . . , T
n
, where n > 1 is an u ser
input. For each tile, SuPeR compu tes the barycen-
ter b
i
of T
i
, and for each cha nnel I it computes the set
T (I) of the n pairs (b
i
,I
i
) w here I
i
the maximum value
of I over T
i
. Then, for any pixel x of I, SuPeR maps
I(x) on a new value S(x) given by
S(x) =
I(x)
w(x)
(1)
where w(x) is a stric tly positive value computed from
T (I). Zero division is of course pr evented. Pr e cisely,
w is given by:
w(x) =
∑
(b
i
,I
i
)∈B
I
(x)
δ(x,b
i
)
I
i
∑
(b
i
,I
i
)∈B
I
(x)
δ(x,b
i
)
−1
if B
I
(x) 6=
/
0
I(x) otherwise
(2)
where B
I
(x) con tains the pairs of T (I) whose intensity
exceeds I(x), i.e.:
B
I
(x) ⊆ T (I) = {(b
i
,I
i
) ∈ T : I
i
> I(x)} (3)
and
δ(x,b
i
) = 1 −
k x − b
i
k
2
D
2
+ ε. (4)
In this last equation, k · k indicates the L
2
norm, D is
the length of the diagonal of the image support and ε
is a small, strictly positive value introduced to prevent
division by zero. S is then remapped to range over
{0, . . . , 255}. The three proce ssed channels are th en
packed into a new RGB image.
It is to note that re-working I(x) based on both
color and sp a tial features is a distinctive trait of
Retinex and is faithful to some aspects of the human
vision system. Moreover, since S(x) is a linear com-
bination of the ratios I(x)/I
i
s, it is robust to changes
of illumin ation. In fact, according to the von Kries
model, in a digital imag e , any change of color due
to a change of light is well approximated by a linear
diagona l tran sf orm (Finlayson et al., 19 94), (Lecca,
2014). Consequently, local intensity ra tios and their
linear combinations are invariant against illuminant
variations.
The name ’SuPeR’ comes from the fact that this
algorithm extracts the visual and spatial information
relevant to image enhancement from blocks of pix-
els (i.e. the tiles), that are treated as super-pixels and
each of them is represented by a po sition (i.e. the tile
barycenter) and an intensity value (i.e. the maximum
intensity over the tile).
2.2 REK
The algorithm REK (L ecca, 2022b) takes as input
a color image J with strong backlight or spotlight
and up-scales its color channels by a value α strictly
greater than o ne, i.e. J is mapped onto image K by
the following equation:
K(x) = αJ(x). (5)
A Basic Tool for Improving Bad Illuminated Archaeological Pictures
205
According to the von Kries model, this up-scaling op-
eration br ightens up the dark regions, increa sin g the
visibility of their details and content, but at the same
tim, it may over-enhance the bright regions. To avoid
over-enhancemen t, REK fuses J and K into a new im-
age R defined as:
R(x) = (1 −W (x))J(x) +W(x)K(x), (6)
where W is a weigh ting f unction, that ranges over [0,
1] and pe nalizes (awards, resp.) the intensities of the
dark ( bright, resp.) pixels of J, while awards (penal-
izes, resp.) those of K. Precisely,
W (x) =
1 −
U(x) − m
M − m
p
(7)
where U is the image luminance, i.e.
1
:
U(x) = 0.299I
r
(x) + 0.587I
g
(x) + 0.114I
b
(x), (8)
I
r
, I
g
and I
b
are the red, green and blue image chan-
nels, m and M are the minimum and maximum values
of U and p is a strictly positive, user parameter, con-
trolling the shape o f W .
Experiments p resented in (Lecca, 2022b) indicate p =
3 and p = 5 as suitable values for a good enhance-
ment. Regarding the parameter α, REK estimates its
value from U as follows:
α =
µ
B
− σ
B
µ
D
, (9)
where B and D contain respectively the pixels with U
greater than threshold τ and th ose with U smaller or
equal than τ, τ =
M− m
2
, while µ and σ d enote respec-
tively the mea n value and the standard deviation of the
set in the subscript. Within this estimate , REK pushes
the luminance of the dark regions towards that of the
bright regions without over-enhancing D. Anyway, it
is to note tha t when the bright region is close to white,
the standard variation δ
B
is close to zero and thus µ
D
is mapped to µ
B
: in this case, there is the r isk of sat-
urating some pixels in the dark regions and manual
intervention is needed to lower the value of α.
2.3 CLAHE
Increasing the visibility of image details is very im-
portant in archeology to visua lize and describe lo-
cal structures like inscriptions, mosaic tiles, signs of
erosion possible present on surfaces. This task can
be achieved by histogram equalization (HE), that re -
works the distribution of the image luminance (or o f
1
In some implementations, like that described in
(Lecca, 2022b), U(x) is defined as the mean value of the
channel intensities at x, instead of a weighted sum of them.
This difference generally does not affect the final result.
the image colors, depending on the implementation )
to obtain a new image with flatter distribution and
higher contrast. For sake of simplicity, consider the
luminance L. HE computes the histogram h of L, nor-
malizes it so th at h ranges over [0, 1], a nd applies to
the image intensity values k = 0, . . . , Z − 1 the follow-
ing transformation:
T (k) = floor
(Z − 1)
k
∑
j=0
h( j)
, (10)
where Z is the number of p ossible intensity values
(usually 256) and function floo r rounds down its argu-
ment to the nearest in teger value. Better performa nce
is reached by the so-called adaptive methods, which
basically apply HE over multiple image patches in or-
der to enhance local con trast. One drawback of these
methods is the amplification o f possible image noise,
especially in near-uniform areas, that have a peaked
histogram. The popular Contrast Limited Adaptive
Histogram Equalization (Zuiderveld, 1994) (CLAHE)
mitigates this effect, by clippin g the histogram at a
predefined thre shold c (called the clip limit) before
to com pute T . The values exceeding the clip limit
are re-distributed equally among the histogram bins,
so that the integral of h over the intensity levels re-
mains equal to 1, while h becomes flatter. Function T
is then applied by considering as h the new, clipped
histogram. The lower c, the slighter the distribution
stretching is and the less evident the enhancement of
the contrast is.
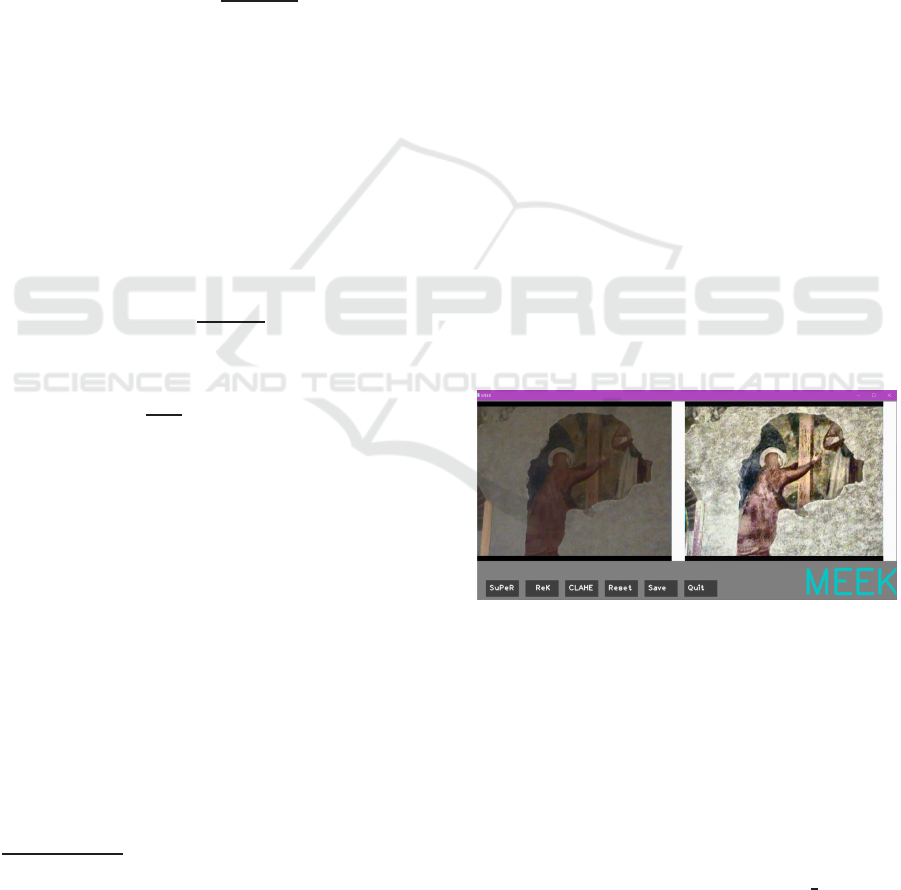
Figure 1: Interface of MEEK: on left, an image (from
Ravenna-Set), and on right its enhancement by SuPeR fol-
lowed by CLAH E.
2.4 MEEK Interface
MEEK (Lecca, 2022a) is implemented in C++
exploiting the image processing library OpenCV
(https://opencv.org/). After c ompilation, MEEK can
be used from a shell with the following syntax:
meek <input_image> <parameter.txt>
where
meek
is the executable file,
<input image>
is
the input image and
<parameter.txt>
is a text file
containing the values of the parameters of the three
VISAPP 2023 - 18th International Conference on Computer Vision Theory and Applications
206

algorithm s, i.e. n fo r SuPeR, p and α for REK and
c for CLAHE. Setting α = −1 enables the automatic
estimation of α.
Figure 1 shows an example of the MEEK inter-
face. The first three buttons at the bottom must be
pressed to run SuPeR, REK and CLAHE. The en-
hancement result will be displayed to the right of the
input image. The button ’Reset’ allows re-starting
the enhancement on the input image. Combination
of enhancement can be done by pressing sequentially
the buttons of the corresponding algorithms. For ex-
ample, to apply Su PeR and then CLAHE, the user
presses first the SuPeR button, waits for the result and
then presses the CLAHE button. T he ’Save’ button
allows to save the result in the same d irectory of the
MEEK executable file. Finally, the ’Quit’ button stops
the program and closes the window. In this imple-
mentation, CLAHE is applied on the luminance im-
age c hannel, i.e. on the L component of the image
represented in the Lab color space.
3 RESULTS
MEEK has been tested on 155 color indoor pic-
tures, grouped in three datasets named Trento-SASS,
Ravenna-Set and Backlit-Set.
Trento -SASS consists of 80 images, with size
1504 × 1004, portraying the rests of the ancient, ro-
man city of Trento (Tridentum), which was broug ht
to light during the restoration of the Social Theater o f
Trento between 1990 and 2000. These rests occupy
a wide space of 1700 squared meters about and are
located a few meters below the current level of the
city. Due to their locatio n, the images of such ruins
are low-lighted and/or present moderate backlight and
spotlight. The adjective ’moderate’ indicates that the
gap between the dark and the bright regions is neither
too small nor too high, in particular for most images
the luminance is low also on the bright regions (see
Figures 2 and 3(right) for some examples).
Ravenna-Set contains 75 images, with size 720 ×
576, taken by the author in Ravenna (Italia), sp ecif-
ically in the Mausoleum of Galla Placidia (first half
of the 5th century AD) and in some churches with
frescoes and mosaics, such as the Basilica of San Vi-
tale (530 AD a bout), the Basilica of San Giovanni
Evangelista (420 D C about) and the Basilica of San
Francesco (13th century). Also these pictures are
low-lighted and have moderate backlight/spotlight. In
particular, the images captured in the Mausoleum of
Galla Placidia are very da rk, because no lights and no
camera flashes were allowed (see Figure 3, left).
Backlit-Set contains 12 strong backlight images,
partly downloa ded from the free repositories pexels
2
and pixabay
3
, and partly acquired by the author (see
Figure 4). Nine picture s depict windows roses, while
three others show monum e nts acquired against sky.
These images are used to assess the performance of
REK in comparison with SuPeR.
All the images from these datasets have been pro-
cessed by SuPeR, REK, CLAHE, SuPeR followed by
CLAHE an d REK followed by CLAHE.
The performance of SuPeR, REK, CLAHE and
of their combination s considered here is assessed by
three numerical, objective m easures, related to the hu-
man perception and usually modified by en hancing,
i.e.:
1. The mean image brightness f
0
, i.e. the mean value
of the sum of the three color channels. Indicated
by I
r
, I
g
and I
b
the color channels of an image
J, the brightness of J is d efined pixel by pixel
as b(x) =
I
r
(x)+I
g
(x)+I
b
(x)
3
and f
0
is the average o f
b over the number of pixels; f
0
is related to the
global visibility of the image content;
2. The mean, multi-r esolution image contrast f
1
(Rizzi et al., 2004) , i.e. the me an value of the L
1
distance among any value b(x) and its 8 neighbor-
hoods, computed at different scales; f
1
captures
local and global variations of b and is related to
the detail visibility;
3. The index of the distributio n flatness f
2
, which
is the L
1
distance between the probability density
function of b and the uniform probability density
function; f
2
is r elated to the image colorfuln ess.
In case of almost uniform low-light or moderate
backlight/sp otlight, the values of f
0
and f
1
should in-
crease after enhance ment, because the overall image
is brig htened up and its content and details be come
more visible. On the contrary, the value of f
2
should
decrease: in fact, the enhancer restores the visibility
of the content and details in dark areas and allows
their color tones to be better distinguished. Conse-
quently the brightness distribution flattens and f
2
be-
comes smaller. In case of backlight/spotlig ht, the f
i
s
behave differently depending on the regions in which
they are c omputed, i.e., the whole image , brig ht re-
gions, a nd dark regions. On the bright regions, the
f
i
s are expected to remain stable since these regions
do not need enhancem ent, while on the dark regions,
f
0
and f
1
are expected to increase (these regio ns
becomes brighter and more c ontrasted after enhanc-
ing) and f
2
is expected to decrease (the b rightness
histogram, initially peaking to left, flattens with en-
2
https://www.pexels.com/it-it/
3
https://pixabay.com/
A Basic Tool for Improving Bad Illuminated Archaeological Pictures
207
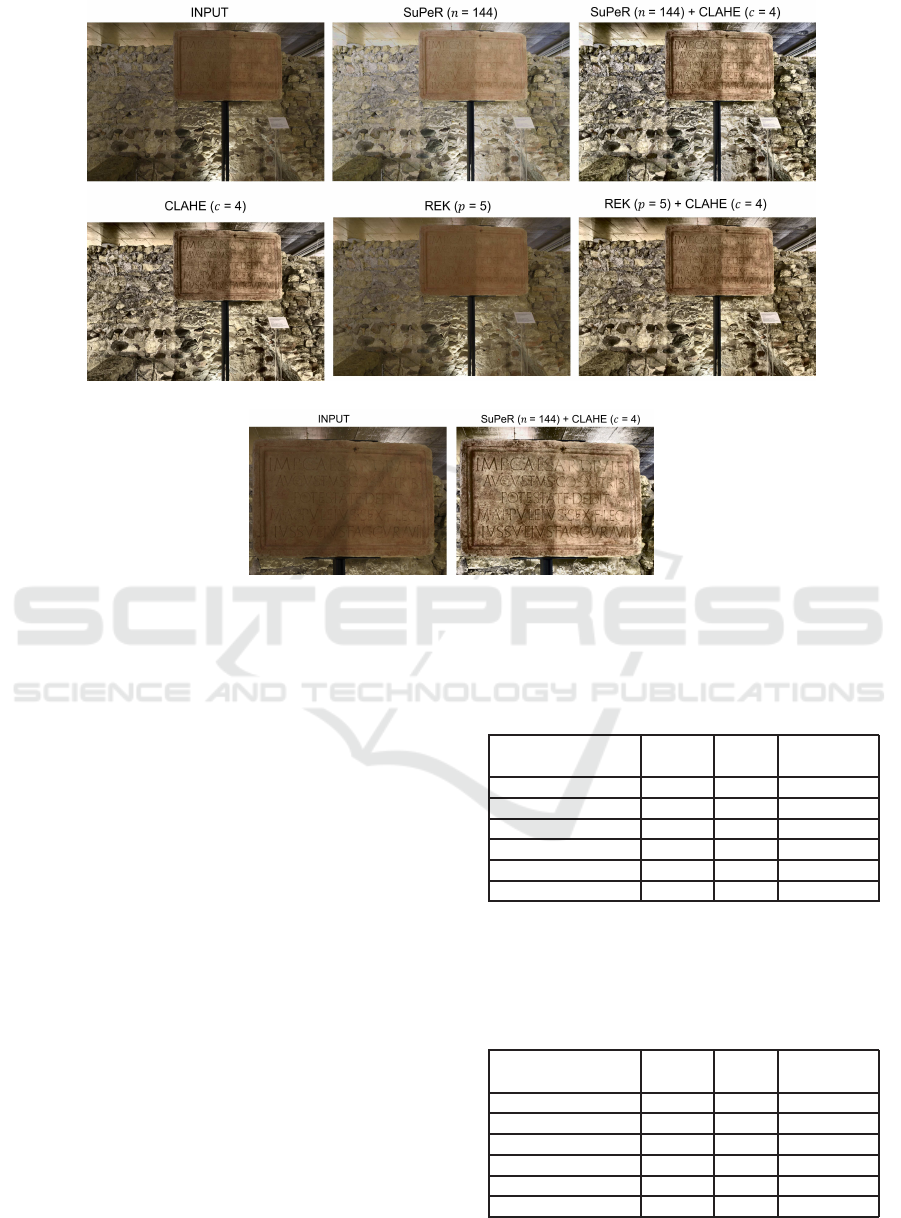
Enlargement of the inscription
Figure 2: Enhancement of an image from Trento-SASS and enlargement of a part (input version and enhancement by Su-
PeR+CLAHE).
hancement). On the whole image, f
0
and f
2
should in-
crease and decrease, respectively, due to the improve-
ment of the dark areas. The behavior o f f
1
is more
complex and d epends on the level of enhan c ement of
dark areas. In fact, an enhancer increases the con-
trast of dark regions, but in this way it decreases the
contrast between dark and bright regions. Depending
on the proportion of dark and bright area s and their
distribution in the image, the f
1
value calculated over
the entire image may increase, r emain stable, or even
decrease, and thus it is irrelevant for enhancer eval-
uation. Ther e fore, on backlight/spotlight images, the
enhancer perform ance are here assessed separately on
dark and bright region s.
Finally, it is to note that the exact amount of the
f
i
s depen ds on the image content. Moreover, for a
fair evaluation, the measures f
0
, f
1
and f
2
must be
evaluated together. In fact, the analysis of a sing le
measure usually does not provide an accurate assess-
ment of the enhancement, since for example a high
value of f
0
could correspond to a total saturation of
the image: in this case, checking the values of f
1
and
f
2
help to better describe and understand the enhancer
performance.
Tables 1, 2, 3 show the values of f
0
, f
1
and f
2
on
the input and on the enhanced images from Trento-
Table 1: Performance of MEEK on Trento-SASS. The ar-
rows indicate the expected t rend of the measures. T he pa-
rameters have been set empirically as follows: n = 144, p =
5, c = 4, while α has been automatically estimated by REK.
Algorithm f
0
f
1
f
2
[×10
−3
]
ր ր ց
INPUT 64.01 12.79 3.94
CLAHE 94.07 26.94 2.19
SuPeR 110.66 16.31 2.92
SuPeR + CLAHE 118.27 31.20 1.45
REK 80.45 12.20 4.14
REK + CLAHE 111.41 29.14 1.76
Table 2: Performance of MEEK on Ravenna-Set. The ar-
rows indicate the expected trend of the measures. Here, p
and c have been set like in Trento-SASS, while n has been
fixed to 100 and α has been computed by REK for all the
images apart from four i mages, for which α has been set to
2.5 because the bright regions were almost white.
Algorithm f
0
f
1
f
2
[×10
−3
]
ր ր ց
INPUT 74.37 14.06 4.14
CLAHE 96.76 27.44 2.30
SuPeR 126.92 17.77 3.31
SuPeR + CLAHE 122.25 31.79 1.63
REK 89.26 13.28 4.33
REK + CLAHE 105.21 27.08 2.36
VISAPP 2023 - 18th International Conference on Computer Vision Theory and Applications
208

Table 3: Performance of MEEK on Backlit-Set broken
down by bright and dark regions. The symbols under the
measures indicate the expected trend of the measures. The
algorithms’ parameters have been set like for Trento-SASS.
(a) Assessment on Bright Regions
Algorithm f
b
0
f
b
1
f
b
2
[×10
−3
]
≃ ≃ ≃
INPUT 181.09 44.02 4.45
CLAHE 199.99 40.67 4.75
SuPeR 202.42 41.68 4.96
SuPeR + CLAHE 213.65 38.04 5.09
REK 181.76 36.30 4.52
REK + CLAHE 203.86 35.81 4.94
REK + SuPeR 203.96 32.67 5.09
REK + SuPeR + 214.74 35.95 5.10
CLAHE
(b) Assessment on Dark Region s
Algorithm f
d
0
f
d
1
f
d
2
[×10
−3
]
ր ր ց
INPUT 32.20 13.16 5.10
CLAHE 66.01 23.57 3.20
SuPeR 50.14 16.84 4.20
SuPeR + CLAHE 87.29 28.09 2.38
REK 61.84 15.35 4.53
REK + CLAHE 96.32 29.90 2.13
REK + SuPeR 87.53 19.22 3.61
REK + SuPeR + 105.11 32.02 1.86
CLAHE
SASS, Ravenna-Set and Backlit-Set (in this last case,
the measures are broken down by dark and bright re-
gions). All these values ar e averaged over the number
of images per d ataset.
From Tables 1 and 2 it comes that for CLAHE, for
SuPeR and for the combinations SuPeR + CLAHE
and REK + CLAHE, the tren d of the measures is
as expecte d: f
0
and f
1
increase, w hile f
2
decreases,
meaning that input images are brightened, their con-
trast is increased, while the luminance histogram is
flattened. On both the datasets Trento-SASS and
Ravenna-Set, REK returns the worst results, because
most of these images have low-light or moderate
backlight/sp otlight and REK is specifically de sig ned
for strong backligh t and spotlight. Therefore, on
Trento -SASS and Ravenna-Set, REK increases f
0
less
than the other me thods do, and slightly decreases ( in-
creases, resp.) f
1
( f
2
, resp.). Much better results
are obtained by REK on Backlit-Set, whose images
present strong backlight. On this dataset, REK ha s
been also combined with SuPeR in order to mitigate
or even remove possible color casts. Tables 3(a) and
3(b) report the objective measures on the sets B and
D of the bright and dark regions. For sake of clarity,
the measures computed on B and D have been indi-
cated respectively by f
b
i
s and f
d
i
s (i = 0,1,2). REK
improves all the values f
d
i
s (i.e. it increases f
d
0
and
f
d
1
, while decreases f
d
2
), while maintains the triplet
( f
b
0
, f
b
1
, f
b
2
) closer to the original one than the other
algorithm s in terms of L
1
distance. Indeed, th e other
algorithm s tend to over-enhance the b right areas: they
generally increase very mu ch their luminance while
worse the flatness distributio n index. Combined with
CLAHE, REK and REK+SuPeR o utput good results,
but the br ight regions are less preserved than when
only REK is used.
Figures 2, 3 a nd 4 illu stra te the behaviour of the
different algorithms on some archeological images
from the three datasets, enabling the user a quick vi-
sualization of the enhancement results.
Figure 2 shows an image of the ancient city Tri-
dentum. The image has a low, yellowish light and the
characters of the in scription depicted in the middle are
poorly readable in part because of the light and in part
because of the time, that smoothed the stone surface.
REK poorly changes the image quality, while SuPeR
returns a brighter image. CLAHE r e inforces the edges
and the characters, but these latter are still not well
readable. The combination of SuPeR and CLAHE re-
turns the best result, where the light color is lowered
and the inscription becomes clearer, as shown in the
enlargement.
Figure 3 shows two images, one captured in the
Mausoleum of Galla Placid ia and the other in the an-
cient city of Trento. Both the images have been ac-
quired under low-light with a moderate backlight. All
the enhancers brighten up the scene very much, but
the best results are obtained by SuPeR and REK com-
bined with CLAHE, which reinforces the improve-
ment of the contrast. Again, differently from CLAHE
and REK, SuPeR enables the removal of th e yellow-
ish chromatic dominant of the ligh t.
Figure 4 shows the enhancement obtained by
CLAHE, SuPeR and REK on a strong backlight im-
age from Backlit-Set. In this case, CLAHE perfo rms
poorly: it remarkably increases the contrast, improv-
ing the de ta il visibility, but the overall content is not
well visible. REK provides here the be st result and
also rema rkably outperfo rms SuPeR. In fact, on this
image, SuPeR divides the intensities of the dark pix-
els by the much greater maximum intensities of the
bright tiles. Despite penalized by the spatial distance
weights, these bright intensities heavily contribute to
the final value of S on the dark regions, th a t remain
still dark. Using a higher value of n may provide bet-
ter results, as well as conside ring alternative w eights
(see for instance (Lecca ., 2021)), but this tuning is
usually hard, especially for non-expert users. In this
context, REK offers a simpler and more c omputa-
tional efficient enhancement method with much better
results.
A Basic Tool for Improving Bad Illuminated Archaeological Pictures
209
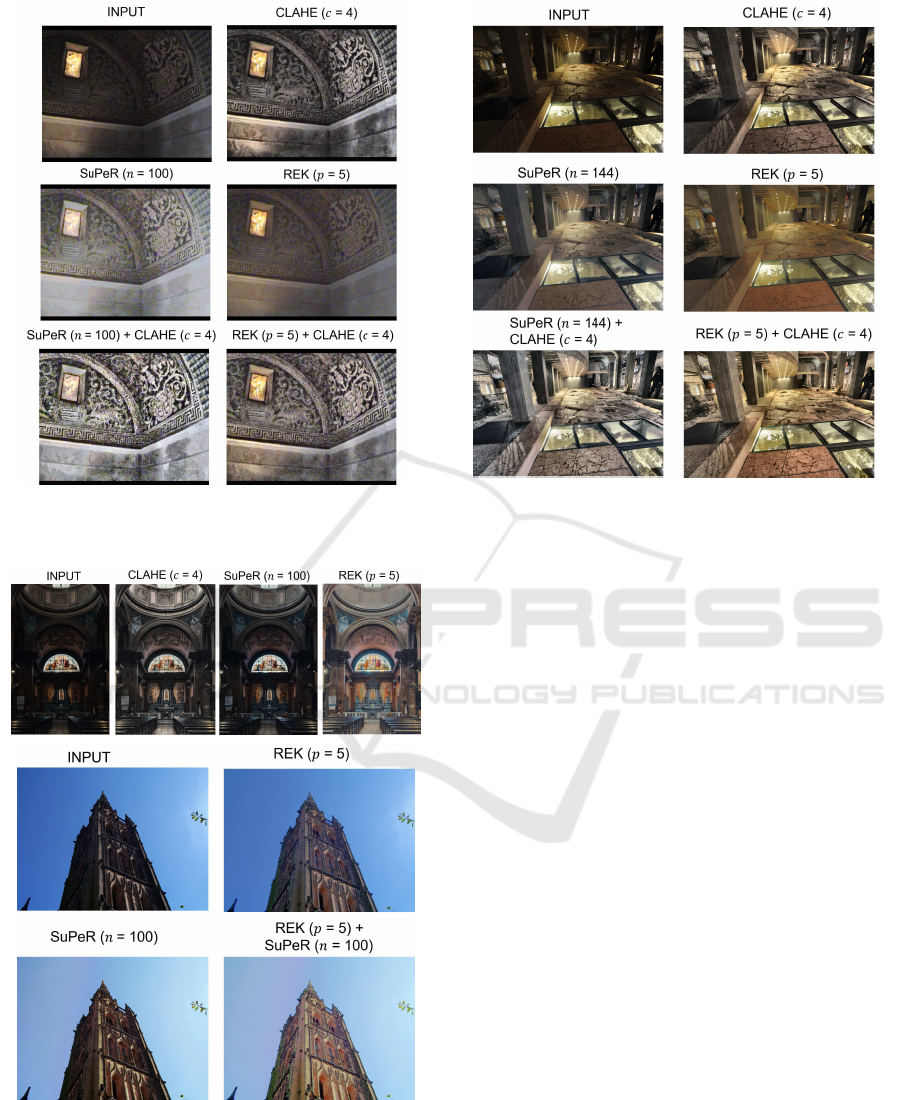
Figure 3: Examples of enhancement by MEEK on images from Ravenna-Set (on left ) and from Trento-SASS (on right).
Figure 4: Examples from Backlit-Set. On top, image en-
hancement by CLAHE, SuPeR and REK; on bottom, image
enhancement by REK, SuPeR and REK+SuPeR.
4 CONCLUSIONS
This work presented MEEK, i.e. a new, basic tool for
the enhanceme nt of im ages captured under uniform
and non- uniform low-lig ht, strong backlight/spotlight
and colored light. Such difficult light conditions
are typical of archeological environments and rep-
resent a bottleneck for collecting high quality v i-
sual documents of these places. The experiments
carried ou t o n archeological ima ges of excavation s,
church e s, ro se wind ows, mosaics, frescoes show that
the three enhancers (SuPeR, REK and CLAHE) in-
cluded in MEEK a nd their c ombinations effectively
improve the quality of su c h images. In particular,
SuPeR is suitable for increasing the content and de-
tails visibility of images with low-light and moder-
ate back light/spotlight. I n addition, it attenuates or
even eliminates possible chromatic dominants of the
light. REK works well on images with strong back-
light/spotlight, improving the visibility of details and
content of the dark areas without over-enhancing the
bright ones. Combining REK and SuPeR improves
dark areas while diminishes possible light color casts.
CLAHE increases the image contrast by modifying its
color distribution. In this way, it improves the v isibil-
ity of the image details. Coupling CLAHE with the
other enhancers generally fur ther increase their per-
formance.
VISAPP 2023 - 18th International Conference on Computer Vision Theory and Applications
210

MEEK is only a first step in building an effective,
easy-to-use, and more comprehensive tool for archae-
ological ima ge enhancement. In fact, MEEK cur-
rently offers a gener ic image enhan cement tool, but
it co uld be complemented by alternative and/or ad-
ditional algorithms adapted to archaeolo gical image
processing. In particular, MEEK c ould be expanded
to include denoising techniques, which are often de-
sired to reduce noise du e to low illumination. In this
context, a collaboration with archaeologists would be
of considerable help both in testing the curre nt ver-
sion of meek as well as in indicating possible modifi-
cations and/or guiding the development of new ad-hoc
techniques for the enhance ment of visual documents.
MEEK c ould also be eq uipped with deep learning
image enhancers, e.g., (Liu et al., 2021), (Lv et al.,
2021), possibly trained on archaeological images. Fu-
ture research will therefore address these topics.
ACKNOWLEDGMENTS
The author would like to thank the Research Unit 3D
Optical Metrology of the Fondazio ne Bruno Kessler
of Trento (IT) and the Soprintendenza per i Beni
Culturali di Trento for providing the images of the
Trento -SASS dataset
REFERENCES
Brutto, M. L. and Meli, P. (2012). Computer vision tools for
3d modelling in archaeology. International Journal of
Heritage in the Digital Era, 1(1
suppl):1–6.
Engel, C., Mangiafico, P., Issavi, J., and Lukas, D. (2019).
Computer vision and image recognition in archaeol-
ogy. In Proceedings of the Conference on Artificial
Intelligence for Data Discovery and Reuse, pages 1–
4, Pittsburgh, Pennsylvania.
Finlayson, G. D. , Drew, M. S., and Funt, B. V. (1994). Color
constancy: generalized diagonal transforms suffice. J.
of Optical Society of America A, 11(11):3011–3019.
Land, E. H., John, and McCann, J. (1971). Lightness and
Retinex theory. Journal of the Optical Society of
America, 1:1–11.
Lecca, M. (2014). On the von Kries Model: esti mation, de-
pendence on light and device, and applications, pages
95–135. Springer Netherlands, Dordrecht.
Lecca., M. (2021). A Retinex inspired bilateral filter for
enhancing images under difficult light conditions. In
Proc. of the 16th Int. Joint Conference on Computer
Vision, I m aging and Computer Graphics Theory and
Applications - Volume 4: VISAPP,, pages 76–86, Vir-
tual Conference. INSTICC, SciTePress.
Lecca, M. (2022a). MEEK Source Code. https://github.
com/MichelaLecca/MEEK .
Lecca, M. (2022b). Relighting backlight and spotlight im-
ages using the von Kries model. In Proc. of the
2nd Int. Conf. on Image Processing and Vision En-
gineering, IMPROVE 2022, Online Streaming, April
22-24, 2022, pages 226–233, Virtual Conference.
SCITEPRESS.
Lecca, M. and Messelodi, S. (2019). SuPeR: Milano
Retinex implementation exploiting a regular image
grid. J. Opt. Soc. Am. A, 36(8):1423–1432.
Liu, R., Ma, L., Zhang, J., Fan, X., and Luo, Z. (2021).
Retinex-inspired unrolling with cooperative prior ar-
chitecture search for low-light image enhancement. In
Proceedings of the IE EE/CVF Conference on Com-
puter Vision and Patt ern Recognition, pages 10561–
10570, Virtual Conference.
Lv, X., Sun, Y., Zhang, J., Jiang, F., and Zhang, S. (2021).
Low-light image enhancement via deep Retinex de-
composition and bilateral learning. Signal Processing:
Image C ommunication, 99:116466.
Monna, F., Rolland, T., Denaire, A., Navarro, N., Granjon,
L., Barb´e, R ., and Chateau-Smith, C. (2021). Deep
learning to detect built cultural heritage from satel-
lite imagery.-spatial distribution and size of vernacu-
lar houses in sumba, indonesia. Journal of Cultural
Heritage, 52:171–183.
Resler, A., Yeshurun, R., Natalio, F., and Giryes, R. (2021).
A deep-learning model for predictive archaeology and
archaeological community detection. Humanities and
Social Sciences Communications, 8(1):1–10.
Rizzi, A., Algeri, T., Medeghini, G., and Marini, D. (2004).
A proposal for contrast measure in digital images. In
Conference on colour in graphics, imaging, and vi-
sion, volume 2004, pages 187–192, Amsterdam, the
Netherlands. Society for Imaging Science and Tech-
nology.
Traviglia, A., Cowley, D., and Lambers, K. (2016). Finding
common ground: Human and computer vision in ar-
chaeological prospection. AARGnews-The newsletter
of the Aerial Archaeology Research Group, 53:11–24.
van der Maaten, L., Boon, P., Lange, G., Paijmans, H.,
and Postma, E. (2006). Computer vision and ma-
chine learning for archaeology. pages 112–130, Fargo,
United States.
Zuiderveld, K. J. (1994). Contrast limited adaptive his-
togram equalization. In Graphics Gems.
A Basic Tool for Improving Bad Illuminated Archaeological Pictures
211
