
Using a Genetic Algorithm to Update Convolutional Neural Networks for
Abnormality Classification in Mammography
Steven Wessels and Dustin van der Haar
a
Academy of Computer Science and Software Engineering, University of Johannesburg,
Kingsway Avenue and University Road, Auckland Park, South Africa
Keywords:
Computational Optimisation, Deep Learning, Computer Vision, Mammography.
Abstract:
The processing of medical imaging studies is a costly and error-prone task. The use of deep learning algorithms
for the automated classification of abnormalities can aid radiologists in interpreting medical images. This
paper presents a genetic algorithm that is used to fine-tune the internal parameters of convolutional neural
networks trained for abnormality classification in mammographic imaging. We used our genetic algorithm to
search for the neural network weights representing the global minimum solution for ResNet50 and Xception
architectures. The Xception architecture outperformed the ResNet baseline for both tasks, with the Xception
baseline model achieving an AUC score of 72%. The genetic algorithm demonstrated a slight proclivity for
improving the general metric evaluations of the network that it fine-tuned, but in some cases, it was still prone
to miss good regions in the search space.
1 INTRODUCTION
The number of medical imaging studies is increasing
disproportionately to the number of professional radi-
ologists required to perform interpretation and diag-
nosis. As a result, the timely analysis of medical im-
ages becomes a bottleneck in the healthcare workflow.
The increasing pressure placed on radiologists and
the error and subjectivity inherent when interpreting
medical images results in many misdiagnoses. To ad-
dress the aforementioned issues, computer-aided de-
tection and diagnosis systems have been proposed to
aid clinicians. However, the early iteration of such
systems, which used manual and task-specific feature
extraction techniques, have yet to match the sensitiv-
ity of professional radiologists consistently and tend
to generate many false-positive classifications. Deep
learning methodologies have resulted in state-of-the-
art performance on common computer vision tasks
and demonstrated efficacy for performing radiologi-
cal imaging analysis.
In this paper, we investigate the optimisation of
deep learning methodologies for performing the task
of abnormality classification in mammographic imag-
ing. We also propose using a genetic algorithm to
fine-tune our solutions without needing external con-
texts, such as the neural network’s gradient informa-
tion or knowledge of internal neuron connectivity. We
a
https://orcid.org/0000-0002-5632-1220
present the experiment and results of a genetic algo-
rithm that used a shared neural network representation
to fine-tune the model trained using gradient descent
and backpropagation. The abnormality classification
task was performed independently using ResNet50
and Xception architectures.
The remainder of this study is structured in the
following manner: Section 2 provides a brief descrip-
tion of the issues within the domain of mammography
and radiology concerning image analysis. In section
3, we discuss similar work that attempts to use convo-
lutional neural networks (CNN) to classify mammo-
gram abnormalities. Section 4 presents the concept
of computation optimisation and outlines the imple-
mentation details of the genetic algorithm used in this
paper. In Section 5, we detail the data used to eval-
uate our model and outline the experimental config-
urations used to generate the results. Experimental
validation results are discussed in section 6.
2 PROBLEM BACKGROUND
Aspects of medicine, such as disease diagnosis and
treatment, have been revolutionised through the use
of X-rays for ionising radiation to produce medical
images (Dauer, 2019). Furthermore, the quality of
healthcare has been greatly improved through diag-
nostic radiology. In oncology, radiology is central
790
Wessels, S. and van der Haar, D.
Using a Genetic Algorithm to Update Convolutional Neural Networks for Abnormality Classification in Mammography.
DOI: 10.5220/0011648500003411
In Proceedings of the 12th International Conference on Pattern Recognition Applications and Methods (ICPRAM 2023), pages 790-797
ISBN: 978-989-758-626-2; ISSN: 2184-4313
Copyright
c
2023 by SCITEPRESS – Science and Technology Publications, Lda. Under CC license (CC BY-NC-ND 4.0)

to the detection, staging, and management of cancer
(Crean et al., 2012). Mammography uses X-ray imag-
ing to examine the human breast for diagnosis and
screening. The aim of examining mammographic im-
ages is to identify characteristic masses or microcal-
cifications that are indicative of breast cancer. Can-
cer screening has been shown to have helped reduce
breast cancer mortality by 30% according to a three-
decade-long study by Swedish doctors (Tab
´
ar et al.,
2011).
Traditionally, mammograms would have to be in-
spected by a radiologist for signs of breast cancer.
Manual inspection is an error-prone, costly, and time
exhausting task. To alleviate the challenges associ-
ated with manual inspection, computer-aided detec-
tion and diagnosis systems that used pattern recog-
nition and learning algorithms for inspection were
designed and deployed (Kooi et al., 2017). By
2008, a reported 74% of all mammography examina-
tions were screened using computer-aided diagnosis
(CAD) (Kim et al., 2018). Following deep learning’s
rise to prominence following the state-of-the-art re-
sults achieved on the ImageNet data set, it was not
long before researchers began investigating the effi-
cacy of CNNs in a wider range of applications, in-
cluding within the field of radiology. We will present
these efforts in section 3. What will be apparent is
that there are still many challenges preventing a work-
able and reliable solution from being found. The
gradient-based methods ubiquitous for training neu-
ral networks have issues overcoming local minima
and often converge slowly. Meta-heuristic algorithms,
such as the evolutionary algorithm, are inspired by
naturally occurring phenomena and are often efficient
solutions to finding global optima in complex search
spaces (Noel, 2012).
3 SIMILAR WORK
In 2019, Tsochatzidis et al. performed a comparative
study of major CNN architectures regarding the clas-
sification of abnormalities found in the CBIS-DDSM,
comparing the end-to-end performance of various
deep learning architectures (Tsochatzidis et al., 2019).
Their research aimed to compare the use of pretrained
weights to the random initialisation of network pa-
rameters. The architectures compared were:
1. Alexnet: A relatively shallow network with five
convolutional layers and three fully connected
layers, regularised with dropout = 0.5.
2. VggNets: Both 16 and 19-layer variations were
part of the comparative study.
3. ResNets: The variations 50, 101, and 152 were
compared here.
4. GoogLeNet: The state-of-the-art V3 network was
used.
In addition to using the CBIS-DDSM, the DDSM-
400, another subset of the DDSM, was used for
comparisons on abnormality classification. From
the CBIS-DDSM, only cases containing masses were
used. The images were preprocessed by cropping
a window of 1024×1024 pixels centred around the
mass for all lesions on the basis that this would avoid
resize-induced distortion while including necessary
adjacent tissue for learning features in larger scales.
All input image sizes were set to 224×224 pixels.
Additionally, data augmentation was used to create
supplementary artificial samples of the data set by ap-
plying rotational and reflectional transformations to
existing images. The authors argue that performing
augmentation with the aforementioned transforma-
tions generates meaningful examples whereby rota-
tion invariance for the learned features is implied. The
from-scratch experiments used Glorot/Xavier initiali-
sation, while the pre-trained networks had their con-
volutional layers initialised with Imagenet weights,
and their final layers were randomly initialised. The
Adam optimiser was used to train all networks. For
every architecture they compared, the pre-trained
achieved a higher area under the curve (AUC) and ac-
curacy scores in fewer epochs than their end-to-end
counterparts, proving the efficacy of using pre-trained
networks over training models end-to-end. The pre-
trained ResNets achieve the best metric results, with
ResNet50 outperforming their deeper counterparts
with an AUC of 80.4%. Interestingly, the ResNets
outperformed when trained from scratch compared to
the VggNets and AlexNet. The authors suggested that
the complexity and depth of ResNets are the cause of
this discussion point.
Recently, Almeida et al. also performed a com-
parative study on the CBIS-DDSM for abnormality
classification (Almeida et al., 2021). They compared
XGBoost, a gradient-boosted trees algorithm, to VG-
GNet16 using three different data set configurations,
including a full data set configuration relevant to our
study. The authors also used data augmentation to
supplement the data set by applying random horizon-
tal reflections, rotation about the origin, shear trans-
formation, vertical and horizontal shifts, and cropping
in. An image input size of 224×224 pixels was used.
Similar to Tsochatzidis et al., the authors of (Almeida
et al., 2021) compared a network with pre-trained Im-
agenet weights to a from-scratch variant. Their best-
performing VGGNet model was the pre-trained vari-
ant which achieved an AUC of 68.22%.
Using a Genetic Algorithm to Update Convolutional Neural Networks for Abnormality Classification in Mammography
791

With regards to literature specifically pertaining
to training CNNs using meta-heuristic algorithms,
Pawełczyk et al. used a genetic algorithm in combina-
tion with the backpropagation algorithm to update the
weights of a LeNet-4 CNN architecture (Pawełczyk
et al., 2018). Their population was comprised of in-
dividuals representing the weights that encoded the
CNN, with the initial weight values being drawn from
a uniform distribution. The fitness of solutions was
calculated using classification error. A combination
of elitist and random selection was used to draw a
new population for recombination. The crossover was
performed at a single point per layer. They validated
their model against the MNIST data set and found
that their GA-Backpropagation method outperformed
the classical gradient-based back-propagation optimi-
sation method.
4 METHODS
4.1 Computational Intelligence for
Optimization Problems
Computational intelligence is a sub-field of artificial
intelligence that enables intelligent behaviour within
complex search spaces. Meta-heuristic algorithms
are versatile and adaptable problem-solving programs
utilised on computational optimisation problems for
which no efficient problem-specific algorithm ex-
ists. In this section, we present a population-based
stochastic search paradigm from the field of compu-
tational intelligence that can be used for optimisation
tasks.
Evolutionary computing uses models based on
biological evolution to solve optimisation processes
(Engelbrecht, 2008). The overarching idea of evolu-
tionary computing is that the simulated evolutionary
process improves solutions generated by an evolution-
ary computation system through exposure to dynamic
and competitive environments. Genetic algorithms
were the earliest and most fundamental method of
simulation evolution with computing systems. John
Holland is considered the chief proponent of genetic
algorithms in optimisation due to his extensive work
in the field and his proposition of the canonical ge-
netic algorithm (Holland, 2010). A generic genetic
algorithm will follow the following iterative process:
1) Evaluation of each individual’s fitness 3) Repro-
ducing to produce offspring 4) Selection of the next
generation.
The fundamental constituent variables of evolu-
tionary algorithms are chromosomes, where the data
encoded into the chromosome defines the representa-
tion of a solution. These characteristics, also known
as genes, hold data values relevant to forming a solu-
tion. A population of chromosomes compete to repro-
duce offspring based on the strength of an individual’s
solution. A fitness function is used to measure a so-
lution’s objective value based on the constraints of a
given problem. The crossover process is where parts
of two reproducing solutions are used to form new
solutions. A small number of genes in the new so-
lution can be randomly changed or mutated, creating
evolution within the population of solutions. Only the
fittest chromosomes are likely to be moved to the next
generation between the newly generated solutions and
the existing population.
Selection algorithms are a mechanism used to de-
termine which individuals in a population get to re-
produce based on their fitness. Selection is the driv-
ing force behind achieving a better solution (Engel-
brecht, 2008). Random selection is the simplest of all
selection algorithms. Each individual has the same
probability of being chosen to continue to the next
generation, regardless of their fitness. Theoretically,
randomly selecting members from the population to
continue and reproduce should result in the longest
takeover time, i.e. the time taken to achieve con-
vergence. Random selection will be the baseline for
the comparison. Roulette selection gives an individ-
ual a chance of being selected that is directly propor-
tional to their fitness value relative to other individu-
als in the population. This selection mechanism may
limit the diversity of solutions. Rank selection orders
the population concerning their fitness values. The
highest-ranking member is the fittest individual, and
the lowest-ranked member is the worst of the gener-
ation. The advantage of rank selection over roulette
selection is that the best-performing individuals don’t
skew the selection process by such a large degree.
Tournament selection randomly chooses a subset of
the population to compete against one another, with
the best-performing individual chosen to continue to
the next generation. The size of the tournament set
ought to be carefully chosen. A large tournament set
size results in the fittest individuals dominating, while
a small size increases the number of unfit individuals
in the next generation (Miller and Goldberg, 1995).
Elitism is used to ensure the survival of the best indi-
vidual of a population and is not necessarily a means
of selecting all the individuals who will go on to the
next generation, as with other selection schemes.
Using meta-heuristic algorithms to search for pa-
rameters to minimise a network’s loss function can
be comparable to evolving a linked set of connected
weights. One of the main benefits meta-heuristics
provide over gradient descent methods is that they
ICPRAM 2023 - 12th International Conference on Pattern Recognition Applications and Methods
792

require no context information about the space they
search, apart from the objective function (Whitley
et al., 1990). Critically, no gradient information is
required. In the case of genetic algorithms, selective
reproduction and recombination of encoded solutions
change the sampling rate of hyperplanes in the search
space to indicate the average fitness of solutions that
belong in any particular hyperplane. This sampling
rate change removes the need to search along the con-
tours of the objective function, which in turn miti-
gates the likelihood of the search becoming stuck in
local minima. A challenge the GA will face is opti-
mising large numbers of weights present in convolu-
tional neural networks since neither search technique
is known to scale well (Whitley et al., 1990) (Old-
ewage, 2017). A general cause of scale issues for
meta-heuristics is the sheer number of existing so-
lutions, which increases the difficulty of ascertaining
whether or not certain regions in the search space rep-
resent “good” regions.
The gradient-based methods ubiquitous for train-
ing neural networks have issues overcoming local
minima and often converge slowly. Meta-heuristic
algorithms, such as the genetic algorithm (GA), are
inspired by naturally occurring phenomena and are
often efficient solutions to finding global optima in
complex search spaces (Noel, 2012). We will there-
fore investigate the use of meta-heuristic algorithms
to refine the parameter optimisation with a predispo-
sition for lowering false positive rates.
We use a genetic algorithm for parameter learn-
ing to compare meta-heuristic methods. The individ-
uals of a population are represented by a vector of
length N, where N is the number of layers of train-
able weights in the CNN. Within each element of
this vector is another vector containing the layer’s
weights. Representing the solution using the same
logical structure as the CNN’s weights vector is the
most programmatically simple method of encoding
our chromosomes. This representation scheme allows
us to maintain operational context by preventing mod-
ification to the logical structure of a network’s inter-
nal parameters. We also preserve the spatial relation-
ship caused by CNN’s translation invariance property.
However, our solution encoding imposed serious con-
straints on the model’s training. The size of the popu-
lation used for the algorithm and the number of gener-
ations that the algorithm can run for will be minimal
because of the extra memory requirements of having
to keep “copies” of the weight vectors during training
and the computational requirements to calculate the
loss for each solution.
To initialise the population, we first create a par-
ticle using the current weights of the model and then
Algorithm 1: Genetic algorithm to update network parame-
ters.
Require: Generations n
Require: Crossover threshold C
t
Require: Population size P
Require: Tournament size T
Require: Culling size K
Require: Fitness function f
Require: The trainable parameters θ
Initialize solution population
while n ≤ n
max
do
Evaluate fitness of all solutions f (θ)
while Next generation population size ¡ Current
population size do
Remove K weakest individuals from popula-
tion
Perform tournament selection to select θ
1
and
θ
2
where f (θ
1
) < θ
2
if Chance of reproduction> C then
Perform 2-point crossover with θ
1
and θ
2
to
create new solution θ
′
Add θ
′
to next generation
else
Mutate θ
1
and add to next generation
end if
Advance to the next generation, n = n + 1
end while
end while
generate the remaining particles by multiplying each
weight by a randomly sampled float in the range
(0, 1). We then find the fittest solution in the popu-
lation using the objective function before starting the
first iteration. The objective function used will de-
pend on the machine learning task being performed.
For classification tasks, the objective function used to
evaluate the validity of a solution when provided with
predicted values
ˆ
y and corresponding ground truth la-
bels y is the following:
f (
´
y, y) = 2 × loss(
´
y, y)+ FPR(
´
y, y)
+(1 − T NR(
´
y, y)) +(1 − ACC(
´
y, y))
(1)
where FPR is the function that calculates the false
positive rate and T NR calculates the specificity. The
loss function used was binary cross entropy. Using
this objective function, we can explicitly predispose
the algorithm to minimise false positive cases by con-
sidering the false positive rate and the inverse true
negative rate to address a common shortcoming of
CAD systems.
Following the initial population creation and fit-
ness calculation, the next generation of solutions must
Using a Genetic Algorithm to Update Convolutional Neural Networks for Abnormality Classification in Mammography
793

be selected. We use an elitist scheme to ensure that
the best individuals of a previous generation survive
to the next generation. Elitism is a highly exploitative
technique that can cause the algorithm to favour a lo-
cal minimum instead of exploring the search space.
However, since the GA is being used to refine the
search initiated by a gradient descent algorithm, we
feel that the exploitation of a search space is appropri-
ate. Our elitist scheme guaranteed that the top three
fittest individuals would continue to the next gener-
ation. We then use tournament selection to choose
the individuals to perform crossover to produce the
remaining members of the next generation. Tour-
nament selection randomly chooses a subset of the
population to compete against one another. The two
best-performing individuals are selected to perform
crossover to produce a new individual for the next
generation. The size of the tournament subset ought
to be carefully chosen, as a large tournament subset
size results in the fittest individuals dominating, while
a small size increases the number of unfit individu-
als in the next generation (Engelbrecht, 2008). The
tournament selection algorithm used in the model pre-
sented used 12% of the population for a tournament
set size, a size we found through experimentation to
be beneficial to minimise the performance overhead
and balance the passing of strong genetic material
while still allowing for exploration. Once tournament
selection determines the two best individuals from the
tournament subset, a random number between 0 and
100 is produced to determine if a crossover will occur
with the selected individuals to produce a new solu-
tion. If the crossover threshold is met, an elementwise
crossover algorithm generates a new solution with the
genetic material chosen by a coin toss. The mutation
is also applied elementwise with a 0.5% chance of an
element being mutated by multiplication of a range of
(−1, 1). If the crossover threshold is not met, then
the winner of the tournament selection is added to the
next generation. After the GA has run for ten gen-
erations, the best individual weights are fitted to the
CNN model for evaluation.
4.2 Convolutional Neural Networks
We used two convolutional neural network architec-
tures to evaluate the genetic algorithm’s parameter
fine-tuning ability. It is the smallest variant of the
ResNet family of networks and gives us the fewest
number of parameters to train. Despite having low
network depth relative to other ResNets, ResNet50
attained very high-performance metrics on the Ima-
geNet data set, with a top-1 accuracy of 0.749 and a
top-5 accuracy of 0.921 (Keras, 2017). We would also
investigate the classification performance of Xcep-
tion, a modern network with fewer weights than
ResNet50 and slightly better scores on ImageNet,
with top-1 accuracy of 0.790 and top-5 accuracy of
0.945.
4.3 ResNet50
The name ResNet50 is derived from the fact that the
network is comprised of fifty weighted layers and four
residual blocks. The total number of trainable param-
eters contained in ResNet50 is 24577026. The input
is fed into a convolutional layer where a kernel of size
(7 × 7) is applied with a stride of (2, 2). The weights
of the convolutional layer were once again initialised
using He initialisation. An l2 kernel level regulariser
with a penalty factor of 1e − 5 is used to regularise
each trainable layer. The outputs of the convolu-
tional layer are normalised using batch normalisation
before having a ReLU activation function applied.
Unless specified, all subsequent convolutional layers
follow the CONV ⇒ BATCH NORM ⇒ RELU se-
quence with the same initialiser and regulariser, al-
though the kernel sizes and strides change per the
depth of the layer. The first layer of convolution is
followed by a (3 × 3) max pooling layer with a (2, 2)
stride. The (3 × 3) max pooling layer will be the only
max pooling layer used throughout the network. The
next part of the network consists of stacks of residual
layers. All residual modules in ResNet50 use bot-
tlenecking. Three residual modules form the layer
named conv2 x by He et al. (He et al., 2015), and
are used to learn 256 kernel filter weights. The first
two convolution blocks each learn 64 filters, and the
bottlenecked convolutional block learns 256 filter val-
ues. The layers conv3 x, conv4 x, conv5 x follow a
similar pattern, although with differing numbers of
residual block repetitions and a differing number of
learnable filter values. Finally, average pooling with
a pool size (7 × 7) is used before a dense network of
512 units is trained with a 25% probability of dropout
being applied before the final predicted output is gen-
erated using a softmax layer. A full description of
ResNet50’s architecture can be found in (He et al.,
2015).
4.4 Xception
The Xception network comprises 36 convolutional
layers that form the feature extraction section of the
network. Xception contains 22885952 trainable pa-
rameters. These convolutional layers are structured
into 14 modules, with all modules being connected
with a linear residual connection around them, apart
ICPRAM 2023 - 12th International Conference on Pattern Recognition Applications and Methods
794
from the first and last modules. We used a dense
fully-connected layer of 512 units, each having a 25%
chance of being dropped out during training for a clas-
sification base. The final layer used softmax activa-
tion to generate output. Once again, an l2 kernel level
regulariser with a penalty factor of 1e − 5 was ap-
plied to convolutional layers. A full description of the
Xception architecture can be found in (Chollet, 2017).
5 EXPERIMENTAL VALIDATION
5.1 Experimental Data
The largest current example of a mammographic
imaging data sets is the Digital Database for Screen-
ing Mammography (DDSM). The DDSM was col-
lected in the early 90s and had an image quality far
lower than its modern counterparts. Additionally, the
data set contains very imbalanced data regarding the
number of normal cases to cases containing abnor-
malities (Heath et al., 1998). Recently researchers
commonly use an updated and standardised version
of the DDSM, namely the Curated Breast Imaging
Subset of DDSM (CBIS-DDSM), for mammographic
analysis when using a public data set is required. We
decided to use the CBIS-DDSM as this study’s data
set to directly and accurately compare our results and
existing research. We would use the CBIS-DDSM for
abnormality classification.
In an effort to address the challenges of using the
DDSM, Lee et al. proposed further standardisation
to the existing data set (Lee et al., 2017). A sub-
set of the DDSM containing the cancerous and be-
nign studies was updated to remove chain codes and
artefacts from the images. Precise ROI segmentation
masks were made by a trained radiologist and stored
as part of the data set in binary masks of the exact di-
mensions as its associated study image. The images
have also been decompressed and converted from a
lossless JPEG format to DICOM format and are read-
ily available through a web service or an easy-to-use
desktop application provided by The Cancer Imaging
Archive (TCIA). The data set consists of images of
both mass and calcification cases, totalling 3568 im-
ages in both bilateral craniocaudal (CC) and medio-
lateral oblique (MLO) views. The original DDSM
data set was collated from four medical institutions,
with each institution using different digitiser technol-
ogy (Heath et al., 1998). Each digitiser scanned im-
ages at differing sampling rates and grey levels, re-
sulting in inconsistent opacity levels across the data
set. As such, the curators of the CBIS-DDSM chose
to clip opacity values and remap the grey levels to 16-
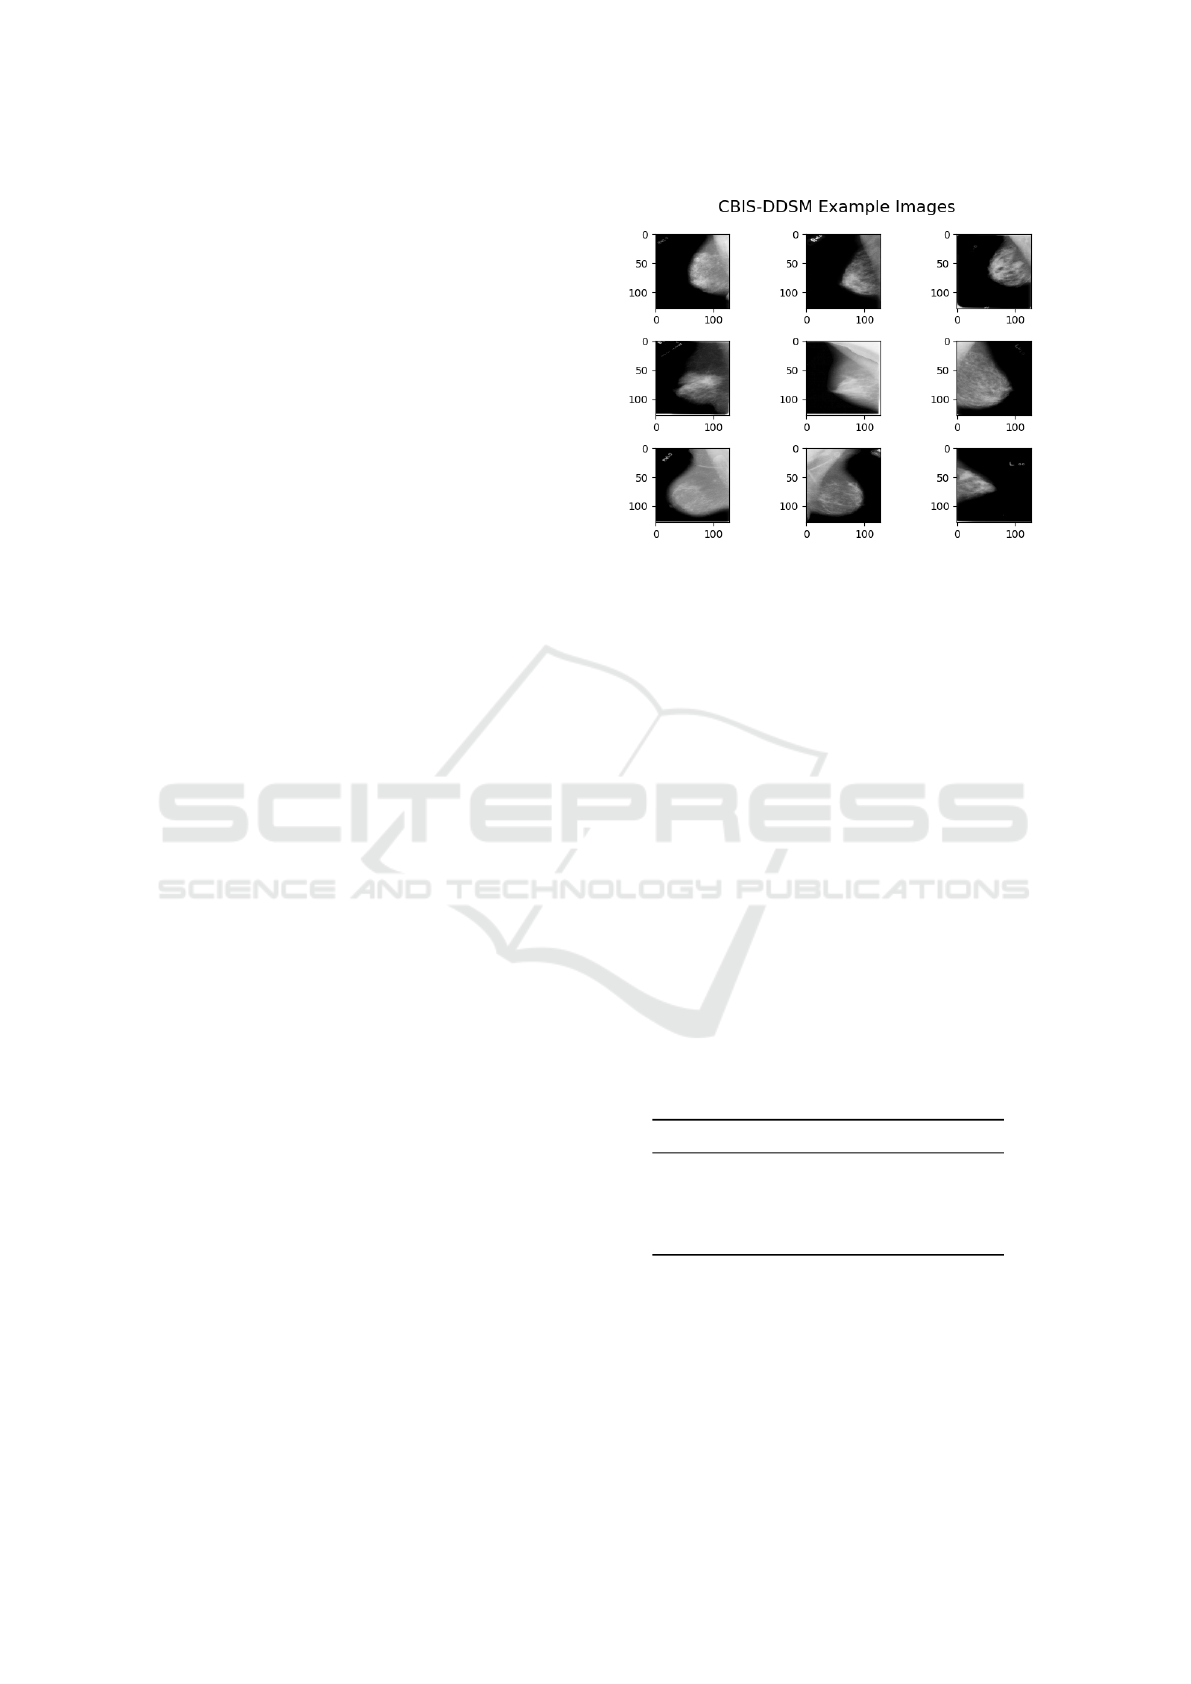
Figure 1: Examples of images found within the CBIS-
DDSM data set.
bit grayscale between decompression and conversion
to DICOM. The binary class breakdown of the CBIS-
DDSM is Positive cases - 1457 (40.84%), Negative
cases - 2111 (59.16%).
5.2 Configuration Permutations
The collection of results was accomplished by run-
ning four unique configurations of models. The vari-
ous permutations of the experiments we conducted to
assess the efficacy of deep learning for medical ab-
normality classification can be seen in table 1. The
experiment Ids are formed using a key explained in
the caption of table 1. We used the test-train split
stipulated by the authors of (Sawyer-Lee et al., 2016)
in the accompanying metadata files from TCIA. The
ResNet50 and Xception models and their optimised
variants were compared on the abnormality classifi-
cation.
Table 1: Experimental configurations permutations for the
baseline and their respective GA counterparts.
Id Architecture Metaheuristic
CRD ResNet50 -
CRD-GA ResNet50 GA
CXD Xception -
CXD-GA Xception GA
5.3 Results
In this study’s context, abnormality classification is
the process of delineating whether or not a given
mammogram image containing an abnormality is ma-
lignant or benign. We will use the full-size mammo-
gram images from the CBIS-DDSM data set for this
Using a Genetic Algorithm to Update Convolutional Neural Networks for Abnormality Classification in Mammography
795
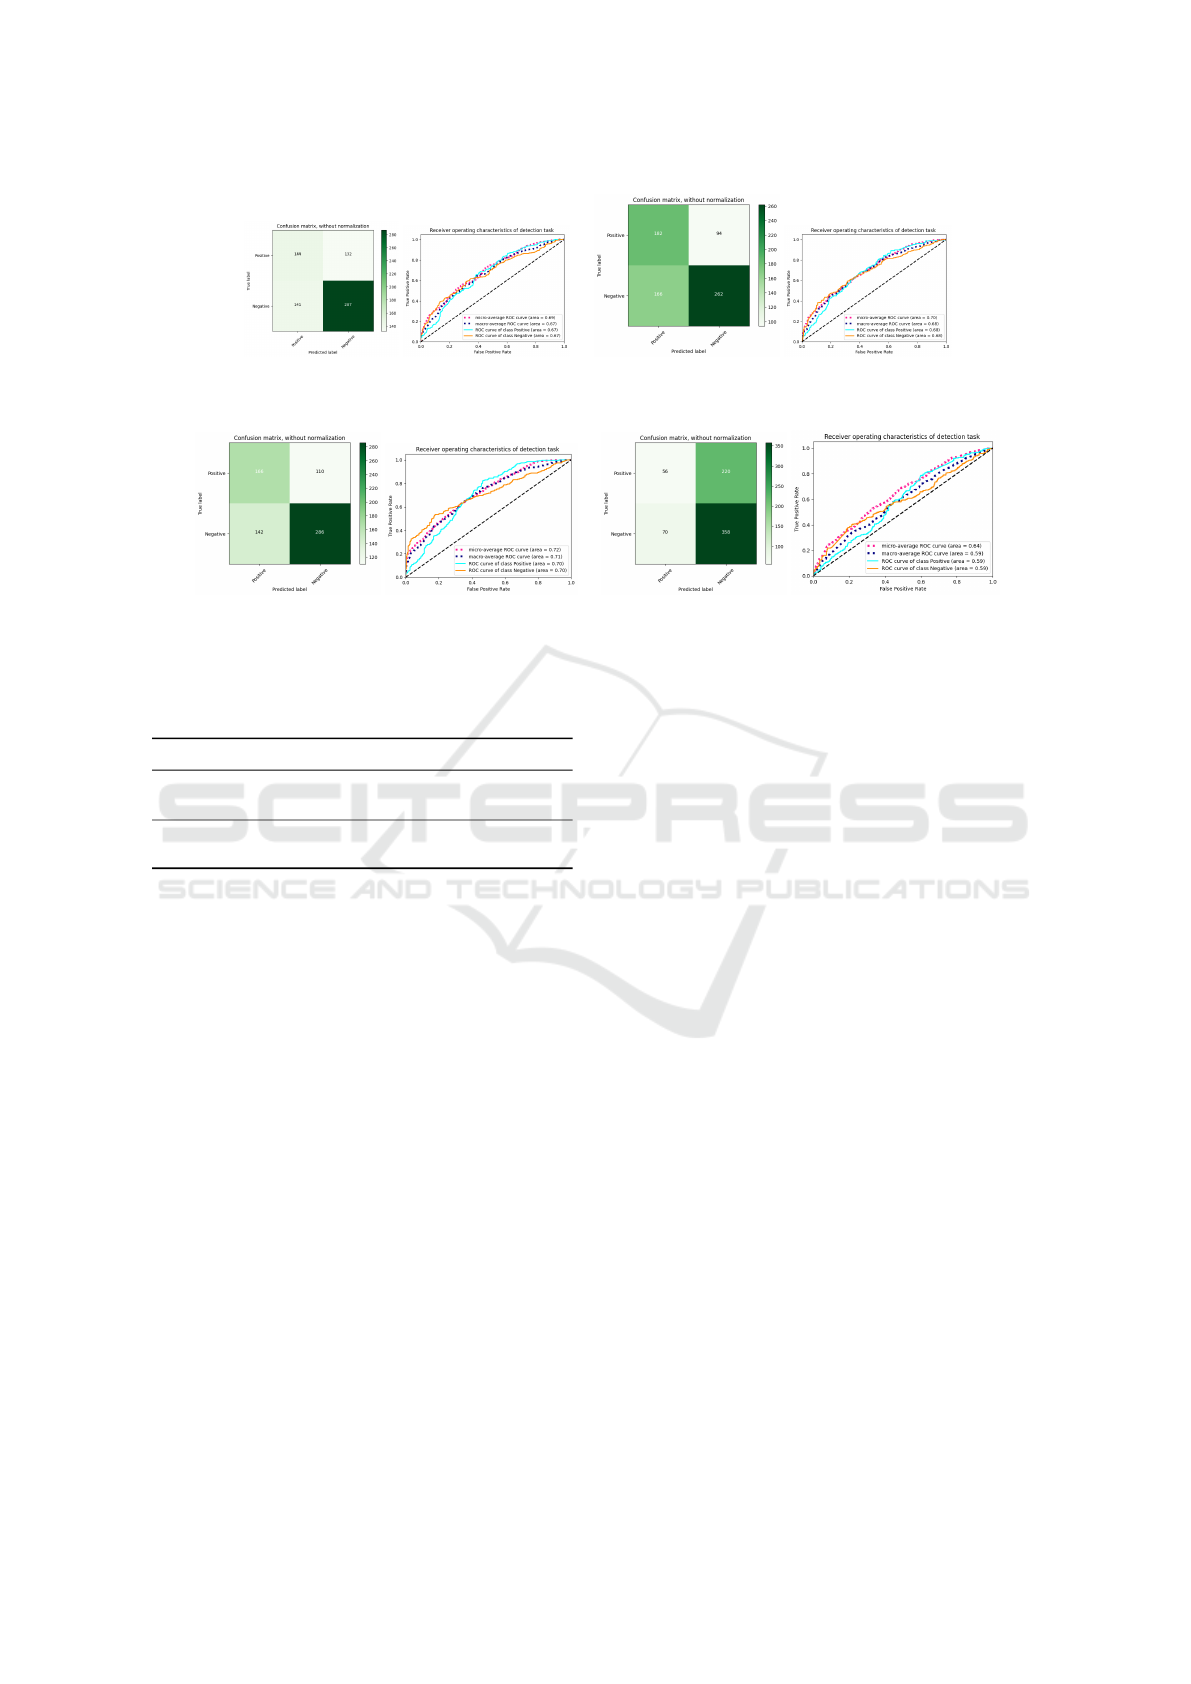
(a) CRD (b) CRD-GA
Figure 2: Comparison of the metrics generated for the abnormality classification task with ResNet50.
(a) CXD (b) CXD-GA
Figure 3: Comparison of the metrics generated for the abnormality classification task with Xception.
Table 2: Results for the binary classification of abnormali-
ties.
Id Loss Accuracy Precision Recall
CRD 0.6364 63.49 61.91 62.06
CRD-GA 0.6510 63.92 63.92 63.92
CXD 0.5882 64.20 63.06 63.48
CXD-GA 0.6928 60.79 60.79 60.79
task, given that it is a curated subset of the DDSM
containing only suspicious cases. For metrics gener-
ated from training on CBIS-DDSM, a positive case
denotes an image containing at least one malignant
mass or calcification.
Table 2 shows the results of the control experi-
ments for the binary classification task, where an im-
age from a medical study is presented to a model
which assigns a true/false label to the image on
whether the image contains a malignant or benign ab-
normality. The metric plots generated using the con-
trol networks can be seen in figures 2 and 3.
Interestingly enough, the genetic algorithm im-
proved the number of true positives identified for
ResNet50 when comparing CRD-GA to CRD-I, al-
though the loss score did deteriorate, as can be seen in
table 2. Additionally, the fine-tuned ResNet50 models
did minimise the false positives found while increas-
ing the number of true positives but altered the false
negative rate to do so, likely due to the biases inher-
ent in the objective function, stipulated by equation 1.
The fine-tuning led to improved precision but a weak-
ened recall.
6 DISCUSSION
In section 3, we reviewed literature that had applied
deep learning methodologies to abnormality classifi-
cation in mammography. As a reminder, the salient
experimental setup details for the works previously
discussed are:
1. Tsochatzidis et al. compared an array of net-
works, including a pre-trained ResNet50, at
abnormality classification (Tsochatzidis et al.,
2019). Only images containing masses were used.
The input images were cropped windows centred
around the ROI and were resized to 224 × 224.
Data augmentation was applied to the data set.
2. Almeida et al. used a VGGNet16 to perform ab-
normality classification on the CBIS-DDSM. Im-
ages were resized to 224× 224, and data augmen-
tation was used (Almeida et al., 2021).
An unfortunate restriction placed on our research
was the availability of sufficient hardware resources,
leading us to run our experiments with an input size of
128 × 128, far lower than the usual 224 - 256 squared
pixel inputs seen in the similar work. This con-
straint increases the challenge of each task, consid-
ering that the abnormalities present in full-size mam-
mogram images in the CBIS-DDSM take up a very
small area of pixels (Sun et al., 2018). Tsochatzidis et
al. cropped into an area centred around the annotated
ROIs of mass cases. We feel this is unrepresentative
of the real-world tasks of a radiologist. In the case of
the classification tasks that used this strategy, we felt
this would give the network an unfair advantage as it
ICPRAM 2023 - 12th International Conference on Pattern Recognition Applications and Methods
796

would quickly learn that the abnormality was centre
aligned. Moreover, all the similar works only con-
sidered the mass cases of their selected data set when
performing their respective tasks. A contribution that
this study makes is providing results of various mod-
els that consider both calcifications and masses.
The accuracy scores of the control experiments
commonly landed in the region of 60%-65%, accom-
panied by usually poor precision and recall scores.
There is a cyclical relationship between the imbal-
anced data set towards the number of negative sam-
ples and the neural networks favouring negative pre-
dictions, as seen in the accompanying confusion ma-
trices. A bias toward predicting negative cases gener-
ates a large number of false negatives, which in turn
decreases the recall/sensitivity of a model.
7 CONCLUSION
This study was undertaken to determine if a genetic
algorithm could update a convolutional neural net-
work’s internal parameters within the context of ab-
normality classification in mammographic imaging.
We tested the genetic algorithm on ResNet50 and
Xception architectures. While minor improvements
were made concerning the true positive rate of the
fine-tuned ResNet model, the Xception model’s met-
ric performance substantially degraded. It is difficult
to conclude the effectiveness of using the genetic al-
gorithm presented here for optimising convolutional
neural networks. Future work on this topic may con-
sider investigating the effects of evolutionary optimi-
sation on other CNN architectures.
REFERENCES
Almeida, R., Chen, D., Filho, A., and Brand
˜
ao, W. (2021).
Machine learning algorithms for breast cancer detec-
tion in mammography images: A comparative study.
Proceedings of the 23rd International Conference on
Enterprise Information Systems.
Chollet, F. (2017). Xception: Deep learning with depthwise
separable convolutions.
Crean, M., Rouger, M., and Zizka, D. (2012). Making can-
cer visible: The role of imaging in oncology.
Dauer, L. (2019). Dose, benefit, and risk in medical imag-
ing. Imaging in medical diagnosis and therapy. CRC
Press.
Engelbrecht, A. P. (2008). Computational intelligence: an
introduction. CRC Press.
He, K., Zhang, X., Ren, S., and Sun, J. (2015). Deep Resid-
ual Learning for Image Recognition. arXiv e-prints,
page arXiv:1512.03385.
Heath, M., Bowyer, K., Kopans, D., Kegelmeyer, P., Moore,
R., Chang, K., and Munishkumaran, S. (1998). Cur-
rent status of the digital database for screening mam-
mography. Computational Imaging and Vision Digital
Mammography, page 457–460.
Holland, J. H. (2010). Adaptation in natural and artificial
systems: an introductory analysis with applications
to biology, control, and artificial intelligence. MIT
Press.
Keras (2017). Keras documentation: Resnet and resnetv2.
Kim, E.-K., Kim, H.-E., Han, K., Kang, B. J., Sohn, Y.-
M., Woo, O. H., and Lee, C. W. (2018). Applying
data-driven imaging biomarker in mammography for
breast cancer screening: Preliminary study. Scientific
Reports, 8(1).
Kooi, T., Litjens, G., Ginneken, B. V., Gubern-M
´
erida, A.,
S
´
anchez, C. I., Mann, R., Heeten, A. D., and Karsse-
meijer, N. (2017). Large scale deep learning for com-
puter aided detection of mammographic lesions. Med-
ical Image Analysis, 35:303–312.
Lee, J.-G., Jun, S., Cho, Y.-W., Lee, H., Kim, G. B., Seo,
J. B., and Kim, N. (2017). Deep learning in medical
imaging: General overview. Korean Journal of Radi-
ology, 18(4):570.
Miller, B. and Goldberg, D. (1995). Genetic algorithms,
tournament selection, and the effects of noise. Com-
plex Systems, 9:193–212.
Noel, M. M. (2012). A new gradient based particle
swarm optimization algorithm for accurate computa-
tion of global minimum. Applied Soft Computing,
12(1):353–359.
Oldewage, E. T. (2017). The perils of particle swarm op-
timization in high dimensional problem spaces. Uni-
versity of Pretoria.
Pawełczyk, K., Kawulok, M., and Nalepa, J. (2018).
Genetically-trained deep neural networks. Proceed-
ings of the Genetic and Evolutionary Computation
Conference Companion, page 63–64.
Sawyer-Lee, R., Gimenez, F., Hoogi, A., and Rubin, D.
(2016). Curated breast imaging subset of ddsm.
Sun, H., Li, C., Liu, B., and Wang, S. (2018). Aunet: Breast
mass segmentation of whole mammograms. CoRR,
abs/1810.10151.
Tab
´
ar, L., Vitak, B., Chen, T. H.-H., Yen, A. M.-F., Co-
hen, A., Tot, T., Chiu, S. Y.-H., Chen, S. L.-S., Fann,
J. C.-Y., Rosell, J., and et al. (2011). Swedish two-
county trial: Impact of mammographic screening on
breast cancer mortality during 3 decades. Radiology,
260(3):658–663.
Tsochatzidis, L., Costaridou, L., and Pratikakis, I. (2019).
Deep learning for breast cancer diagnosis from mam-
mograms—a comparative study. Journal of Imaging,
5:37–48.
Whitley, D., Starkweather, T., and Bogart, C. (1990). Ge-
netic algorithms and neural networks: Optimizing
connections and connectivity. Parallel Computing,
14(3):347–361.
Using a Genetic Algorithm to Update Convolutional Neural Networks for Abnormality Classification in Mammography
797
