
Generation of Daily and Monthly Flows Using the GR4j Method with
ERA5 Grilled Data in the Cañete River Basin to the Putinza
Hydrometric Station
Edgar Manuel Infante Quispe
1a
, Gianfranco Massimo Gutiérrez Buitrón
2b
,
Abel Carmona Arteaga
2c
and Rubén Kevin Manturano Chipana
2d
1
Universidad Privada del Norte, Sede Cajamarca, Cajamarca, Peru
2
Universidad Privada del Norte, Sede Breña, Lima, Peru
Keywords: Cañete Basin, Putinza, GR4j Hydrological Model, Google Earth Engine.
Abstract: The research is carried out in a sub-basin of the Cañete River, delimited from the Putinza hydrometric station,
with the aim of being able to generate the flows at a daily and monthly rate during a period of 39 years (1980
- 2019) and determine the approximate values of maximum flows in the periods that the El Niño phenomenon
existed in the aforementioned basin, the methodology used was the GR4j method. On the one hand, the ERA5
grid data belonging to the European Space Agency Satellite was used, using Google Earth Engine (GEE) from
which precipitation and average temperature information was extracted. Likewise, from the National Water
System (ANA), information was extracted on daily flows from the Putinza hydrometric station between the
period 2014-2017, which was used for the calibration and validation of the model. The analysis of results was
carried out taking into account the Nash coefficient and the coefficient of determination R2 as efficiency
criteria. Finally, the results obtained in the calibration and validation are satisfactory, which indicates that
there is a good performance.
1 INTRODUCTION
In recent years, numerous floods have occurred in
different basins of Peru. Currently, different studies
are being carried out to implement projects that help
reduce the danger that affects the population,
however, in many projects they do not have
satisfactory results because historical records of flow
measurement are required in the affected areas.
One of the affected basins is the Cañete river
basin, in periods of floods it is in danger due to the
recurrent rains where there is the possibility of
exceeding its flood threshold, generating overflows,
flooding of crop fields; unfortunately, it is not
possible to design riparian defenses that are efficient
to minimize the danger in these areas due to the lack
of historical records of flow measurement (Andean
News, 2017).
a
https://orcid.org/0000-0001-5913-3711
b
https://orcid.org/0000-0001-8608-2745
c
https://orcid.org/0000-0003-2895-9582
d
https://orcid.org/0000-0002-9685-2886
Likewise, the Cañete River basin has suffered the
natural event known as the El Niño phenomenon;
during the last 40 years it was recorded in the periods
1982-1983 (Public Eye, 2017), 1997-1998 (CAF,
2000), 2017-2018 (Government of Peru, 2019),
generating flooding of villages, cultivation areas,
road overflows, collapse of bridges; because the
projects that are designed have little hydrometric and
meteorological information for their design,
obtaining deficient results that directly affect the
population.
Faced with these problems, the present research
work aims to generate historical data of flows at the
daily and monthly level in the Cañete river basin for
a simulation of 39 years (1980 – 2019) and determine
the records of the maximum flows that happened the
El Niño phenomenon in the periods during the last 40
years in the aforementioned basin; These generated
records will serve as a reference for the development
252
Quispe, E., Buitrón, G., Arteaga, A. and Chipana, R.
Generation of Daily and Monthly Flows Using the GR4j Method with ERA5 Grilled Data in the Cañete River Basin to the Putinza Hydrometric Station.
DOI: 10.5220/0011648100003393
In Proceedings of the 15th International Conference on Agents and Artificial Intelligence (ICAART 2023) - Volume 3, pages 252-259
ISBN: 978-989-758-623-1; ISSN: 2184-433X
Copyright
c
2023 by SCITEPRESS – Science and Technology Publications, Lda. Under CC license (CC BY-NC-ND 4.0)

of the design of the riparian defenses, seeking that
they are the most adequate and really comply with the
quality standards and the norms provided, in such a
way that it becomes a good state investment, which
translates into giving a better quality of life to the
population.
For this reason it was proposed to use the
hydrological model GR4j, which in French means
Génie Rural á 4 parameters Journalier, which will be
used for the estimation of flows at the daily level of
the Cañete river basin to the Putinza hydrometric
station, taking the daily flow records (m3 / s)
discharged from the National Water Authority
(ANA); precipitation (mm) and temperature (°C)
data obtained from the Google Earth Engine (GEE)
platform.
1.1 Area of Study
The Cañete River basin is located between parallels
11°58'19'' and 13°18'55'' South Latitude and
meridians 75° 30'26'' and 76°30'46'' West Longitude,
having as hydrographic limits: on the north the Cueca
of the Mantaro River, on the south with the Q°Topara
– Pacific Ocean Interbasin, on the east with the
Mantaro and San Juan River Basin and on the West
with the Omas and Mala and Mala basins. the Pacific
Ocean.
Likewise, for the present study, the Putinza
hydrometric station located at the geographical
coordinates was used: Latitude: 12°40'05.5'',
Longitude: 75°57'35.3" and at an altitude of 1960
m.a.s.l., for the delimitation of the basin from which
we will obtain the average daily flows.
1.2 Previous Studies of the use of the
GR4j Hydrological Model
Research studies related to the GR4j hydrological
model were carried out, in order to make the
application for the estimation of daily flows viable.
In the research: Performance evaluation of
hydrological models GR4J, HBV and SOCONT for
the forecast of average daily flows in the Ramis river
basin, Peru: aims to evaluate the performance of three
hydrological models for the forecast of daily flows in
a basin of the Peruvian highlands; giving as best result
despite using only four parameters the hydrological
model GR4j, the simulation of the flows of avenue
and low water are satisfy (Lujano and others. , 2020).
Also, in the research: Comparison of rain-runoff
hydrological models GR2M and GR4J in obtaining
average flows in the Subacoche river basin: analyzes
the hydrological models GR2M flows at monthly
pace and GR4J for flows at daily step with the aim of
determining the veracity of these rain-runoff models;
providing satisfactory results in calibration and
validation, so it is possible to represent the
hydrological conditions of the Subacoche river basin
(Rodríguez, 2021).
1.3 Cartographic Data
The cartographic information was extracted in
Shapefile format at a scale of 1:100000 from the
National Geographic Institute (IGN). The pages of
the National Charter covering the area of study are:
Table 1: Sheets of the national charter.
Letter No. Numbe
r
26 -
k
Lunahuama
26 - l Tupe
25 - l Yauyos
25 -
k
Huarochiri
24 - l Oro
y
a
24 -
k
Matucama
1.4 Rainfall Data
The rainfall information was extracted using the
ERA5 datasets generated by the Copernicus Climate
Change Service of the European Union through the
Google Earth Engine (GEE) platform using the codes
provided by Mg. Abel C. (Carmona, 2021).
The average precipitation in the period 1/1/2014 –
30/11/2017 was used for the development of the
calibration and in the period 01/12/2015 – 29/10/2017
for the development of the validation.
1.5 Climatological Data
For the development of the calibration in the period
1/1/2014 – 11/30/2017, the average temperature that
was extracted from the Google Earth Engine (GEE)
platform was used using the ERA5 grid data at a daily
rate.
1.6 Hydrometric Data
The hydrometric information was extracted through
the system of the National Water Authority (ANA,
2021), at the Putinza station, the daily flows were
considered for the development of the calibration in
the period 1/1/2014 – 30/11/2015 and for validation
the period 1/12/2015 – 29/10/2017.
Generation of Daily and Monthly Flows Using the GR4j Method with ERA5 Grilled Data in the Cañete River Basin to the Putinza
Hydrometric Station
253
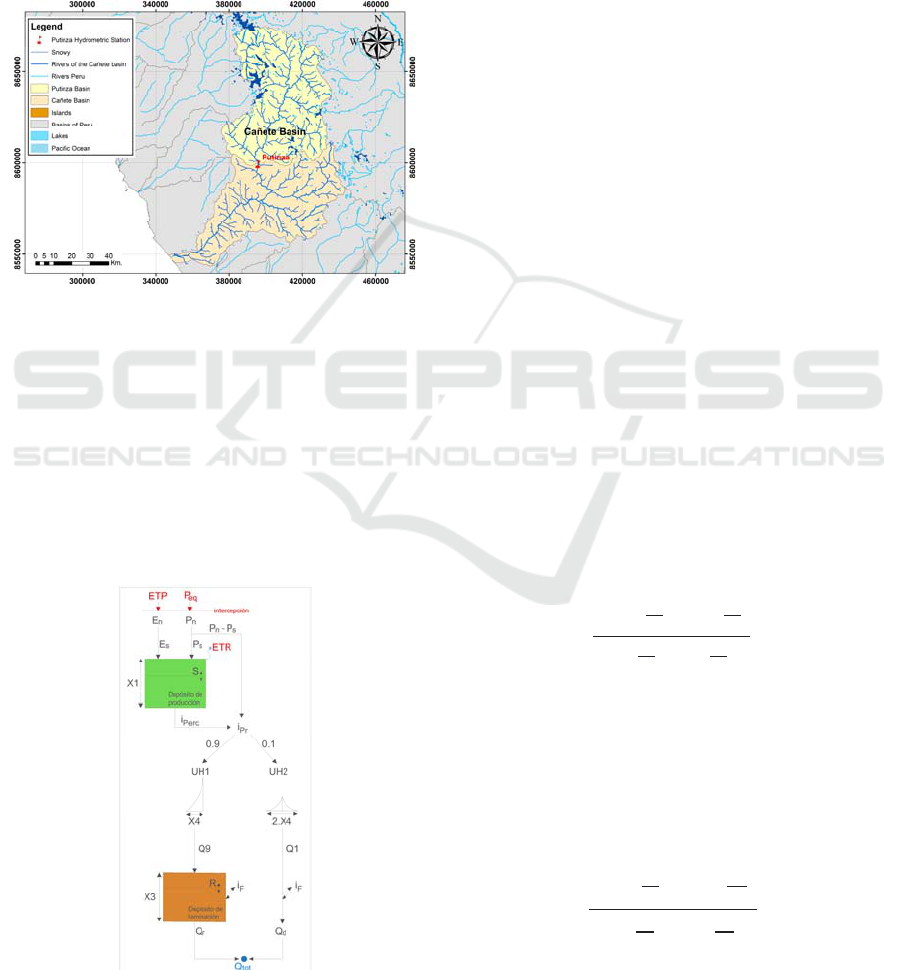
1.7 ArcGIS
It is a complete software that allows you to collect,
organize, manage, analyze, share and distribute
geographic information; as the world's leading
platform for creating and using geographic information
systems (Pucha et al., 2017). For the present work, this
software was used for the delimitation of the sub-basin
of the Cañete River, having as its main point the
Putinza hydrological station.
Figure 1: Sub-basin of the sugarcane basin delimited from
Putinza station.
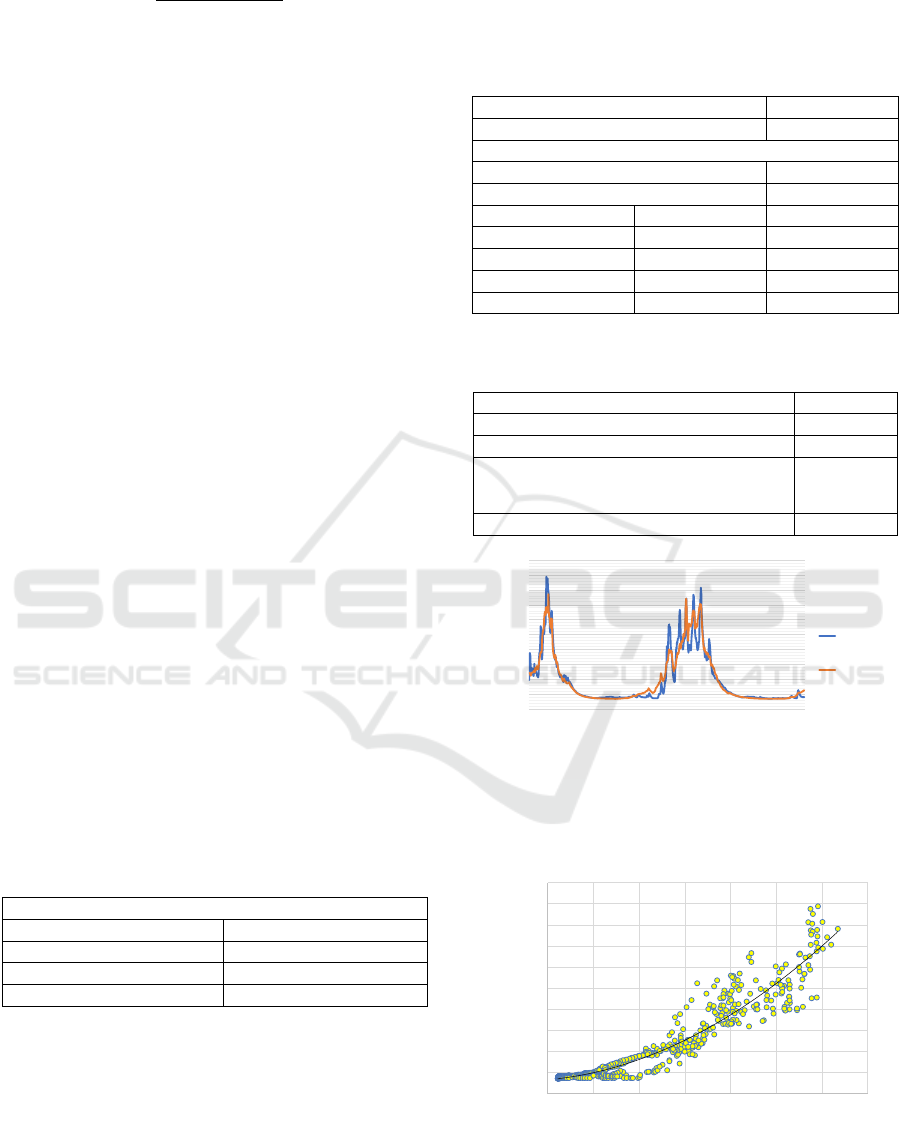
1.8 Description of Model GR4j
It is a model that simulates the precipitation-runoff
process on a daily time scale using four parameters.
This model has been used as a sequential simulation
of soil moisture and flow data in conceptual
precipitation-runoff models, obtaining very
satisfactory results, which is why it was decided to
use it in the development of this article.
Figure 2: GR4j hydrological model (Perrín et al., 2010).
The GR4j model takes the average daily
precipitation and evapotranspiration within the basin
area as input and the daily flow as the output.
Similarly, it uses the Nash - Sutcliffe coefficient as
the target function in the calibration phase. In the
GR4j model, precipitation and potential
evapotranspiration are expressed as and respectively
(Rincón, 2019).
For our case, the average rainfall values recorded
by remote sensing and provided in a set of ERA5
gridded climates are calculated by spatial
interpolation. It should be noted that all quantities,
whether inputs, outputs or internal variables are
expressed in mm / day, for this reason, the volumes
of water must be divided by the area of the basin when
necessary.
1.9 Mathematical Description of the
GR4j Model
Determination of precipitation and net potential
evapotranspiration:
The main components of the model include: first,
subtracting evapotranspiration E from precipitation P,
determining a net precipitation P
n
or a net
evapotranspiration capacity E
n
.
The net precipitation equation is:
If P≥E then P
n
=P-E and E
n
= 0 (1
)
The net precipitation clearance equation is:
If P≥E then P n=0 and E
n
=E-P (2
)
Production storage: In the case where P
n
, is not
zero, a part P
s
of Pn, enters the production tank:
The production storage equation is:
P
s
=
x
1
1-
S
1
x
1
tanh
P
1
x
1
1+
S
1
x
1
tanh
P
1
x
1
(3)
P
s
is determined as a function of the level S in the
tank, where x
1
(mm) is the maximum capacity of the
production tank When En is not zero, an actual
evaporation rate is determined as a function of the
level in the production storage in order to calculate
the amount of water that will evaporate from the tank.
The real evaporation rate equation is:
E
s
=
S 2-
S
x
1
tanh
E
1
x
1
1+
S
x
1
tanh
E
1
x
1
(4)
ICAART 2023 - 15th International Conference on Agents and Artificial Intelligence
254

In this way, the water content in the production
tank is updated as the equation of amount of water
collected:
S = S-E
s
+P
s
(5)
It is important to note that S can never exceed x
1
.
A quantity P
erc
escapes as production storage
percolation. This value is calculated by the
percolation equation in the production tank:
P
erc
=S 1- 1+
4s
9
x1
1
-0.25
(6)
From the above expression it concludes that
percolation does not contribute much to the flow rate
for this reason it is important mainly for the
simulation of minimal events. The percolation value
is always less than S. The new level in the tank is
defined as:
S = S-P
erc
(7)
Linear distribution with unit hydrographs. The
total amount of water P_r which reaches the
distribution functions is given by:
P
r
= P
erc
+ (P
n
-P
s
) (8)
The value of the P_r is divided into two flow
components: 90% of P_r is distributed by means of a
UH1 unit hydrograph and then by a non-linear
distribution tank. The remaining 10% of P
r
is
distributed by means of a UH2 unit hydrograph. With
UH1 and UH2, the lag time between the rain event and
the resulting peak flow can be simulated. The ordinates
of both hydrographs are used in the model to distribute
the effective rainfall over several successive time
intervals. UH1 and UH2 depend on the same parameter
x 4 expressed in days, however, UH1 has a base time
of x 4 days, while UH2 has a base time of 2x
4
days
.
The parameter x
4
can take real values and should be
May 0.5 days. In their discrete form, UH1 and UH2
unit hydrographs have n and m ordered respectively,
where n and m are the smallest integers exceeding x 4
and 2x
4
respectively. The ordinates of both
hydrographs are derived from the corresponding S-
curves (cumulative proportion of input over time)
denoted by SH1 and SH2 respectively.
2 METHODOLOGY
This section details the procedures used for the
development of this work.
2.1 Calibration of the GR4j Model
The objective of this stage is to identify the values of
the model parameters in order to optimally adjust a
system as close to the real system that the model
represents. The efficiency criteria considered at the
calibration stage are detailed below:
2.1.1 Nash - Sutcliffe Coefficient
Evaluation criterion that determines the efficiency
between a simulated model and another observed by
measuring the variability of observations. It is
expressed as follows:
E=1-
∑
Q
sim,i
-Q
i
2
n
i=1
∑
Q
i
-Q
2
n
i=1
(9)
Where:
Qsim – Simulated flow rates in m3/s
Qi – Observed flow rates in m3/s
𝑄
– Average flow rates observed in m3/s
The following is a table with the reference values
of Nash's criterion:
Table 2: Referential values of the Nash – Sutcliffe Criterion
(Molnar, 2011).
Nash Adjustment
< 0.2 Insufficient
0.2
–
0.4 Satisfactor
y
0.4 – 0.6 Well
0.6
–
0.8 Ver
y
g
oo
d
> 0.8 Excellent
2.1.2 Criterion Nash - Sutcliffe
It is used when the values of the simulated variable
are very large. It is defined as follows:
E=1-
∑
log(Q
sim,i)
)-log(Q
i
)
2
n
i=1
∑
log(Q
i
)-log(Q)
2
n
i=1
(10)
Where:
Qsim,i – Simulated download in a time I in m3/s
Qi – Discharge observed at a time i in m3/s
𝑄
– Average discharges observed in the period of
time considered in m3/s
2.1.3 Coefficient of Determination (R
2
)
It is the chart of the correlation coefficient, which
varies from 0 to 1. It is expressed as follows:
Generation of Daily and Monthly Flows Using the GR4j Method with ERA5 Grilled Data in the Cañete River Basin to the Putinza
Hydrometric Station
255
R
2
=1-
Cov(Q
0
,Q
s
)
SdQ
0
.SdQ
s
(11)
Where:
Cov(Q0, Qs) – Covariance of observed and
estimated flows.
Sd(Q0) – Standard deviation of observed
values.
Sd(Qs) – Standard deviation of the estimated
heats.
2.2 Validation of the Hydrological
Model
The objective of this stage is to verify the quality of
the calibration settings. For model validation, the
same efficiency criteria are used for results analysis.
Also, in both stages, the verification of the fit is
used to visually compare the duration curve of actual
and estimated flows.
3 RESULTS
3.1 Calibration
The analysis period is 699 days from 01/01/2014 to
11/30/2015, with a trial period of 10 days. Likewise,
it should be noted that this period of analysis was used
due to the lack of data offered by the ANA in said
hydrometric station.
Table 3 shows that the efficiency criteria are
within the evaluation range. According to Table 2, the
fit is excellent when the Nash coefficient is greater
than 0.8. In this case, the value of Nash is 86.5 %.
Therefore, the adjustment made is interpreted to be
excellent.
Table 3: Efficiency criteria (%) in the calibration stage.
Efficiency criteria (%)
Nash(Q) 86.5
Nash
(
VQ
)
78.8
Nash
(
ln
(
Q
))
45.2
Balance sheet 96.3
3.2 Validation
For this stage, the analysis period is 699 days from
01/12/2015 to 10/29/2017 with a trial period of 10
days. Likewise, it should be noted that this period of
analysis was used due to the lack of data offered by
the ANA in said hydrometric station.Table 6 shows
that the Nash coefficient = 84.4% is higher than the
coefficient obtained in the calibration. Therefore, the
adjustment made is interpreted to be excellent.
Table 4: Parameters of the GR4j model in the calibration
stage.
Name of the basin Cañete
Area of the basin
(
km2
)
3139.60
Initial values
Initial fill rate S0/x1 0.30
Initial fill rate R0/3 0.70
Parameters Unit Transf.
X1 m
m
5.68
X2 m
m
-4.88
X3 m
m
6.45
X4 days -13.62
Table 5: Averages of the hydrometric data used in the
calibration stage.
Average observed rainfall (mm/day) 4.409
Average observed ETP (mm/day) 1.234
Observed mean flow rates
(
mm/da
y)
1.113
Average of the roots of the observed
flows
0.974
Avera
g
e lo
g
arithm of observed flows -0.161
Figure 3: Comparison of measured flow rates (ANA) with
the flows generated with the GR4j model using ERA5 grid
data for the period 01/01/2014 to 30/11/2015.
Figure 4: R2 correlation between daily flows (m3/s)
generated with the GR4j method and daily flows (m3/s)
recorded for the Cañete basin to Putinza station.
0
20
40
60
80
100
120
140
160
180
200
31/01/2014
31/03/2014
31/05/2014
31/07/2014
30/09/2014
30/11/2014
31/01/2015
31/03/2015
31/05/2015
31/07/2015
30/09/2015
30/11/2015
Flow rates (m3/s)
Days
Measured
flows
Flows
generated
y = 0.0072x
2
+ 0.1966x + 13.254
R² = 0.9096
0.00
20.00
40.00
60.00
80.00
100.00
120.00
140.00
160.00
180.00
200.00
0.00 20.00 40.00 60.00 80.00 100.00 120.00 140.00
Original average flows (m3/s)
Average daily flows with GR4j generated m3/s
ICAART 2023 - 15th International Conference on Agents and Artificial Intelligence
256
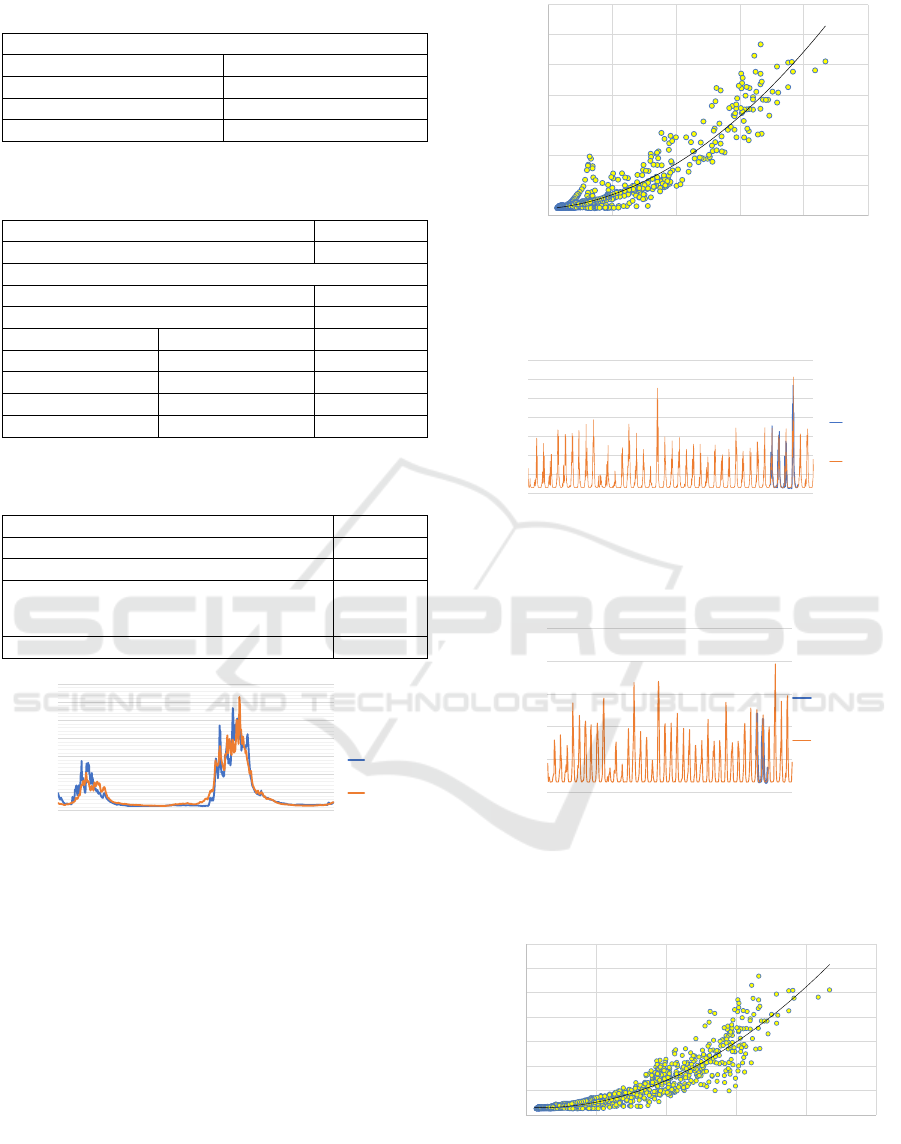
Table 6: Efficiency criteria (%) in the validation stage.
Efficienc
y
criteria
(
%
)
Nash
(
Q
)
84.4
Nash
(
VQ
)
82.5
Nash(ln(Q)) 74.9
Balance sheet 105.9
Table 7: Parameters of the GR4j model in the validation
stage.
Name of the basin Cañete
Area of the basin (km2) 3139.60
Initial values
Initial fill rate S0/x1 0.30
Initial fill rate R0/3 0.70
Parameters Unit Transf.
X1 m
m
6.74
X2 m
m
-4.05
X3 m
m
5.78
X4 da
y
s -13.62
Table 8: Averages of hydrometric data used in the
validation stage.
Avera
g
e observed rainfall
(
mm/da
y)
4.642
Avera
g
e observed ETP
(
mm/da
y)
1.228
Observed mean flow rates
(
mm/da
y)
1.255
Average of the roots of the observed flows 0.989
Average logarithm of observed flows -0.189
Figure 5: Comparison of measured flows (ANA) and those
generated with the GR4j model using ERA5 grid data for
the period 01/12/2015 to 29/10/2017.
4 ANALYSIS OF RESULTS
In the calibration and validation sections, NASH
efficiency criteria are shown 86.5% and 84.4%
respectively; Figure 4 shows that R2 = 0.9096 is
greater than 0 and close to 1, Figure 6 shows that R2
= 0.8973; therefore, it can be deduced that the GR4j
method is effective for the study of the Cañete River
basin.
Figure 6: R2 correlation between daily flows (m3/s)
generated with the GR4j method and daily flows (m3/s)
recorded for the Cañete basin to Putinza station.
Figure 7: Daily flow rates generated with the GR4j method,
in the period 1980 - 2019.
Figure 8: Monthly flow rates generated with the GR4j
method, in the period 1980 - 2019.
Figure 9: R2 correlation between daily flows (m3/s)
generated with the GR4j method for the period 1980-2019
years and daily flows (m3/s) recorded for the Cañete basin
to Putinza station.
0
50
100
150
200
250
300
350
31/12/2015
29/02/2016
30/04/2016
30/06/2016
31/08/2016
31/10/2016
31/12/2016
28/02/2017
30/04/2017
30/06/2017
31/08/2017
Flow rates (m3/s)
Days
Measured
flows
Flows
generated
y = 0.0056x
2
+ 0.1815x + 11.598
R² = 0.8973
0.00
50.00
100.00
150.00
200.00
250.00
300.00
350.00
0.00 50.00 100.00 150.00 200.00 250.00
Original average flows (m3/s)
Average daily flows with GR4j generated m3/s
0
50
100
150
200
250
300
350
01/01/1980
01/01/1981
01/01/1982
01/01/1983
01/01/1984
01/01/1985
01/01/1986
01/01/1987
01/01/1988
01/01/1989
01/01/1990
01/01/1991
01/01/1992
01/01/1993
01/01/1994
01/01/1995
01/01/1996
01/01/1997
01/01/1998
01/01/1999
01/01/2000
01/01/2001
01/01/2002
01/01/2003
01/01/2004
01/01/2005
01/01/2006
01/01/2007
01/01/2008
01/01/2009
01/01/2010
01/01/2011
01/01/2012
01/01/2013
01/01/2014
01/01/2015
01/01/2016
01/01/2017
01/01/2018
01/01/2019
Flow rates (m3/s)
Days
Measured
flows
Flows
generated
0.00
50.00
100.00
150.00
200.00
250.00
Ene-1980
Set-1982
May-1985
Ene-1988
Set-1990
May-1993
Ene-1996
Set-1998
May-2001
Ene-2004
Set-2006
May-2009
Ene-2012
Set-2014
May-2017
Flow rates (m3/s)
Days
Measured flows
Flows
generated
y = 0.0068x
2
- 0.1385x + 15.888
R² = 0.8805
0.00
50.00
100.00
150.00
200.00
250.00
300.00
350.00
0.00 50.00 100.00 150.00 200.00 250.00
Original average flows (m3/s)
Average daily flows with GR4j generated (m3/s)
Generation of Daily and Monthly Flows Using the GR4j Method with ERA5 Grilled Data in the Cañete River Basin to the Putinza
Hydrometric Station
257

For the simulation of the 39-year period, the
values x1,x2,x3,x4 of the validation were used; of
these results a revalidation was carried out to improve
the data by accommodating in a quadratic equation of
second degree, obtaining Figure 7 the record of flows
at the daily level, in Figure 8 the registration of flows
at the monthly level, in Figure 9 the correlation R2 =
0.8805 is shown; then, it follows that the GR4j
method was properly adjusted, since the correlation is
very close to 1; There is also little variability between
measured and recorded flows.
Figure 7 shows the maximum flows generated
with the GR4j method during the periods that the El
Niño phenomenon occurred in the last 40 years, these
being in the periods: i) 1982-1983, a maximum flow
of 132.50 m3/s on the date 02/10/1982, ii) 1997-1998,
a maximum flow of 276.51 m3/s was recorded on the
date 02/8/1998 and iii) 2017-2018, a maximum flow
of 305.71 m3/s was recorded on 03/15/2017; from
which it can be deduced that in the Cañete River basin
the El Niño phenomenon had the greatest impact in
the period 2017-2018 and the least impact in the
period 1982-1983.
5 CONCLUSIONS
It can be concluded that the GR4j model was properly
applied for the estimation of daily and monthly flows
in the Cañete River basin to the Putinza hydrometric
station resulting in a satisfactory representation of the
series of daily flows. Also, allowing to reconstruct
past historical records using the grid data of
precipitation and temperature ERA5 for the period
1980 – 2019.
The GR4j method can serve as a basis for other
studies in other basins to generate extensive flow
records over time, since it uses four main variables.
The flows generated by this method can be used
in the planning of various hydraulic and civil projects,
such as irrigation works for agricultural land,
construction of bridges, taking into account the
Putinza hydrometric station.
The area surrounding the sub basin of Cañete
towards the Putinza station, has been roughed 3 times
in the last 40 years by the El Niño phenomenon, this
phenomenon has caused structural havoc to the
population, this because there is no hydrological
study that can serve as a basis for a correct design of
riparian defense, That is why it is expected that the
present work will serve as a reference for the
compilation of necessary information to be able to
plan projects that meet the needs of the population.
The values of the Nash efficiency criterion for
calibration and validation are 86.5% and 84.4%
respectively. Both values are within an excellent
range demonstrating that the model was adjusted
properly.
Bilan's criteria values for calibration and
validation are 96.3% and 105.9% respectively,
showing optimal model performance.
The graph for monthly flows will also allow us to
estimate the monthly prorated distribution over an
extended period of the year, which will give us a
better idea of the monthly profile distribution.
REFERENCES
Andina Peruvian News Agency. (2017). Cañete River
could exceed its flood threshold in the following days.
https://andina.pe/agencia/noticia-rio-canete-podria-
sobrepasar-su-umbral-inundacion-siguientes-dias-
744688.aspx
Public Eye. (2017). El Niño phenomenon: three decades of
death and destruction in Peru. Public Eye. https://ojo-
publico.com/404/las-cifras-historicas-del-fenomeno-
del-ni%C3%B1o-en-peru
Development Bank of Latin America. (2000). The lessons
of El Niño. Peru. CAF. http://scioteca.caf.com/
handle/123456789/676
Government of Peru. (2022). El Niño phenomenon.
https://www.gob.pe/9297-fenomeno-el-nino
Lujano, E., Sosa, J. D., Lujano, R., & Lujano, A. (2020).
Performance evaluation of hydrological models GR4J,
HBV and SOCONT for the forecast of average daily
flows in the Ramis River basin, Peru. UC
ENGINEERING Magazine, 27(2): 189-199.
Rodríguez Cárdenas, F. E., & Rodríguez Villalba, A. J.
(2021). Comparison of rain-runoff hydrological
models GR2M and GR4J in obtaining average flows
in the Subachoque river basin. https://
repositorioslatinoamericanos.uchile.cl/handle/2250/34
30054
Carmona A. (2021). Code Google Earth Engine.
https://code.earthengine.google.com/ce29e6d1d05079
dfac0063043b3be4c5
National Water Authority (2021). Water Observatory.
National Water Resources Information System.
https://snirh.ana.gob.pe/observatorioSNIRH/
Pucha-Cofrep, F., Fries, A., Cánovas-García, F., Oñate-
Valdivieso, F., González-Jaramillo, V., & Pucha-
Cofrep, D. (2017). GIS fundamentals: Applications
with ArcGIS.
Carvajal, L. F., & Roldán, E. (2007). Calibration of the
rain-runoff model added GR4J application: Boring
river basin. Dyna, 74(152), 73-87.
Molnar, P. (2011). Calibration. Watershed Modelling, SS
2011. Institute of Environmental Engineering, Chair of
Hydrolgy and Water Resources Management, ETH
Zurich, Switzerland.
ICAART 2023 - 15th International Conference on Agents and Artificial Intelligence
258

Rincón Achury, L. V. (2019). Application of the GR2M and
GR4J rain-runoff models in the Gualí River basin for
the management of water resources.
https://repository.usta.edu.co/bitstream/handle/11634/
16704/2019laurarinc%C3%B3n.pdf?sequence=8&isAl
lowed=y
Perrin, C., Oudin, L., Andreassian, V., Rojas, C., Michael,
C. & Mathevet, T. (2010). Impact of limited
streamflow data on the efficiency and the parameters of
rainfall—runoff models. Hydrological Sciences,
52(1):131-151.
Generation of Daily and Monthly Flows Using the GR4j Method with ERA5 Grilled Data in the Cañete River Basin to the Putinza
Hydrometric Station
259
