Deep Learning for Diagonal Earlobe Crease Detection
Sara L. Almonacid-Uribe
a
, Oliverio J. Santana
b
,
Daniel Hern
´
andez-Sosa
c
and David Freire-Obreg
´
on
d
SIANI, Universidad de Las Palmas de Gran Canaria, Las Palmas de Gran Canaria, Spain
Keywords:
Computer Vision, Diagonal Earlobe Crease, DELC, Frank’s Sign, Cardiovascular Disease, Coronary Artery
Disease, Deep Learning.
Abstract:
An article published on Medical News Today in June 2022 presented a fundamental question in its title: Can an
earlobe crease predict heart attacks? The author explained that end arteries supply the heart and ears. In other
words, if they lose blood supply, no other arteries can take over, resulting in tissue damage. Consequently,
some earlobes have a diagonal crease, line, or deep fold that resembles a wrinkle. In this paper, we take a
step toward detecting this specific marker, commonly known as DELC or Frank’s Sign. For this reason, we
have made the first DELC dataset available to the public. In addition, we have investigated the performance of
numerous cutting-edge backbones on annotated photos. Experimentally, we demonstrate that it is possible to
solve this challenge by combining pre-trained encoders with a customized classifier to achieve 97.7% accuracy.
Moreover, we have analyzed the backbone trade-off between performance and size, estimating MobileNet as
the most promising encoder.
1 INTRODUCTION
According to the Centers for Disease Control and Pre-
vention (CDC), heart disease is the leading cause of
death for men, women, and the majority of racial
and ethnic groups in the United States (CDC, 2022).
Overall, cardiovascular disease is responsible for one
death every 34 seconds in the United States. Further-
more, one in five heart attacks are silent; the dam-
age is done, but the individual is unaware (Tsao et al.,
2022). Early detection is essential for providing treat-
ment to alleviate symptoms, reduce mortality, and en-
hance the quality of life (Boudoulas et al., 2016).
As a standard practice, clinicians are taught to di-
agnose coronary artery disease (CAD) based on the
medical history, biomarkers, raw scores, and phys-
ical examinations of individual patients, which they
interpret based on their clinical experience. However,
this approach has evolved due to technological ad-
vances. In the past decade, deep learning (DL) has
demonstrated a promising ability to detect abnormal-
ities in computed tomography (CT) images (Ardila
et al., 2019). Several DL techniques have been pro-
posed to automatically estimate CAD markers from
a
https://orcid.org/0000-0001-6660-0867
b
https://orcid.org/0000-0001-7511-5783
c
https://orcid.org/0000-0003-3022-7698
d
https://orcid.org/0000-0003-2378-4277
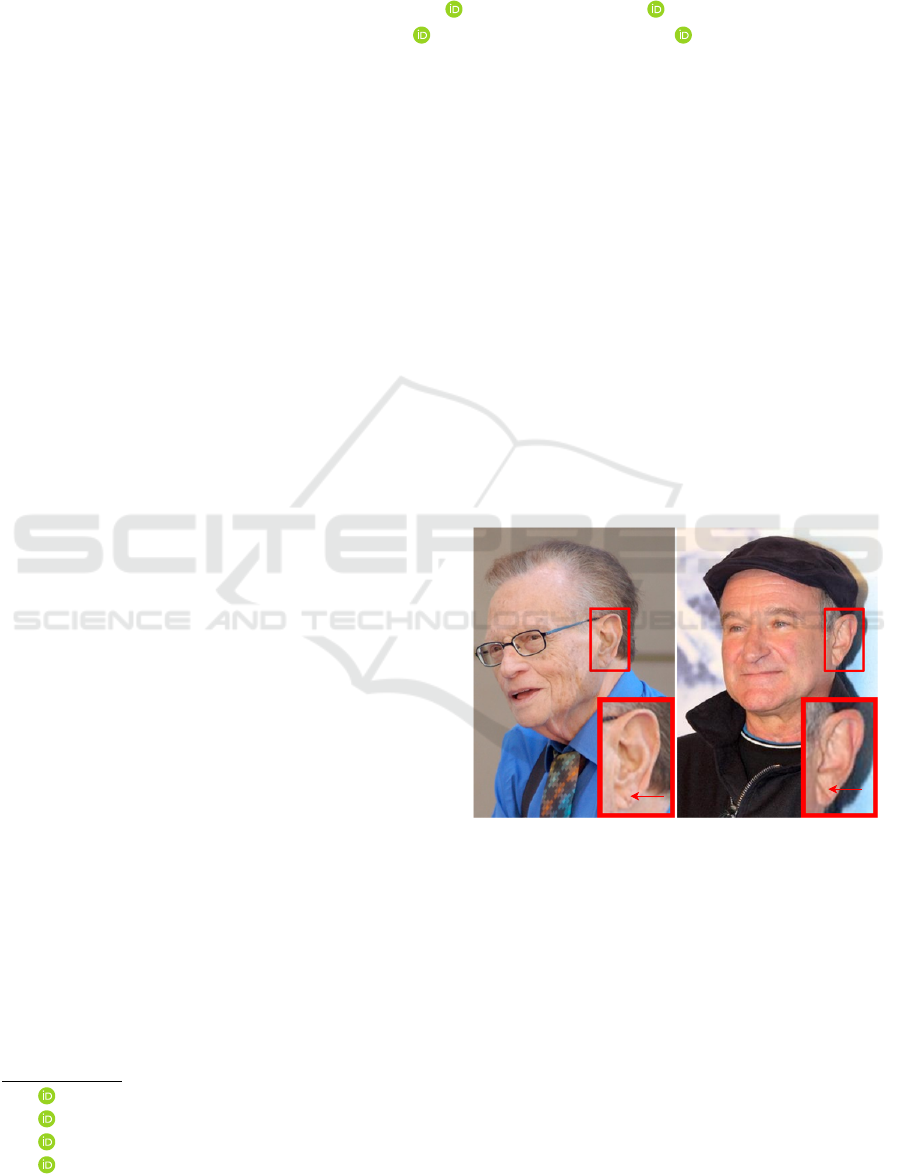
Figure 1: Celebrities exhibiting a DELC marker. In 1987,
the former CNN interviewer Larry King suffered a heart at-
tack and underwent bypass surgery (photo by Eva Rinaldi,
Wikimedia Commons, CC-BY-SA 2.0). In 2009, the for-
mer comedian and actor Robin Williams underwent aortic
valve replacement surgery (photo by Angela George, Wiki-
media Commons, CC-BY 3.0). The ear is highlighted in
both pictures.
CT images. The majority of these models predict clin-
ically relevant image features from cardiac CT, such
as coronary artery calcification scoring (Isgum et al.,
2012; Wolterink et al., 2015; Zeleznik et al., 2021),
non-calcified atherosclerotic plaque localization (Ya-
mak et al., 2014; Zhao et al., 2019), and stenosis from
cardiac CT (Lee et al., 2019; Zreik et al., 2019).
74
Almonacid-Uribe, S., Santana, O., Hernández-Sosa, D. and Freire-Obregón, D.
Deep Learning for Diagonal Earlobe Crease Detection.
DOI: 10.5220/0011644400003411
In Proceedings of the 12th International Conference on Pattern Recognition Applications and Methods (ICPRAM 2023), pages 74-81
ISBN: 978-989-758-626-2; ISSN: 2184-4313
Copyright
c
2023 by SCITEPRESS – Science and Technology Publications, Lda. Under CC license (CC BY-NC-ND 4.0)
Even though the development of DL on CT im-
ages is promising, CT equipment is expensive and
cardiac illnesses are hard to find unless the patient
has symptoms and goes to the hospital for a cardiac
checkup. In this context, the diagonal earlobe crease
(DELC) can be a helpful guide to identify cardiac
problems. This crease extends diagonally from the
tragus to the earlobe’s border (see Figure 1). It is
also known as Frank’s Sign because it was first de-
scribed by Frank in a case series of CAD patients
(Frank, 1973). Since then, numerous reports have
been published concerning its association primarily
with atherosclerosis, particularly CAD (Wieckowski,
2021). While not as well known as more traditional
approaches, DELC examinations are painless, non-
invasive, and simple to interpret. If its diagnostic ac-
curacy is sufficient for decision-making, it could be
utilized in primary care or emergency departments.
In this work, we have created a DELC detector
using state-of-the-art (SOTA) backbones and ear col-
lections as benchmarks for the models. First, we have
gathered DELC ear images available on the Internet.
Then, we developed multiple DL models consider-
ing pre-trained encoders, also known as backbones,
to predict whether or not an ear displays a DELC. In
addition, we analyzed the performance of the consid-
ered backbones by varying the classifier parameters
and found no correlation between the number of pa-
rameters and the best model.
Our proposal was evaluated using a mixed-source
dataset. As previously stated, we gathered 342 pos-
itive DELC images by collecting publicly available
images from the Internet and cropping off the ears.
Negative samples were obtained from a publicly ac-
cessible ear database, namely AWE (Emer
ˇ
si
ˇ
c et al.,
2017). All images are collected from natural settings,
including lighting, pose, and shape variations. Con-
sidering the number of samples, data augmentation
techniques were considered during training. The out-
comes are remarkable (predictions up to 97.7% accu-
rate) and have yielded intriguing insights.
Even though the earlobe is a relatively small
part of the ear (see Figure 2), the classifier’s perfor-
mance is noteworthy. Unlike other diseases, such as
melanoma, which can be found anywhere in the hu-
man body, the DELC is located in a specific area,
facilitating the detection task. The usability of the
trained models reveals an additional insightful rev-
elation. Light-weight convolutional neural networks
such as MobileNet provide high accuracy, balancing
the precision of complex neural network structures
with the performance constraints of mobile runtimes.
Hence, ubiquitous applications could take advantage
of this proposal, making it possible to detect DELC by
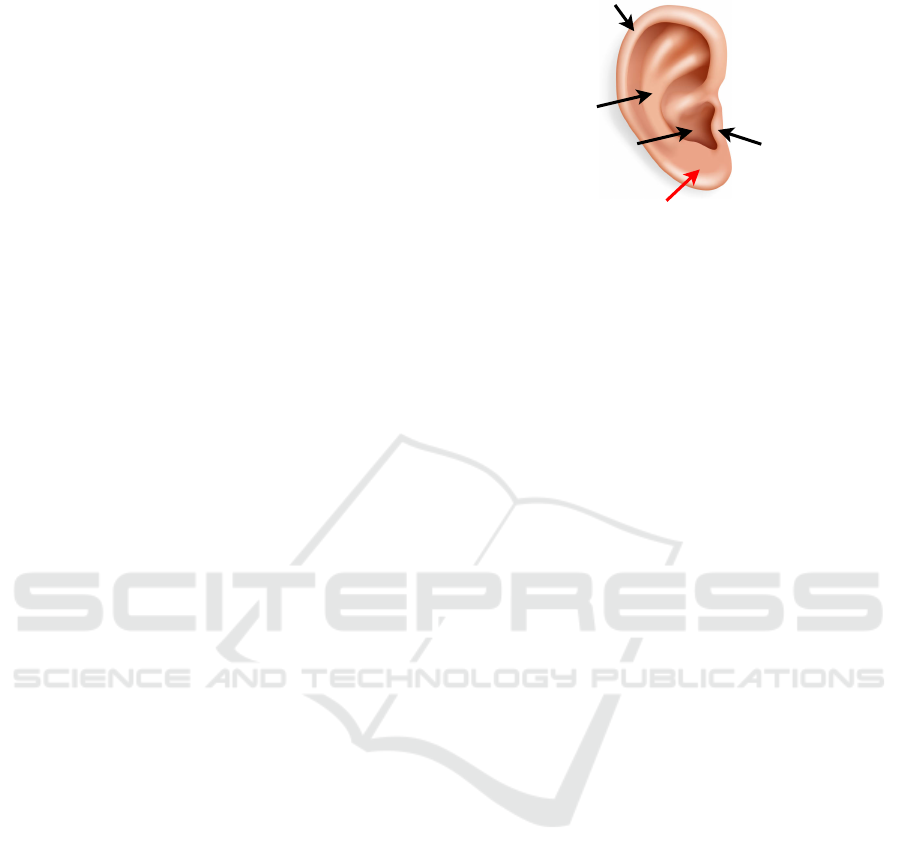
Helix
Tragus
Lobule
Anti-Helix
Concha
Figure 2: Outer ear scheme. The human earlobe (lobulus
auriculae) is composed of areolar and adipose connective
tissues that lack rigidity. Due to the absence of cartilage in
the earlobe, it has an abundant blood flow and may aid in
warming the ears (Steinberg and Rosner, 2003).
just using a smartphone anywhere and anytime. Our
contributions can be summarized as follows:
• We propose a novel dataset with DELC ear im-
ages in the wild with 342 samples. All samples
have been gathered from the Internet. The dataset
is publicly available.
• We experimentally demonstrate that it is possible
to tackle this problem by combining pre-trained
backbones with a new classifier.
• In this experiment, eleven different backbones are
compared to one another regarding their DELC
detection performance. Moreover, the models’
size-performance trade-off analysis demonstrates
that the problem can be effectively addressed by
employing light-weight encoders. As aforemen-
tioned, this opens the door for the broad imple-
mentation of this technology.
The remainder of this paper is organized as fol-
lows. Section 2 discusses previous related work. Sec-
tion 3 describes the proposed pipeline. Section 4 re-
ports the experimental setup and the experimental re-
sults. Finally, conclusions are drawn in Section 5.
2 RELATED WORK
The state of the art can be studied from both phys-
iological and technological viewpoints. The former
aims to find support for the relationship between CAD
and DELC by examining related studies, while the lat-
ter intends to evaluate the Computer Vision Commu-
nity proposals.
Deep Learning for Diagonal Earlobe Crease Detection
75
2.1 Physiological Relevance
Several investigations over the previous few decades
have established an association between DELC and
cardiac issues. DELC is a unilateral or bilateral diag-
onal fold in the earlobe, typically making a 45-degree
angle from the intertragic notch to the posterior edge
of the ear. This marker has a grading system linked to
the incidence of CAD based on numerous character-
istics, including length, depth, bilateralism, and incli-
nation. Complete bilateralism is regarded as the most
severe condition (Rodr
´
ıguez-L
´
opez et al., 2015).
As previously stated, Frank established the ini-
tial idea for this association (Frank, 1973). Accord-
ing to some scientists, it indicates physiological aging
(Mallinson and Brooke, 2017). Nonetheless, the CAD
concept began to gather support, and several addi-
tional researchers conducted experiments demonstrat-
ing that this link can accurately predict if a patient is
prone to cardiovascular issues. It should be noted that
coronary disease is one of the leading causes of death
in developed nations (Sanchis-Gomar et al., 2016);
hence, early detection is essential for enhancing the
patient’s quality of life and preventing or lowering
CAD-related mortality.
A pioneer work evaluated 340 patients, of whom
257 had CAD (Pasternac and Sami, 1982). It was de-
termined that 91% of patients with DELC had CAD,
the most prevalent sign in those with more severe
disease. More recently, Stoyanov et al. investi-
gated 45 patients, 16 females and 29 males (Stoy-
anov et al., 2021). Twenty-two individuals had a
well-documented clinical history of CAD, while the
remaining patients did not. Upon general examina-
tion before the autopsy, 35 patients had well-formed
DELC. In addition, patients with pierced ears had no
signs of lobule injury due to piercing. Hence the ob-
served creases were accepted as DELC.
2.2 Computer Vision Relevance
For decades, biometric traits have been explored in
Computer Vision. Recent research has focused on
gait analysis or body components to address a va-
riety of tasks, including violence detection (Freire-
Obreg
´
on et al., 2022), facial expressions (Santana
et al., 2022), face/voice verification (Freire-Obreg
´
on
et al., 2021), and forensics (Castrill
´
on-Santana et al.,
2018). Ear recognition has also been widely ad-
dressed (Gald
´
amez et al., 2017; Alshazly et al., 2019).
For healthcare use, relevant proposals diagnose
several ear-related diseases such as otitis media, attic
retraction, atelectasis, tumors, or otitis externa. These
categories encompass most ear illnesses diagnosed by
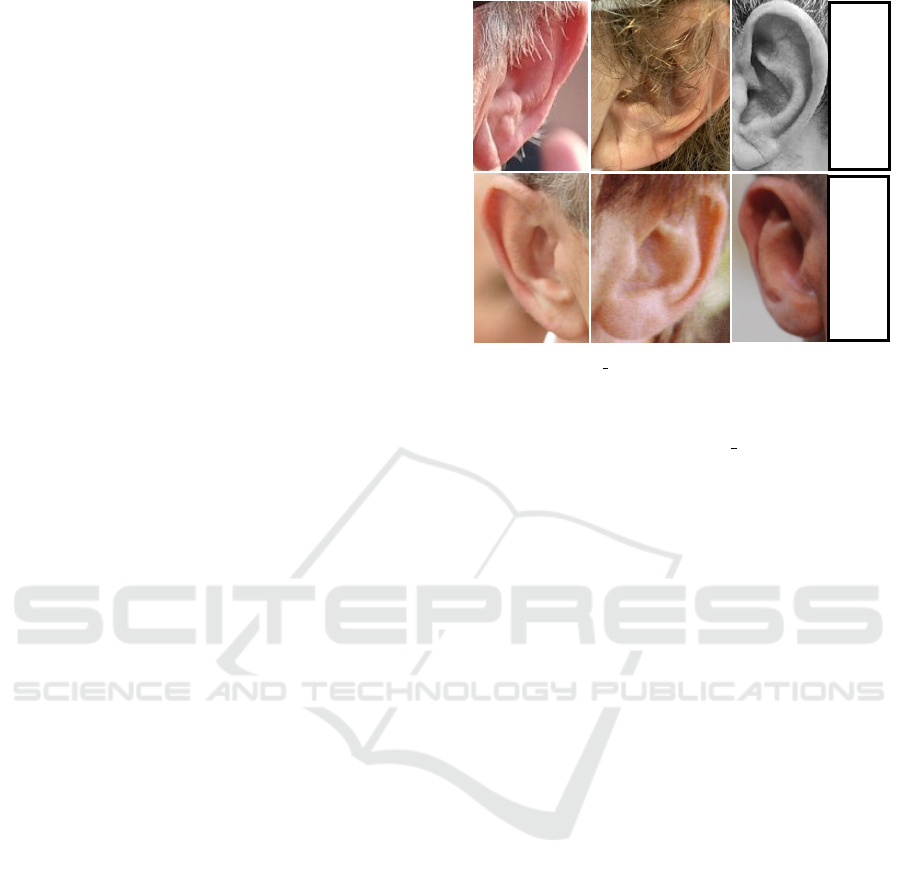
DELC_ULPGC
(Positive subset)
AWE'
(Negative subset)
Figure 3: DELC ULPGC+AWE’ Dataset. The studied
dataset comprises two in-the-wild subsets. Both of them
are gathered from the Internet: a subset of the well-known
AWE dataset (Emer
ˇ
si
ˇ
c et al., 2017) as the DELC negative
subset and the new proposed DELC ULPGC subset.
observing the eardrum with an otoendoscopy (Cha
et al., 2019). Recently, Zeng et al. combined several
pre-trained encoders to achieve a 95,59% accuracy on
detecting some of these illnesses using otoendoscopy
images as input (Zeng et al., 2021). These authors ar-
gued that using pre-trained DL architectures provides
a remarkable advantage over traditional handcrafted
methods. To diagnose Chronic Otitis, Wang et al.
proposed a deep-learning system that automatically
retrieved the region of interest from two-dimensional
CT scans of the temporal bone (Wang et al., 2020).
These authors asserted that their model’s performance
(83,3% sensitivity and 91.4% specificity) was equiva-
lent and, in some instances, superior to that of clinical
specialists (81,1% sensitivity and 88.8% specificity).
We have also adopted a DL approach to tackle the
DELC detection problem. In contrast, we aim to use
the ear as a marker for CAD.
Hirano et al. published an experimental study an-
alyzing DELC and CAD (Hirano et al., 2016). Their
research employed a handcrafted approach (manually
trimmed earlobes and a Canny edge detector) to de-
tect DELC in meticulously captured images. For this
experiment, 88 participants’ ears were photographed
from a single frontal angle. Only 16% of the partici-
pants were healthy. Unlike this study, we considered
images of ears in the wild, which varied greatly in
pose and illumination.
ICPRAM 2023 - 12th International Conference on Pattern Recognition Applications and Methods
76

AWE
DELC
ULPGC
shape
properties
AWE'
Pre-trained
Encoder
Classifier
Prediction
Prep-processing Classification
Figure 4: The proposed pipeline for the DELC detection system. The devised process comprises two main modules: the ear
pre-processing module and the classification module. In the first module, the DELC ULPGC+AWE’ dataset is generated and
passed to the second module, where features are computed. The resulting tensor acts as an input to the classifier, completing
the process.
3 DESCRIPTION OF THE
PROPOSAL
This paper presents and assesses a sequential training
pipeline consisting of two primary modules: a mod-
ule for the production of datasets and a module imple-
menting a pre-trained backbone followed by a train-
able classifier that computes a distance measure of the
generated embeddings. This distance metric is used to
calculate a loss function that is sent back to the classi-
fier. Figure 4 shows a schematic representation of the
approach described in this paper.
3.1 DELC ULPGC+AWE’ Dataset
To our knowledge, there is no DELC dataset avail-
able to the public. The collection procedure relies on
the idea of generability. We intend to develop robust
detection models for use in the field. This collection
of pictures was acquired from the Internet under un-
restricted conditions. Consequently, images exhibit
substantial differences in the pose, scale, and illumi-
nation (see Figure 3). The procedure involves four
steps:
1. Web scraping. We conducted a search using key
terms such as “DELC”, “Frank’s Sign”, and sev-
eral celebrity names to download images.
2. The labeling phase of ears includes trimming the
ear region. The selected tool to perform this task
is labelImg
1
. We did not differentiate ear sections;
the entire ear was cut off. Unlike earlier hand-
crafted techniques (Hirano et al., 2016), DL al-
gorithms can detect across a larger region. After
the second stage, the subset of 342 positive DELC
images is available.
1
https://github.com/heartexlabs/labelImg
3. We compute statistical shape properties (mean
and standard deviation) of the positive subset.
This information is later used to obtain the nega-
tive DELC subset. The mean shape of the positive
subset is 82 × 159.
4. We have considered the publicly available AWE
dataset to generate the negative subset (Emer
ˇ
si
ˇ
c
et al., 2017). The AWE data collection introduces
the concept of ear images captured in the wild.
Emersic et al. collected Internet-based celebrity
photos. Each subject comprises ten photos, rang-
ing in size from 15 × 29 pixels for the smallest
sample to 473 × 1022 pixels for the largest. We
selected this dataset due to the nature of the gath-
ering process, which is identical to ours. To this
end, we extracted images within the resolution of
the DELC-positive subset. Finally, to ensure no
DELC-positive samples were in the selected im-
ages, we examined them to generate a 350-image
subset of negative images, namely AWE’ subset.
3.2 The Proposed Architecture
The implemented encoding transforms the input data
into a vector of features. Initially, each input sample
is sent to the encoder that has been trained to extract
features. These encoders are trained on the ImageNet
dataset with 1000 distinct classes (Deng et al., 2009).
Convolutional layers closest to the encoder’s input
layer learn low-level features such as lines, whereas
layers in the middle of the encoder learn complicated
abstract characteristics. The last layers interpret the
retrieved features within the context of a classification
task.
The trainable classifier refines and condenses the
previously computed features into a smaller, more
specific set of features. It consists of two dense layers,
Deep Learning for Diagonal Earlobe Crease Detection
77
each with 1024 units. Finally, a sigmoid activation
function generates the classification output.
3.3 The Adopted Experimental Protocol
Data Augmentation. The collection under consider-
ation contains an insufficient number of samples. For
instance, nearly 350 samples per class are inadequate
to train a classifier without overfitting. A strategy
for augmenting data yielded 2100 photos per class.
The transformations utilized for data augmentation
include random brightness, random contrast, motion
blur, horizontal flip, shift, scale, and rotate (Buslaev
et al., 2020). Augmented subsets are exclusively uti-
lized for training purposes.
Backbone Comparison. Several pre-trained en-
coders were compared: VGGNet (Simonyan and Zis-
serman, 2015), InceptionV3 (Szegedy et al., 2016),
ResNet (He et al., 2016), Xception (Chollet, 2016),
MobileNet (Howard et al., 2017) and DenseNet
(Huang et al., 2016). As aforementioned, these back-
bones were trained using the ImageNet dataset with
1000 distinct classes (Deng et al., 2009). The pipeline
depicted in Figure 4 paired the considered pre-trained
encoder with a trainable classifier, utilizing the Adam
optimizer (Kingma and Ba, 2015) with a learning rate
of 10
−3
and a decay rate of 0.4.
4 EXPERIMENTAL SETUP
This section is divided into two subsections related to
the setup and results of the designed experiments. The
first subsection describes the technical details of our
proposal, such as the loss function and the data split.
The achieved results are summarized in the second
subsection.
4.1 Experimental Setup
As mentioned above, the classical detection scenario
in classification aims to determine which class be-
longs to a sample. In this regard, we have considered
two classes: DELC and not DELC. Since it is a bi-
nary classifier, the considered loss function to tackle
the problem is the binary cross-entropy:
Loss = −1/N ∗
N
∑
i=1
−(y
i
log(p
i
) + (1 − y
i
)log(1 − p
i
))
(1)
Where p
i
is the i-th scalar value in the model out-
put, y
i
is the corresponding target value, and N is the
number of scalar values in the model output.
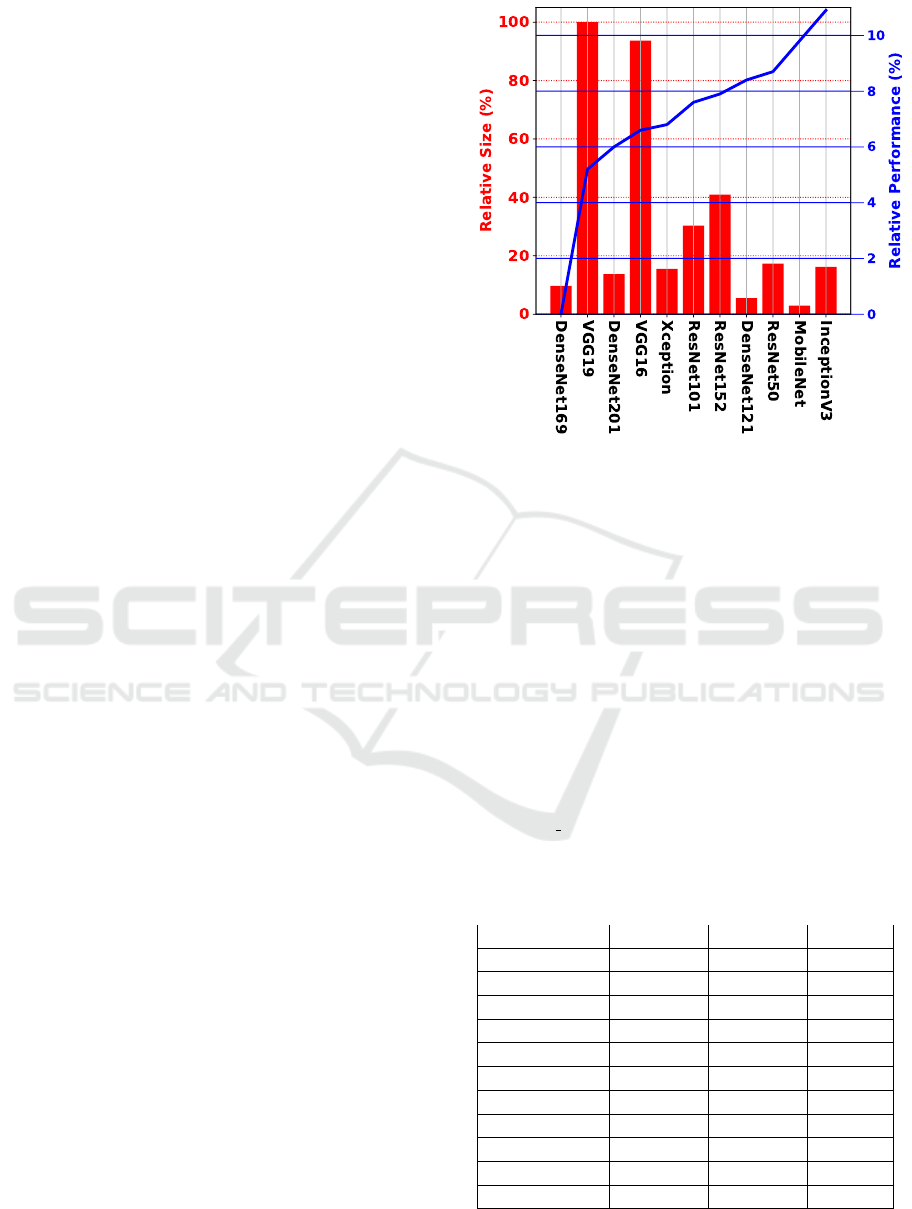
Figure 5: Relative comparison performance and size of
encoders. The blue line stands for the relative performance
between encoders, whereas the red bars stand for the rela-
tive size of the encoder. The higher the blue line, the better,
meaning a higher performance. The smaller the red bar,
the better, meaning the model is lighter than others with a
higher bar.
Finally, the results presented in this section refer
to the average accuracy on five repetitions of 9-fold
cross-validation. On average, 615 original samples
are selected for training, and the remaining 69 sam-
ples are used for the test. Contrary to test samples,
the selected training samples are augmented during
training.
Table 1: Absolute comparison of different backbones on
the DELC ULPGC+AWE’ dataset. The table is orga-
nized in terms of backbone, validation accuracy (Val. Acc.),
test accuracy (Test Acc.), and the number of parameters of
the backbone (#B
Param
). The bold entries show the best re-
sult and the lightest model.
Backbone Val. Acc. Test Acc. #B
Param
Xception 95,1% 94,1% 22.9M
VGG16 96,5% 93,9% 138.4M
VGG19 95,1% 92,7% 143.7M
ResNet50 98,1% 95,8% 25.6M
ResNet101 97,5% 94,8% 44.7M
ResNet152 97,8% 95,1% 60.4M
MobileNet 98,7% 96,7% 4.3M
InceptionV3 98,9% 9
9
97
7
7,
,
,7
7
7% 23.9M
DenseNet121 96,4% 95,5% 8.1M
DenseNet169 88,7% 88,1% 14.3M
DenseNet201 95,1% 93,4% 20.2M
ICPRAM 2023 - 12th International Conference on Pattern Recognition Applications and Methods
78
4.2 Results
Table 1 provides a summary of the results obtained of
the considered backbones. Validation and test accu-
racy are provided to demonstrate the absence of over-
fitting. As expected, validation accuracy exceeds test
accuracy by 1% to 3%. Adding additional layers or
epochs did not improve these results. The table also
displays the size of each backbone in millions of pa-
rameters. As can be seen, the backbone’s size does
not affect the model’s robustness.
Observing the table in detail, on the one side, it is
evident that almost all pre-trained encoders perform
remarkably detecting DELC. InceptionV3 achieves
the best result (97.7%), whereas DenseNet169
achieves the poorest (88.1%).
Figure 5 better explores the relationship between
backbones by displaying the relative performance
and size. From the robustness standpoint, it is
clear that InceptionV3 is more than 11% superior to
DenseNet169, the poorest backbone. VGG19 and
VGG16 are the most prominent models in size, while
the others fall between 20% and 40% below that size.
Figure 5 also highlights the relative significance
of size when addressing the DELC issue. As can
be seen, the smaller encoder within each family
usually provides a superior performance. For in-
stance, from the DenseNet models, DenseNet121
delivers a better outcome. The same is true for
VGG models (VGG16>VGG19) and ResNet models
(ResNet50>ResNet152>ResNet101).
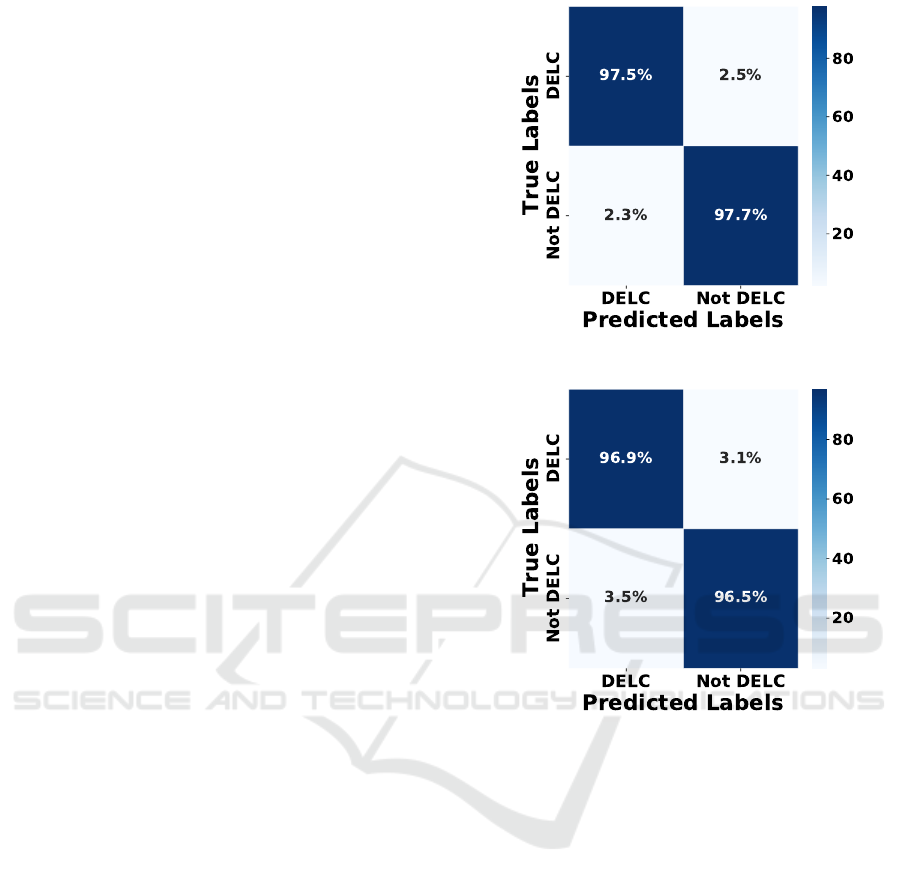
The two top models support the most pertinent
insight. An absolute difference of 1%, but the Mo-
bileNet encoder is five and a half times smaller than
the InceptionV3 encoder. In this regard, MobileNet
performs three times faster than InceptionV3. How-
ever, a further error analysis of their performance is
necessary to determine if their performance is robust
in terms of balance predictions. In this regard, Fig-
ures 6 and 7 provide a closer examination of their
confusion matrices. As can be seen, both models
exhibit quite balanced performance, with the Mo-
bileNet encoder being the most promising due to its
performance-size trade-off.
5 CONCLUSIONS
This paper presents a DELC classification analysis
to determine whether or not an ear image contains
Frank’s Sign. Our research has shown a relationship
between the size and performance of encoders. The
reported experiments revealed that ear images could
be used to sufficiently complete this task. Contrary
Figure 6: InceptionV3 Confusion Matrix.
Figure 7: MobileNet Confusion Matrix.
to the literature, we have demonstrated that no further
earlobe analysis is necessary.
Unlike prior research, our study focuses on images
in the wild. Our proposal includes the creation of a
positive DELC subset and using an existing dataset
(AWE dataset) to generate a negative DELC subset.
Due to the shared acquisition method, both datasets
can be considered valid for the task at hand: images
from the Internet in unconstrained environments. In
addition, data augmentation techniques are required
during training due to subset-size limitations.
We have effectively addressed this complex im-
age scenario that requires interpretation based on en-
coder performance and size. The exploited encoder
provides remarkable accuracy on the problem. How-
ever, we have shown that light-weight encoders usu-
ally perform better within the same backbones’ fam-
ily (ResNet, DenseNet, VGG). Moreover, due to
their performance-size trade-off (-1% performance,
x3 times faster and x5.5 times lighter), we suggest the
MobileNet as the most promising encoder.
Deep Learning for Diagonal Earlobe Crease Detection
79

This line of research presents numerous intrigu-
ing opportunities in healthcare scenarios. This pro-
posal presents an opportunity to optimize pathways
of diagnosis and prognosis and develop personalized
treatment strategies by creating and utilizing larger
datasets. Furthermore, analyzing pictures of earlobes
for non-invasive DELC detection is among the most
important applications. Besides, monitoring ears dur-
ing aging is possible and may provide patient-specific
insight into current health and alert medical staff to
risk situations.
ACKNOWLEDGEMENTS
We want to acknowledge Dr. Cecilia Meiler-
Rodr
´
ıguez for her creative suggestions and inspiring
ideas. This work is partially funded by the ULPGC
under project ULPGC2018-08, the Spanish Ministry
of Economy and Competitiveness (MINECO) under
project RTI2018-093337-B-I00, the Spanish Ministry
of Science and Innovation under projects PID2019-
107228RB-I00 and PID2021-122402OB-C22, and
by the ACIISI-Gobierno de Canarias and European
FEDER funds under projects ProID2020010024,
ProID2021010012 and ULPGC Facilities Net and
Grant EIS 2021 04.
REFERENCES
Alshazly, H., Linse, C., Barth, E., and Martinetz, T. (2019).
Handcrafted versus cnn features for ear recognition.
Symmetry, 11(12).
Ardila, D., Kiraly, A., Bharadwaj, S., Choi, B., and Shetty,
S. (2019). End-to-end lung cancer screening with
three-dimensional deep learning on low-dose chest
computed tomography. Nat Med, 25:954–961.
Boudoulas, K., Triposkiadis, F., Geleris, P., and Boudoulas,
H. (2016). Coronary Atherosclerosis: Pathophysio-
logic Basis for Diagnosis and Management. Prog.
Cardiovasc. Dis, 58:676–692.
Buslaev, A., Iglovikov, V. I., Khvedchenya, E., Parinov, A.,
Druzhinin, M., and Kalinin, A. A. (2020). Albumen-
tations: Fast and flexible image augmentations. Infor-
mation, 11(2).
Castrill
´
on-Santana, M., Lorenzo-Navarro, J., Travieso-
Gonz
´
alez, C. M., Freire-Obreg
´
on, D., and Alonso-
Hern
´
andez, J. B. (2018). Evaluation of local descrip-
tors and cnns for non-adult detection in visual content.
Pattern Recognition Letters, 113:10–18.
CDC (2022). About Multiple Cause of Death, 1999–2020.
Cha, D., Pae, C., Seong, S.-B., Choi, J. Y., and Park, H.-J.
(2019). Automated diagnosis of ear disease using en-
semble deep learning with a big otoendoscopy image
database. EBioMedicine, 45:606–614.
Chollet, F. (2016). Xception: Deep learning with depthwise
separable convolutions. CoRR, abs/1610.02357.
Deng, J., Dong, W., Socher, R., Li, L.-J., Li, K., and Fei-
Fei, L. (2009). Imagenet: A large-scale hierarchical
image database. In 2009 IEEE Conference on Com-
puter Vision and Pattern Recognition, pages 248–255.
Emer
ˇ
si
ˇ
c,
ˇ
Z.,
ˇ
Struc, V., and Peer, P. (2017). Ear recogni-
tion: More than a survey. Neurocomputing, 255:26–
39. Bioinspired Intelligence for machine learning.
Frank, S. (1973). Aural sign of coronary-artery disease.
IEEE Transactions on Medical Imaging, 289(6):327–
328.
Freire-Obreg
´
on, D., Barra, P., Castrill
´
on-Santana, M., and
de Marsico, M. (2022). Inflated 3D ConvNet context
analysis for violence detection. Machine Vision and
Applications, 33(15).
Freire-Obreg
´
on, D., Rosales-Santana, K., Mar
´
ın-Reyes,
P. A., Penate-Sanchez, A., Lorenzo-Navarro, J., and
Castrill
´
on-Santana, M. (2021). Improving user veri-
fication in human-robot interaction from audio or im-
age inputs through sample quality assessment. Pattern
Recognition Letters, 149:179–184.
Gald
´
amez, P. L., Raveane, W., and Gonz
´
alez Arrieta, A.
(2017). A brief review of the ear recognition process
using deep neural networks. Journal of Applied Logic,
24:62–70. SI:SOCO14.
He, K., Zhang, X., Ren, S., and Sun, J. (2016). Deep resid-
ual learning for image recognition. In 2016 IEEE
Conf. on Computer Vision and Pattern Recognition,
pages 770–778.
Hirano, H., Katsumata, R., Futagawa, M., and Higashi, Y.
(2016). Towards view-invariant expression analysis
using analytic shape manifolds. In 2016 IEEE Engi-
neering in Medicine and Biology Society, pages 2374–
2377.
Howard, A. G., Zhu, M., Chen, B., Kalenichenko, D.,
Wang, W., Weyand, T., Andreetto, M., and Adam,
H. (2017). Mobilenets: Efficient convolutional neu-
ral networks for mobile vision applications. CoRR,
abs/1704.04861.
Huang, G., Liu, Z., van der Maaten, L., and Weinberger,
K. Q. (2016). Densely connected convolutional net-
works. CoRR, abs/1608.06993.
Isgum, I., Prokop, M., Niemeijer, M., Viergever, M. A.,
and van Ginneken, B. (2012). Automatic coro-
nary calcium scoring in low-dose chest computed to-
mography. IEEE Transactions on Medical Imaging,
31(12):2322–2334.
Kingma, D. P. and Ba, J. (2015). Adam: A method for
stochastic optimization. In 2015 Int. Conf. on Learn-
ing Representations.
Lee, M. C. H., Petersen, K., Pawlowski, N., Glocker, B.,
and Schaap, M. (2019). TeTrIS: Template Trans-
former Networks for Image Segmentation With Shape
Priors. IEEE Transactions on Medical Imaging,
38(11):2596–2606.
Mallinson, T. and Brooke, D. (2017). Limited diagnostic
potential of diagonal earlobe crease. Annals of emer-
gency medicine, 70(4):602–603.
ICPRAM 2023 - 12th International Conference on Pattern Recognition Applications and Methods
80

Pasternac, A. and Sami, M. (1982). Predictive value of the
ear-crease sign in coronary artery disease. Canadian
Medical Association journal, 126(6):645–649.
Rodr
´
ıguez-L
´
opez, C., Garlito-D
´
ıaz, H., Madro
˜
nero-
Mariscal, R., and L
´
opez-de S
´
a, E. (2015). Earlobe
crease shapes and cardiovascular events. The Ameri-
can journal of cardiology, 116(2):286–293.
Sanchis-Gomar, F., Perez-Quilis, C., Leischik, R., and Lu-
cia, A. (2016). Epidemiology of coronary heart dis-
ease and acute coronary syndrome. Annals of Trans-
lational Medicine, 4(13):1–12.
Santana, O. J., Freire-Obreg
´
on, D., Hern
´
andez-Sosa, D.,
Lorenzo-Navarro, J., S
´
anchez-Nielsen, E., and Cas-
trill
´
on-Santana, M. (2022). Facial expression analysis
in a wild sporting environment. In Multimedia Tools
and Applications.
Simonyan, K. and Zisserman, A. (2015). Very deep convo-
lutional networks for large-scale image recognition. In
Bengio, Y. and LeCun, Y., editors, 2015 Int. Conf. on
Learning Representations.
Steinberg, A. and Rosner, F. (2003). Encyclopedia of Jew-
ish Medical Ethics. Encyclopedia of Jewish Medical
Ethics. Feldheim Publishers.
Stoyanov, G., Dzhenkov, D., Petkova, L., Sapundzhiev, N.,
and Georgiev, S. (2021). The Histological Basis of
Frank’s Sign. Head and neck pathology, 15(2):402–
407.
Szegedy, C., Vanhoucke, V., Ioffe, S., Shlens, J., and Wojna,
Z. (2016). Rethinking the inception architecture for
computer vision. In 2016 IEEE Conf. on Computer
Vision and Pattern Recognition, pages 2818–2826.
Tsao, C., Aday, A., Almarzooq, Z., Beaton, A., Bittencourt,
M., and Boehme, A. (2022). Heart Disease and Stroke
Statistics—2022 Update: A Report From the Amer-
ican Heart Association. Circulation, 145(8):e153–
e639.
Wang, Y., Li, Y., Cheng, Y., He, Z., and D, R. (2020). Deep
Learning in Automated Region Proposal and Diagno-
sis of Chronic Otitis Media Based on Computed To-
mography. Ear and Hearing, 41(3):669–677.
Wieckowski, K. (2021). Diagonal Earlobe Crease (Frank’s
Sign) for Diagnosis of Coronary Artery Disease: A
Systematic Review of Diagnostic Test Accuracy Stud-
ies. Journal of clinical medicine, 10(13).
Wolterink, J. M., Leiner, T., Takx, R. A. P., Viergever,
M. A., and Isgum, I. (2015). Automatic coronary cal-
cium scoring in non-contrast-enhanced ecg-triggered
cardiac ct with ambiguity detection. IEEE Transac-
tions on Medical Imaging, 34(9):1867–1878.
Yamak, D., Panse, P., Pavlicek, W., Boltz, T., and Akay, M.
(2014). Non-calcified coronary atherosclerotic plaque
characterization by dual energy computed tomogra-
phy. IEEE Journal of Biomedical and Health Infor-
matics, 18(3):939–945.
Zeleznik, R., Foldyna, B., Eslami, P., Weiss, J., Alexan-
der, I., Taron, J., and Aerts, H. (2021). Deep convo-
lutional neural networks to predict cardiovascular risk
from computed tomography. Nature Communications,
12(1):715.
Zeng, X., Jiang, Z., Luo, W., Li, H., Li, H., Li, G., Shi, J.,
Wu, K., Liu, T., Lin, X., Wang, F., and Li, Z. (2021).
Efficient and accurate identification of ear diseases us-
ing an ensemble deep learning model. Scientific Re-
ports, 11(1).
Zhao, F., Wu, B., Chen, F., He, X., and Liang, J. (2019). An
automatic multi-class coronary atherosclerosis plaque
detection and classification framework. Medical & Bi-
ological Engineering & Computing, 57(1):245–257.
Zreik, M., van Hamersvelt, R. W., Wolterink, J. M., Leiner,
T., Viergever, M. A., and Isgum, I. (2019). A recur-
rent cnn for automatic detection and classification of
coronary artery plaque and stenosis in coronary ct an-
giography. IEEE Transactions on Medical Imaging,
38(7):1588–1598.
Deep Learning for Diagonal Earlobe Crease Detection
81
