
Predicting the Socio Economic Status of end Users of a Maternal
Health App by Machine Learning
Rajanikant Ghate
1,*
, Sumiti Saharan
1
and Rahee Walambe
1,2
1
Avegen Ltd, London, U.K.
2
Symbiosis Institute of Technology (SIT), Symbiosis Centre for Applied AI (SCAAI),
Symbiosis International University, Pune, India
Keywords: Socio-Economics Status (SES), Impact Analysis, Maternal Health, Machine Learning.
Abstract: Digital technologies posit an immense opportunity to provide scalable solutions for narrowing the health
equity gap and proving affordable access to quality healthcare in low resource settings. A key step towards
harnessing the power of digital health is developing a scalable mechanism for identifying the socioeconomic
profile of end users. Socio-economic status (SES) of individuals has been classically estimated through
standard questionnaires. This methodology is not scalable and prone to immense bias if implemented digitally
as a self-report questionnaire. Together for Her (TFH) is a digital app for pregnancy that aims to provide
equitable access to quality pregnancy information and support to pregnant women in India. To assess our
reach to users from low socio-economic settings, we developed a machine learning model that leverages
digital indices for estimated SES. We propose this approach holds immense value for digital health
interventions, both as a mechanism for gaining insight on the socio-economic profile of users being reached
and as an evaluation metric for interventions aimed at driving health equity.
1 INTRODUCTION
Maternal health is an extremely challenging and
relevant problem in today’s world. Globally,
approximately 300,000 maternal deaths occur each
year. Out of these, at least 35,000 deaths are reported
in India. A vast majority of these deaths (94%) are
preventable and occur in low-resource settings
(WHO, 2019). One of the key factors contributing to
these figures is the lack of access to quality relevant
information on healthy nutrition and other antenatal
behaviours. Knowledge on mitigating and/or
managing pregnancy risk is poor in PW in India. Our
research shows that >30% of PW don’t even know
what pregnancy risk means (unpublished). Only
58.1% of PW complete the minimal WHO-mandated
4 ANC check-ups (Ministry of Health and Family
Welfare, 2021). Adherence to healthy lifestyles
during and shortly after pregnancy combined with
good quality health care are considered major
safeguards against maternal and neonatal mortality.
The democratization of mobile technologies has
been a game-changer and represent a potent
opportunity to addressing challenges to healthcare
access and are a powerful tool for driving equitable
healthcare access. India has been at the forefront of
the digital inclusion story, with smartphone adoption
increasing from 22% in 2017 to 51% in 2020 (GSMA
Connected Society, 2021). As per the recent India
Index 2020-2021 report (NITI Aayog, 2021) 55%
have internet connections and this number will
increase exponentially with headways in affordability
and coverage as well as the accelerated digital uptake
due to Covid-19.
As such, mobile technology posits an immense
opportunity to provide scalable solutions for
supporting pregnant women from low resource
settings through digital apps. Avegen (Avegen, n.d)
launched the Together for Her (TFH) (Together For
Her, 2020), a digital pregnancy care program for
pregnant women in India that aims to provide
equitable affordable access to quality pregnancy
information and support. The TFH application guides
and supports pregnant women towards healthy
behaviours during pregnancy and after delivery. TFH
provides personalised expert-curated antenatal
information for pregnant women based on their
pregnancy week and health status. As of 22-Sep-
2022, the app has been downloaded by 1,000,000+
pregnant women and has over 20,000 daily active
86
Ghate, R., Saharan, S. and Walambe, R.
Predicting the Socio Economic Status of end Users of a Maternal Health App by Machine Learning.
DOI: 10.5220/0011641700003414
In Proceedings of the 16th International Joint Conference on Biomedical Engineering Systems and Technologies (BIOSTEC 2023) - Volume 5: HEALTHINF, pages 86-93
ISBN: 978-989-758-631-6; ISSN: 2184-4305
Copyright
c
2023 by SCITEPRESS – Science and Technology Publications, Lda. Under CC license (CC BY-NC-ND 4.0)

users. A pilot randomized clinical trial with TFH
demonstrated that PW using TFH have significantly
improved health literacy and dietary behaviours
(Dieteren, et al, 2022).
A key challenge in tracking and amplifying
equitable access for digital health solutions like TFH
is understanding the socioeconomic profile of the
users. Inferring the SES of app users is important to
understand the app’s impact on driving equitable
access. Additionally, it opens the possibility for
targeted marketing and outreach experiments, to help
amplify equitable reach. Finally, it adds a critical
layer of personalization in terms of providing relevant
offerings to end users. There are various standard
scales and methods for estimating the SES (Kishore,
J, et al, 2017; P Arun, 2014) of a person in India.
These scales typically use information such as
income, education, or asset possession. From an
application context standpoint, each of these methods
has its own merits and demerits.
A major limitation of these methods is the
dependency on people’s responses to sensitive
information such as income. Such questions are not
relevant from the context of the app and hence
requesting such information directly through the app
is intrusive to the users’ privacy. Many users can
rightfully refuse to provide such information,
resulting in a smaller assessment sample.
Additionally, such response-based methods are
inherently biased towards educated users as well as
towards engaged users with higher motivation
towards interacting with the app and responding to
questions. Consequently, there is a need for a more
automated approach for determining users’ SES.
Researchers have broadly followed two
approaches for SES estimation. In the first approach
type, models have been built to estimate the wealth
index/ relative wealth index of geographical locations
(Fatehkia, et al, 2020). Then by fetching the user's
location SES distribution can be estimated. Such an
approach lacks accuracy, especially in urban settings
where the diversity within proximity is high, and
where a user might be granting access to their location
at locations such as workplaces which is not exactly
the place of residence.
In the second type of approach, models have been
trained at user-level data such as by their mobility
(Xu, et al, 2020) and extent of mobile app usage (Ren,
et al, 2019) and social media activity patterns, along
with their social network and choice of language
(Aletras, et al, 2018; Lampos, et al, 2016).
In 2020, Meta Platforms Inc, formerly known as
Facebook Inc, received a patent grant which was
titled as “Socioeconomic group classification based
on user features” (Sullivan B, et al, 2020). The
classifier in this work is a machine learning model
and has been built to estimate the socioeconomic
group without directly asking the income to the users.
It uses information such as demographic data, device
ownership, travel history, internet usage and
household data as input to the model.
In most of the approaches above where prediction
is made from indirect data, user’s social interaction,
social circle and their posts are key information.
However, in the context of TFH, where users neither
interact with other users, nor do they submit free form
text such an approach is not possible. Also,
information about other app usage is not available.
The digital information available to us is app
usage log, engagement pattern and in-app responses
in form of questions, feedback requests and quizzes.
Some of the in-app questions can be relevant to the
care programme as well as indicative of their SES.
However, barely 10% of the active users (based on
previous data of TFH), usually respond to the in-app
questions. Another challenge of deploying a machine
learning model trained on digital information of app
usage alone is train-serve skew or drift in actual
pattern if the app features change (Janiesch, et al,
2021). Considering the proliferation of digital care
programme apps, it’s essential to constantly enhance
apps not just to stay ahead of competition but also to
improve the user’s outcome. The challenge in
assessing if the model has train serve skew, is its
dependency on ground truth values of serving
samples using standard SES techniques, which is a
cumbersome and non-scalable process.
In this work, we propose an approach that can
build a machine learning model using the limited
available digital information as well as re-train the
model without collecting ground truth. Such an
approach will be able to identify SES of users without
directly receiving inputs from all the users. As a
result, enabling care programme product managers to
reach out to that section of the society which
otherwise would always experience a sub-optimal
impact.
For this study, the primary data has been
geographically limited to users in India. However, the
proposed approach is conceptually generic.
In summary, the contribution of the work is
twofold:
1) Established a set of questions that are proxy to
the standard SES method. These questions are
less direct and more relevant from the care
programme’s point of view.
2) A machine learning model is trained using the
limited available digital information and it is
Predicting the Socio Economic Status of end Users of a Maternal Health App by Machine Learning
87

demonstrated that the model can be re-trained
with set frequency without the need for ground
truth collection each time. This will enable
predictions for users who do not answer proxy
questions.
The paper is organised in four sections. Section 2
discusses the methods employed for this study. It
includes the approach for primary data collection and
annotation, SES estimation and model selection and
validation. Section 3 presents the results and
comparative analysis of various approaches reported
in section 2. Section 4 concludes the paper.
2 METHODS
2.1 Primary Data - Collection and
Annotation Strategy
2.1.1 Ground Truth - SES Label
To develop a model, the input data should be labelled
with the ground truth value. In this scenario, as the
task is about identifying the SES of a user, each user
in the training and validation set should be labelled
based on the established standard techniques of SES
identification. The most recent classification
established by the Market Research Society of India
(MRSI) has been used for ground truth annotation (P
Arun, 2014).
The method involves responses to the occupation
and highest education of the family chief as well as
details on whether the family possesses some specific
assets. Based on the response to this questionnaire, a
user was classified into one of the 12 categories that
are A1, A2, A3, B1, B2, C1, C2, D1, D2, E1, E2 and
E3. A1 corresponds to the highest socioeconomic
class while E3 corresponds to the lowest
socioeconomic class.
2.1.2 Proxy Questions
Another set of questions framed were proxy to
standard SES classification. As defined in the
introduction, these are more relevant from the
programme’s execution and the responses to these
questions can be a good indicator of SES class. Table
1 provides the list of these questions. These proxy
questions haven’t been defined in the literature and
are specific to this problem scenario. Hence the direct
relation between the responses of these questions with
standard SES classification isn’t known and has been
established in this work. This required responses to
both the ground truth questions and proxy questions
for the same set of users.
Table 1: Proxy questions list.
# Question Answe
r
1. Do you have
your own
smart
p
hone?
a) Yes
b) No
2. If you don’t,
then how do you
access this app?
a) On smartphone of
some other family
member/ husband
b) On smartphone
owned by friend
nei
g
hbou
r
3. How do you
usually travel
for your check-
u
p
s?
a) Public transpor
t
b) Private car
c) Private scooter/bike
d
)
Taxi
2.1.3 Data Collection
For data collection, telephonic calls were made to
randomly identified 4500 users. Out of these 2520
received the call and 987 agreed to give the responses
and lastly, only 849 users had non-missing data. Only
the users who agreed were requested for answers to
the above two questionnaires. This data was then
anonymized for the data analysis.
Corresponding to the users whose questionnaire
responses were received, a log of their events on their
first day of install was processed for digital data
features. The digital activity log is stored in BiqQuery
(Google Cloud, n.d.) using Firebase (Firebase, n.d.)
events. Each recorded action such as a scroll or a
swipe is considered as an event. Following features
were engineered from the digital activity log on the
day of install:
● Total events
● Distinct events
● Users’ response (in form of “Yes”, “No” or
“Don’t know”) to the presence of
○ Anaemia
○ Diabetes
○ High or low BP
● If they searched for a hospital through the
app
● Latitude and longitude
● Variance in latitude and longitude
● Number of times swiped through different
gestational weeks sections
● Unique screens visited
HEALTHINF 2023 - 16th International Conference on Health Informatics
88
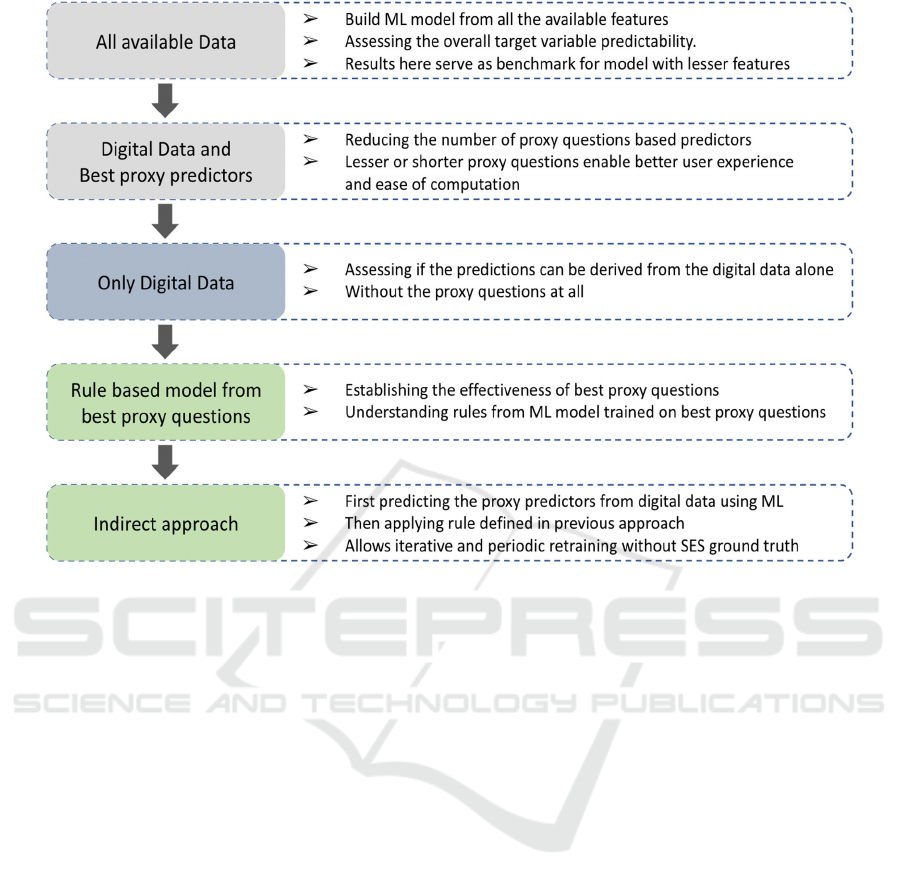
Figure 1: Summary of all approaches.
Apart from the activity log, the following meta
data for each user was also extracted for the analysis:
● Acquisition source (such as Google,
Facebook, organic, etc.)
● Mobile brand and model name
● Operating system and version
● Mobile language
● App language
2.2 SES Estimation
Post data collection, concatenation, and the SES
annotation of the users, only the SES class label (A1
to E3) was retained in the data. Other personal details
as well as detailed responses to the standard SES
identification questionnaires were removed before
carrying out the analysis.
The data curated for the analysis had 3 sections
for each anonymized user:
● The responses to the proxy questions
● The digital data
● SES class
Considering the objective of research to understand
reach to the lower SES class, the machine learning
problem defined was a binary classification, that is to
identify if a user belonged to a low SES class or not.
Categories ‘D1’ to ‘E3’ were marked as ‘low’. Out of
the 849 users, 221 users belonged to category ‘low’.
Classification model was first built using all the
data. This was done to assess the overall target
variable predictability. Also, the results achieved in
this approach were used as a benchmark for models
with lesser features.
In the next set of approaches, models were built
with reduced proxy questions as well as with no proxy
questions. This is because proxy questions, if they
must be deployed, eventually go into the programme
as pop-ups or in-app quizzes. So, fewer the number of
proxy questions the model relies on, easier the
approach in terms of computation and end user
experience, as users will see less in app questions.
Once more important proxy questions were
identified, the machine learning model trained from
these questions was reduced to a simple rule-based
algorithm (RBA). Often RBAs are much simpler to
explain and implement than machine learning models
if the logic is clear and precise (B Andrew, 2020).
Also, building an RBA from proxy questions not just
established the relationship between proxy questions
and low SES, but this additionally enabled an indirect
approach of predicting the proxy questions responses
first from the digital data and then applying RBA. All
the approaches have been summarized in the Fig. 1.
Predicting the Socio Economic Status of end Users of a Maternal Health App by Machine Learning
89
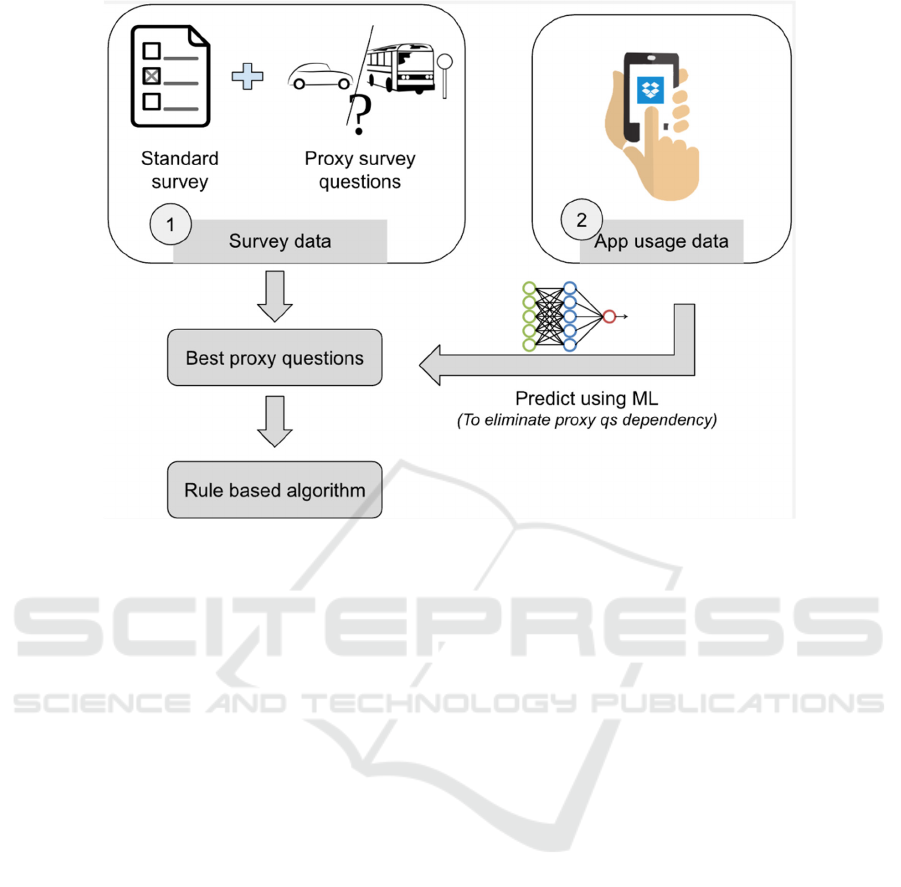
Figure 2: Indirect approach.
The rationale for trying indirect models was that
the models built directly using the digital data will
soon become outdated if the app evolves or even as
the technology evolves. For example, the number of
users with android version less than 10 will become
way fewer than the number observed as of now. This
train-serve skew will require models to be re-
validated and retrained with high frequency
demanding cumbersome ground truth collection for
each retraining. This will make the model practically
challenging to implement. Secondly, despite the
chances of the proxy questions being answered by a
small proportion of users through the app, this data
will support constant re-training of machine learning
models that predict proxy questions’ responses.
Hence indirect approach simplifies the retraining
process to an extent that it can be automated.
Pictorial representation of the indirect approach
has been illustrated in the Fig. 2.
2.3 Model Selection and Validation
Methodology
Since the focus was a binary classification approach,
observation of following metrics was of importance:
● Elements of confusion matrix:
○ True positive
○ True negatives
○ False negatives
○ False positives
● Binary classification metrics:
○ Accuracy
○ Precision
○ Recall
○ F1-score
Considering the robustness to overfitting and
tolerance to mislabelling, a random forest algorithm
was trained and evaluated (Sarica, et al, 2017). Two
hyperparameters adjusted for better results were
“class_weight” and “max_depth” (Pedregosa, et al,
2011). Class weight was set as “balanced” to reduce
bias arising from the majority class and max depth
was limited to ‘6’ in order to reduce over-fitting.
For validation, 5-fold cross validation analysis
was performed. Average of binary classification
metrics and sum of confusion matrix elements have
been reported.
2.4 Proposed Deployment Architecture
Deployment will comprise of static trained model,
that will be tested and re-updated time to time. The
trained models will be exported as “.pkl” files using
python google colab file.
HEALTHINF 2023 - 16th International Conference on Health Informatics
90
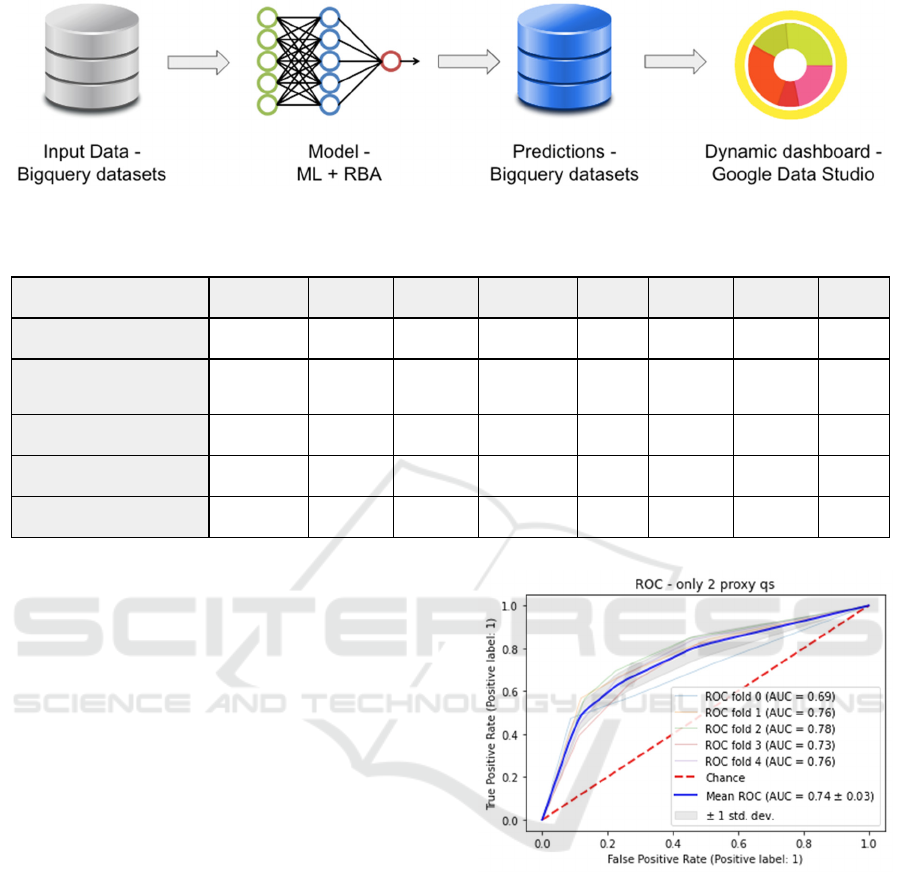
Figure 3: Proposed Deployment Architecture.
Table 2: Results summary.
Approach Precision Recall F1-score Accuracy TP TN FP FN
All data 0.63 0.63 0.63 0.81 139 545 83 82
Best proxy questions +
di
g
ital data
0.51 0.57 0.54 0.75 126 508 120 95
Only digital data 0.27 0.32 0.29 0.59 70 435 193 151
RBA performance 0.60 0.49 0.54 0.78 109 557 71 112
Indirect Approach 0.35 0.29 0.31 0.67 63 509 119 158
Once the proxy questions will be available for the
users through the care program, responses to that
along with the other interaction data will be stored in
big query datasets. A batch processing scheduled job
will process the input datasets and return predictions.
A dynamic visualization dashboard has been set up
on google data studio pointing to the predictions
dataset. This proposed deployment architecture has
been illustrated in Fig. 3.
3 RESULTS
Classification results for all the approaches have been
summarized in Table 2.
Model built from all data resulted in accuracy of
0.81 (81%) with F1-score of 0.63. RBA built from
best proxy questions resulted in accuracy of 0.78 with
F1-score of 0.54. Indirect approach versus direct
approach from digital data (using all digital data for
prediction) resulted with accuracies of 0.67 and 0.59.
ROC curve for models built from only 2 proxy
questions in a 5-fold validation setup has been
displayed in Fig. 4. ROC curve for each of the
validation fold as well as mean ROC curve has been
compared with the line of chance. The mean ROC
covered mean area of 0.74 under the curve with a
standard deviation of 0.03.
Figure 4: ROC curve for the model built from only 2 proxy
questions.
4 CONCLUSION
In this work, we presented an approach to estimate the
SES of an end user for Together for Her maternal
healthcare app. Inferring the SES of app users is
important to understand the app’s impact on driving
equitable access. The standard scales and methods for
estimating the SES of a person is based on leading
questions on education and income.
However, such a method is highly biased towards
the educated group of users and hence an indirect
approach is essential for SES estimation. The results
Predicting the Socio Economic Status of end Users of a Maternal Health App by Machine Learning
91

presented demonstrate that the proxy questions can be
used to estimate the SES. However, it is also evident
that without relying on the proxy questions, based on
the direct data of an user and retraining of the machine
learning model the indirect approach employed Rule
based method can be effectively used. Even from the
results point of view, the indirect approach is better
than predictions from direct digital data. However,
the performance can be improved by collecting more
data. Additionally, a set of questions that are proxy to
the standard SES method is established. These
questions are less direct and more relevant from the
care programme’s point of view. The methods
proposed on this work can be extended to any such
digital application.
ACKNOWLEDGEMENTS
We thank the pregnant women who responded to the
socio-economic questionnaire. The Together For Her
program is run by Avegen Pvt Ltd and supported by
funding from MSD, through its MSD for Mothers
initiative and is the sole responsibility of the authors.
MSD for Mothers is an initiative of Merck & Co.,
Inc., Rahway, NJ, USA. MSD had no role in the
design, collection, analysis and interpretation of data,
in writing of the manuscript or in the decision to
submit the manuscript for publication. The content of
this publication is solely the responsibility of the
authors and does not represent the official views of
MSD.
REFERENCES
WHO. (2019, September). Maternal mortality.
URL:https://www.who.int/en/news-room/fact-sheets/
detail/maternal-mortality [last accessed: 09-Oct-2022].
Ministry of Health and Family Welfare. (2021, April).
National Family Health Survey 5. URL:
https://main.mohfw.gov.in/sites/default/files/NFHS-
5_Phase-II_0.pdf [last accessed: 09-Oct-2022].
GSMA Connected Society. (2021). The State of Mobile
Internet Connectivity. URL: https://www.gsma.com/
r/wp-content/uploads/2021/09/The-State-of-Mobile-
Internet-Connectivity-Report-2021.pdf [last accessed:
09-Oct-2022].
NITI Aayog. (2021). Sustainable development goals. URL:
https://www.niti.gov.in/writereaddata/files/SDG_3.0_
Final_04.03.2021_Web_Spreads.pdf [last accessed:
09-Oct-2022].
Avegen.(n.d). Leading the transformation in Digital
Healthcare. URL: https://avegenhealth.com/ [last
accessed: 09-Oct-2022]
Together For Her. (2020). Pregnancy care, as it should be.
URL: https://www.togetherforher.com/ [last accessed:
09-Oct-2022].
Dieteren, C., Sarkar S., Saharan S., and Bonfrer I. (2022).
Effects of a smartphone application on maternal health
knowledge and dietary diversity among pregnant
women in India: a randomized single center pilot study.
Journal of Global health reports, Manuscript accepted.
Kishore, J., Kohli, C., Kumar, N., & Gupta, N. (2017).
Scales used in India to Evaluate Socio-economic Status
in Medical Research: Limitations of Existing Scales
and the need of a more Comprehensive One. JIMSA,
30(2), 66.
P Arun. (2014, May). New Socio-Economic Classification:
Know Where You Stand. Trak.in. URL:https://trak.in/
tags/business/2011/05/30/new-sec-socio-economic-
classification/ [last accessed: 22-Sep-2022].
Fatehkia, M., Tingzon, I., Orden, A., Sy, S., Sekara, V.,
Garcia-Herranz, M., & Weber, I. (2020). Mapping
socioeconomic indicators using social media
advertising data. EPJ Data Science, 9(1), 22.
Xu, F., Lin, Z., Xia, T., Guo, D., & Li, Y. (2020). Sume:
Semantic-enhanced urban mobility network embedding
for user demographic inference. Proceedings of the
ACM on Interactive, Mobile, Wearable and Ubiquitous
Technologies, 4(3), 1-25.
Ren, Y., Mai, W., Li, Y., & Chen, X. (2019, July).
Predicting socio-economic levels of individuals via app
usage records. In International Conference on Machine
Learning and Intelligent Communications (pp. 199-
210). Springer, Cham.
Lampos, V., Aletras, N., Geyti, J. K., Zou, B., & Cox, I. J.
(2016, March). Inferring the socioeconomic status of
social media users based on behaviour and language. In
European conference on information retrieval (pp. 689-
695). Springer, Cham.
Aletras, N., & Chamberlain, B. P. (2018). Predicting twitter
user socioeconomic attributes with network and
language information. In Proceedings of the 29th on
Hypertext and Social Media (pp. 20-24).
Sullivan B, Karthikeyan G, Liu Z, Massa W, Gupta M.
(2020). Socioeconomic group classification based on
user features. Patent number: US10607154B2.
Janiesch, C., Zschech, P., & Heinrich, K. (2021). Machine
learning and deep learning. Electronic Markets, 31(3),
685-695
Google Cloud. (n.d.). What is BigQuery. URL:
https://cloud.google.com/bigquery/docs/introduction
[last accessed: 26-Sep-2022].
Firebase. (n.d.). Make your app the best it can be. [last
accessed: 14-Oct-2022]. URL: https://firebase.google.
com/
B Andrew, Capital One. (2020, August). A Modern
Dilemma: When to Use Rules vs. Machine Learning.
URL: https://www.capitalone.com/tech/machine-learn
ing/rules-vs-machine-learning/ [last accessed: 22-Sep-
2022].
Sarica, A., Cerasa, A., & Quattrone, A. (2017). Random
forest algorithm for the classification of neuroimaging
HEALTHINF 2023 - 16th International Conference on Health Informatics
92

data in Alzheimer's disease: a systematic review.
Frontiers in aging neuroscience, 9, 329.
Pedregosa, F., Varoquaux, G., Gramfort, A., Michel, V.,
Thirion, B., Grisel, O., & Duchesnay, E. (2011). Scikit-
learn: Machine learning in Python. the Journal of
machine Learning research, 12, 2825-2830.
Predicting the Socio Economic Status of end Users of a Maternal Health App by Machine Learning
93
